 Observation of liquid glass in suspensions of ellipsoidal colloids
Proceedings of the National Academy of Sciences of the United States of America


Edited by Pablo G. Debenedetti, Princeton University, Princeton, NJ, and approved December 6, 2020 (received for review August 27, 2020)
Author contributions: M.F. and A.Z. designed research; J.R., A.L., and J.-M.M. performed research; J.R. and A.L. analyzed data; and J.R., A.L., J.-M.M., M.F., and A.Z. wrote the paper.
1J.R. and A.L. contributed equally to this work.
2Present address: Department of Applied Physics, Eindhoven University of Technology, 5600 MB Eindhoven, The Netherlands.

- Altmetric
Using tailor-made colloids and confocal microscopy, we study the effect of shape on the glass transition in 3D suspensions of ellipsoidal colloids. Experimental data, supporting simulations, and a theoretical analysis reveal a unique state: liquid glass. In liquid glasses, orientational degrees of freedom are frozen whereas translation is free. Global nematic order is absent. We show that, in the liquid glass state, nematic precursors as hitherto unknown structures exist. In these, nematic order is suppressed by the intersection of clusters of ordered particles with differently ordered particles. Our data thus give insight into the glass transition and reveal an additional state of matter. The latter is expected to also have implications in liquid crystal formation.
Despite the omnipresence of colloidal suspensions, little is known about the influence of colloid shape on phase transformations, especially in nonequilibrium. To date, real-space imaging results at high concentrations have been limited to systems composed of spherical colloids. In most natural and technical systems, however, particles are nonspherical, and their structural dynamics are determined by translational and rotational degrees of freedom. Using confocal microscopy of fluorescently labeled core–shell particles, we reveal that suspensions of ellipsoidal colloids form an unexpected state of matter, a liquid glass in which rotations are frozen while translations remain fluid. Image analysis unveils hitherto unknown nematic precursors as characteristic structural elements of this state. The mutual obstruction of these ramified clusters prevents liquid crystalline order. Our results give insight into the interplay between local structures and phase transformations. This helps to guide applications such as self-assembly of colloidal superstructures and also gives evidence of the importance of shape on the glass transition in general.
Suspensions of colloidal particles are widely spread in nature and technology and have been studied intensely over more than a century. When the density of such suspensions is increased to high volume fractions, often their structural dynamics are arrested in a disordered, glassy state before they can form an ordered structure. While this puts limits on technical applications, knowledge gained from investigations of phase transformations of colloidal suspensions provides insight into similar phenomena in a broad range of complex glass-forming materials, ranging from metals to biological cells (12–3). The colloidal glass transition has therefore been considered a model that features many of the glass transition phenomena found in atomic and molecular systems (4). Being big enough to allow their real-space observation using optical microscopy, but small enough to remain suspended over extended periods, colloids in such model systems are employed as “big atoms” (5) that can be investigated on an individual particle basis (6, 7). By analyzing the trajectories of thousands of particles, detailed insights into glass phenomena, such as dynamic heterogeneities of collectively rearranging structures, have been obtained (8, 9).
To date, most experiments of this type have been done using spherical colloids. The recent interest in synthetic colloids as material building blocks (10, 11), however, has led to the development of a multitude of novel techniques for the synthesis of colloidal particles with specific geometries and interactions (1213–14). This now allows investigations of the phase transformations in dense suspensions of shape-anisotropic particles, which promises to give unique insight into structural dynamics of complex systems. Highly elongated colloidal rods, for instance, show arrested texture dynamics in suspensions far in the nematic regime (15, 16). The simplest deviation from spherical symmetry is uniaxial stretching to prolate ellipsoids (17, 18). Already, for these simple particles, theory and simulations predict a rich phase diagram (19), including jammed states (20), and complex glass formation (212223–24) due to the presence of translational and rotational degrees of freedom. These predictions also have implications for molecular liquid crystalline materials (25, 26). However, the few investigations of glass-forming suspensions of ellipsoids have all been focused on static structures obtained by driving particles in external gravitational or electric fields (272829–30). The only investigations on steric effects of ellipsoid shape have been performed in two-dimensional (2D) films (26, 3132–33). To date, hardly any experimental data on the influence of steric factors on the phase transformation in three-dimensional (3D) ellipsoidal suspensions exist.
Here, we present particle-resolved studies of the structural dynamics of concentrated ellipsoidal colloid suspensions at a nonequilibrium phase transformation. The experiments were performed on a large range of different volume fractions. Mode coupling theory (MCT) predicts that, in systems of this type, a liquid glass should exist in which particle rotation is frozen whereas their translation is still liquid (21). We used quantitative optical microscopy in combination with a novel type of core–shell particles (34) to simultaneously track translational and rotational particle motion with high precision (35). Upon increasing the volume fraction , we find that rotational degrees of freedom undergo a glass transition before translational dynamics are arrested, such that a liquid glass is formed. To understand the nature of the observed rotational and translational glass transitions, we further corroborate our results with an MCT analysis and Brownian dynamics simulations and find that long-range correlations are the cause for the emergence of this unique state. Detailed image analysis reveals that hitherto unknown nematic precursors exist as the characteristic structural elements of the liquid glass. They consist of ramified aligned regions intersected by differently ordered or disordered regions and appear to mediate the long-range correlations present in the liquid glass state of particle suspensions. Our experiments give a first impression of the complex behavior of colloidal suspensions arising from the introduction of the simplest geometrical distortion of the particles’ shape from sphericity. They show how sterical factors lead to the emergence of peculiar local structures mediating long-range spatial correlations which result in the formation of amorphous states preempting the globally ordered state.
Results and Discussions
In our experiments, we used ellipsoidal polymethylmethacrylate (PMMA) colloids with a long semiaxis of m and a short semiaxis of m, that is, an aspect ratio of (Fig. 1A). The particles were sterically stabilized and suspended in a density- and refractive index-matched solvent mixture (36). Tracking of particle positions and orientations was facilitated by using particles with core–shell geometry where the spherical core and the ellipsoidal shell were labeled with different fluorophores (37). Using confocal laser scanning microscopy, we typically recorded the temporal development of the 3D particle positions and orientations for more than 6,000 particles with accuracies of 60 nm and , respectively (35) (Fig. 1B). Since volume fractions are the pivotal variable in all of the experiments, we took utmost care in their determination (see Materials and Methods for details). In order to validate the experimental results, we performed event-driven Brownian dynamics (ED-BD) simulations that model overdamped dynamics of hard ellipsoids (38). The system consisted of nonoverlapping ellipsoids in a cubic simulation box of length that was varied depending on the desired . Results from experiments and computer simulations were analyzed using MCT.

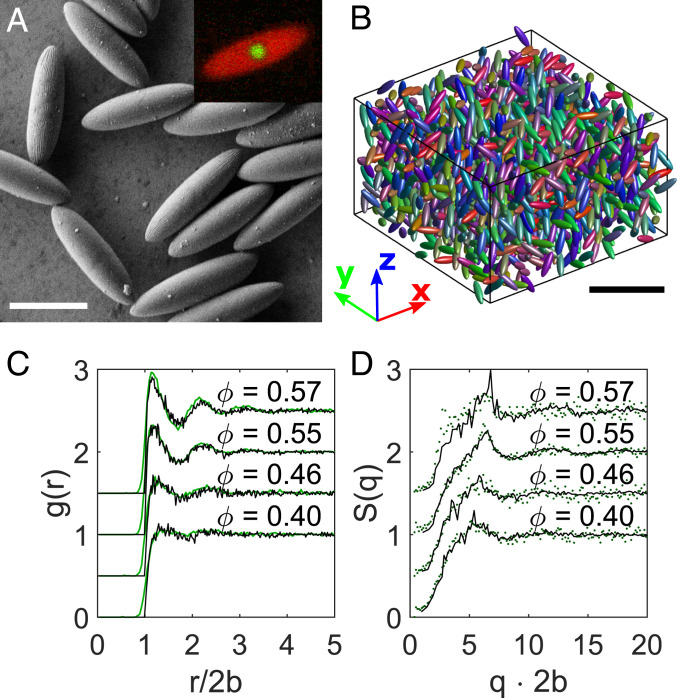
Characterization of ellipsoidal colloids and their packings. (A) Scanning electron microscope image of the ellipsoidal colloids with aspect ratio . Inset shows a confocal microscopy image, highlighting the core–shell structure. (Scale bar, m.) (B) Computer rendered 3D reconstruction of a subset of a sample volume at with the red–green–blue value of the color indicating the particle orientations. (Scale bar m.) (C) Pair correlation function and (D) structure factor for from experiment (green points) and simulation data (black lines). Distances are rescaled by the ellipsoid width .
Structural Correlations and Lack of Order.
To gain insight into the systems’ behavior, we first extracted the pair correlation functions and equilibrium structure factors from the 3D particle positions at different (Fig. 1 C and D). With increasing , we observe the emergence of next-neighbor and second next-neighbor peaks in while long-range correlations are absent. At the same time, in , the inverse peak position , indicating the average particle separation, becomes smaller with increasing density. All observations are typical for liquid-like structural correlations and show that the systems remained in a disordered state without translational order for all investigated . The excellent coincidence between the measured and with those obtained by the ED-BD simulations confirms that, in the suspensions, our elliptical colloids interacted like hard particles. A further support for the hard particle potentials of our system comes from the lack of formation of nematic or smectic phases known from charged particles (compare below) (39, 40).
The equilibrium phase diagram of ellipsoids predicts the transition to a nematic state with increasing (19); thus we determined the orientational order of the whole sample. It is probed by calculating the nematic order parameter (22), which is the eigenvalue possessing the largest absolute value of the nematic order tensor . The nematic order tensor is given by

Nematic order parameter obtained from the nematic tensor . (A) for different , indicating the absence of a global particle alignment in the experimental system. (B) Time evolution of the nematic order parameter for different , again showing no signs of an evolving directional order.
Dynamical Signatures of Glass Formation.
The absence of structural order even in very dense suspensions hints at the possible formation of a glass. To verify this, it is necessary to investigate the structural relaxation dynamics of the suspensions. The translational and rotational dynamics of the system are contained in the temporal evolution of the self part of the density correlation function
Fig. 3 A, C, and E describes the translation behavior and depicts the experimentally determined values for each . In Fig. 3A, the wavevector is set to (namely, ) which corresponds to the maximum in the static structure factor and thus to the average particle distance. In Fig. 3C, a larger wavevector, (), is selected, where the relaxation is faster and the final decay can be resolved well in fluid states. Correlation functions obtained for different values of can be superimposed by scaling with for low as is expected for the dynamics of isolated ellipsoids (SI Appendix, Fig. S1). For a liquid state, one expects the translation correlators to decay completely over time. During the measurement time, this is observed for volume fractions up to . The curves obtained for are already stretched and thus show a slowing down of the decay dynamics, but one can still assume their complete decay albeit at times longer than those probed. The states at thus are fluid-like. By contrast, at the highest volume fraction , the translational correlator does not decay any more, which is seen by the clear plateau for translational motion typical for a glass state. From these observations, we conclude that, for translational dynamics, a glass transition occurred between and .
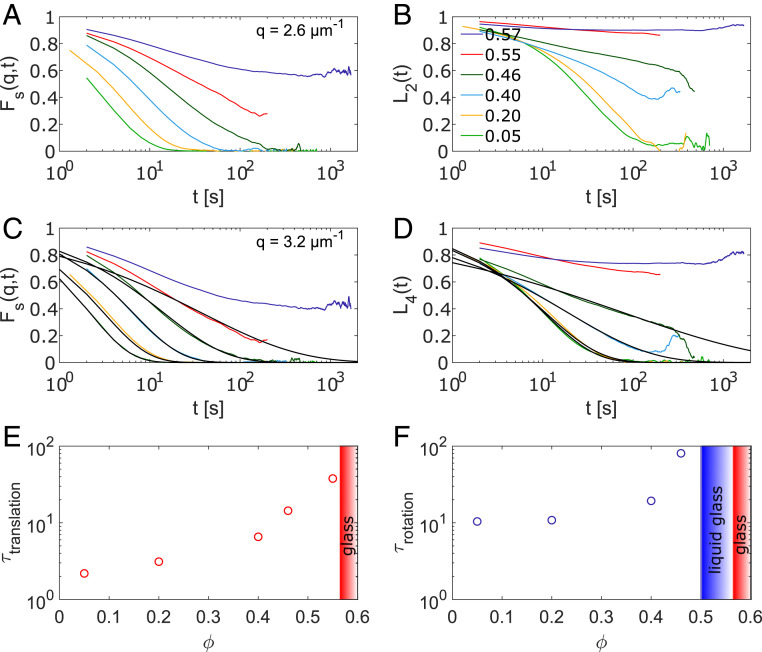
Temporal correlation functions capturing translational and rotational dynamics for different . A and C depict the self part of the density correlation at wavelengths comparable to the average particle separation, namely, (A) and (C), respectively. B and D show the orientational correlation function for and ; the legend in B gives the packing fractions for A–D. Close to the glass transition, the decay of the curves is too slow to be captured within the measurement times. C and D include fits to the correlators in fluid states using the Kohlrausch function Eq. 4. E and F show the relaxation times obtained from the fits. The colored regions mark the glass transitions and which were obtained by the MCT glass stability analysis (see Materials and Methods).
Fig. 3 B and D depicts the temporal relaxation behavior of the rotation correlators for and , respectively. A comparison with their translational counterparts, illustrated in Fig. 3 A and C, clearly shows the differences in the translational and rotational relaxation of the suspensions. For volume fractions , a complete relaxation of orientational correlation is observed even if the curves for are already stretched significantly. However, for the two highest , a clear plateau indicative of incomplete relaxation appears in both orientational correlation functions. These frozen orientational correlations are clear signs of glass-like behavior. Plateaus in the orientational correlation functions could also arise from nematic ordering. The observed values for the plateau heights, however, are too large to be compatible with the negligible nematic order of our samples. In nematic states, the relation holds (41), and the small values of the order parameter from Fig. 2 are incompatible with the high amplitudes of frozen-in orientational correlations. We thus conclude that the data show a glass transition in the rotational dynamics occurring between and .
The inspection of Fig. 3 leads to the conclusion that two different glass transitions, one in the orientational and a second one in the translational motion, exist. To gain more insight into this phenomenon, we turn to a quantitative analysis. In fully relaxing systems, the long-time decay, often termed -relaxation, can be fitted with a Kohlrausch function (42),
A quantitative determination of the at which the glass transition for translation and rotation occurs is obtained by the glass stability analysis of MCT (43) (compare Materials and Methods). Performing such an analysis, we find that satisfactory fits to the data (Fig. 3 E and F) can only be obtained assuming two different glass transitions, and . Therefore, also, this analysis shows the existence of two separate glass transitions for rotation and translation in the experiment.
In summary, the analysis of the systems’ dynamics reveals that we observed a density region where orientational motion in the sample was frozen while translational motion persisted. As this state lacks global nematic order, it is properly described as a liquid glass (21).
ED-BD Simulations Pointing to Nematic Correlations.
The interpretation of experimental results obtained from colloidal suspensions often is complicated by the fact that the particles possess a certain polydispersity and might carry residual charges. Since these problems are nonexistent in simulations, the latter are an important tool even if the number of particles which can be studied in this manner is typically rather small. To understand the origin of the formation of liquid glass in our system, we performed additional ED-BD simulations. We found that nematic order sets in quickly using monodisperse ellipsoids and periodic boundary conditions (PBCs) in accordance with previous simulation studies (22, 44). Therefore, we tested different scenarios that could explain the formation of the experimentally observed glass states. First, since the experimental system is inherently polydisperse, we included polydispersity in our simulations. However, we found that a polydispersity of 5 to 15%, well above that of the experimental particle system used, did not affect the structure and dynamics of the system. Second, in order to prevent the formation of nematic order, we introduced rough walls in our simulations. The approach of confining glass-forming liquids has been used experimentally (45) and in simulations (46) for studies of polydisperse spheres. Indeed, we find that nematic order is suppressed in systems with rough walls. Results for the dynamics of this system are shown in Fig. 4 for and . Here, is shown, as it exhibits glassy dynamics more clearly than . The lines represent the MCT fitting curves obtained from Eqs. 6 and 7. Up to , both correlation functions decayed to fluid states, while, at and , the system was already very close to the glass phase. However, in contrast to the experiments, the simulations still result in a single value for the glass transition of .
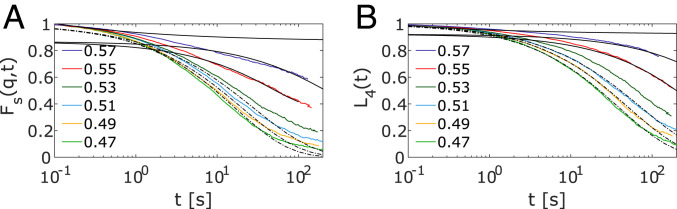
Glass transition analysis of simulation data. (A) Translational for and (B) orientational correlation functions from ED-BD simulations, where long-range nematic fluctuations are suppressed by rough walls. An MCT glass stability analysis (black lines for the two highest densities; compare Materials and Methods) finds a single glass transition density in this case. The value is also supported by a power law fit (with ) to the Kohlrausch relaxation times for both translation and rotation.
While the latter discrepancy between the experimental system and simulations appears dissatisfying, it allows us to formulate a working hypothesis on the prerequisites for the formation of a glass and a liquid glass, respectively: It is known, from experiments on suspensions of spherical colloids, that the glass transition at the higher results from isotropic caging (42). This is accessible by simulation if nematic order is suppressed by the introduction of rough walls. Under this condition, the build-up of local neighbor shells leading to caging is possible already in small systems (24). The growing fluid structure is reflected in the evolution of the structure factor shown in Fig. 1D. By contrast, the formation of a liquid glass above and below requires long-range correlations, which cannot be captured in the simulation box sizes currently accessible. This is especially true for shape anisotropic particles, for which it has been shown that simulations are susceptible to finite size effects (47). Solvent-mediated interactions, which were neglected in the simulations, could also play a role, but have been shown to be of minor importance in the structural dynamics of spherical colloids (48). We therefore conjecture that the discrepancy between experiment and simulations reveals that the nature of the observed liquid glass state is relying on long-range correlations.
Nematic Precursor Analysis.
To identify these long-range correlations and to test our hypothesis, we analyzed the spatial correlations in the samples. A close inspection of the imaging data reveals clusters of similarly oriented particles in the system. Two particles are assigned to the same precursor cluster, if they are next neighbors sharing a face of their individual Voronoi cells and have an angular difference in orientation which is less than . The choice of is based on the half-width of the peak in the probability distribution of the orientation of all ellipsoids in systems at high (Fig. 5D). Clusters are defined as nematic precursors, if they contain more than 30 particles. The choice of 30 particles is based on the largest cluster sizes found for , which corresponds to an isotropic sample. Since the clusters do not form nematic regions (Fig. 5H), we term them nematic precursors. Fig. 5 A–C depicts the 20 largest nematic precursors for the three highest studied. In general, we find that the number of particles in nematic precursors increases with growing , as shown in Fig. 5G. Also, the cluster size distributions become broader with increasing packing fraction. Our findings show that, with increasing to densities where we find glassy states, more and more particles are found in local structures with a peculiar order. In these, no nematic order is detected even on small length scales, because other particles and clusters intersect the nematic precursors. This is exemplified in Fig. 5E, where the green particles belong to a nematic precursor whereas the blue particles are disordered surrounding particles intersecting the cluster. A local analysis of the nematic order shows this quantitatively. To this end, we divided the sample into equal subboxes and calculated the maximal of the order tensor Eq. 1 per subbox. We started with subboxes containing an average of particles and gradually increased their size up to particles. The mean and variance of vs. the number of particles contained in the subboxes are plotted in Fig. 5H. The results show a quick drop of the local order parameter to low values with increasing particle number. Uniform order does not extend to more than roughly 20 particles. In the vicinity of the glass transition, orientational correlations exist among many particles (Fig. 5G), but still the nematic order parameter remains negligible (Fig. 5H). Nematic order formation is found only for particles with larger aspect ratios (49). The existence of the nematic precursors is also visible in the orientational structure factor, , which reflects the density fluctuations of quadrupolar symmetry, , proportional to the spherical harmonic for and (21) (SI Appendix). It is sensitive to the growth of nematic structures, which shows up as a peak for small wavevectors, and has been identified as correlation driving the glass transition at in MCT (21). Fig. 5F (note the log-linear plotting) shows that the large- peak in , which records the orientational alignment of neighboring particles, remains rather unchanged while, upon increasing , the nematic precursors cause a growing peak at small wavevectors. Its width measures the average size of the clusters, which exceeds the average particle separation by roughly a decade. We have carefully evaluated other possible causes for the appearance of long-wavelength fluctuations and could exclude them for the following reasons: 1) Repulsive or attractive forces between the particles would cause differences in the pair correlation and structure factor data derived from experiment and simulation, which is not the case (Fig. 1). 2) The effect of polydispersity was found to be negligible in additional simulations. 3) Scanning electron microscope images (Fig. 1A) show the particles to be smooth on a scale of tens of nanometers, which rules out surface roughness. 4) Thermal fluctuations were fully included in the simulations, and 5) hydrodynamic interactions are considered insignificant at these volume fractions (48). 6) Mermin–Wagner fluctuations, which were suggested to affect glass formation in 2D ellipsoids (50), do not exist in 3D systems. Our data therefore suggest that nematic precursors are the hallmark of the long-wavelength fluctuations observed in bulk liquid glass.
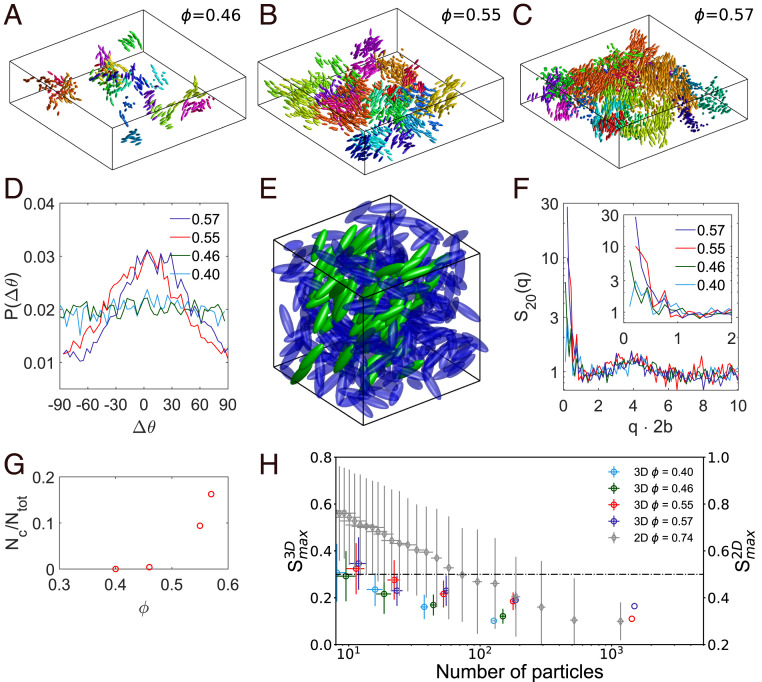
Analysis of nematic precursors in the experimental system at high densities. (A–C) A 3D representation of the 20 largest clusters with similar orientation, defined as described in the text, for different showing the existence of nematic precursors which are intercepting each other. Box size is m each. All particles are scaled by a factor of 0.8 for better visibility. (D) Probability distribution of the orientation of all ellipsoids in the system for different . For increasing , a favored orientation is emerging, indicating nematic precursors but no apparent nematic order. (E) The green particles belong to one cluster with similar orientation, while the surrounding blue particles are in an amorphous arrangement or belong to clusters of different orientations. The hindrance between the different precursors prevents global nematic order. Box size is m. (F) Orientational structure factor obtained from spatially correlating the orientations of all particles. Its dominating small- peak records the growth of the nematic precursors. Inset shows zoom in on low values. (G) Normalized cluster size for high , where is the number of particles within a cluster and the total number of particles within the image volume. The cluster size is increasing for higher . (H) Dividing the sample into equal subboxes, the mean and variance of 1) nematic order parameter and 2) number of particles per subbox are shown. The 3D liquid glass remains isotropic even for small subboxes. In 2D glasses of ellipsoidal colloids (31), nematic domains containing close to 100 particles exist. The dashed-dotted line marks the isotropic–nematic transition; note the different axes for 3D and 2D.
The finding of a liquid glass state and of nematic precursors in a system of colloidal ellipsoids in three dimensions is in stark contrast to experimental and theoretical results for colloidal ellipsoids confined in two dimensions (31, 51). While, for an aspect ratio of , the 2D studies also show the appearance of a state in which rotational dynamics is frozen and translational mobility persists, the structural order of this state is very different from the 3D case, as, in two dimensions, domains with high nematic order are found. Repeating the local analysis of the nematic order parameter with 2D data from ref. 31, Fig. 5H shows that homogeneously aligned nematic subboxes can comprise up to a hundred particles in 2D glasses. For the comparison in Fig. 5H, we used and 0.5 as a criterion for the isotropic–nematic transition in three dimensions and two dimensions, respectively (22, 52). The analysis reveals that pseudonematic domains exist in two dimensions; the local structure in three dimensions, however, remains isotropic even at the lengthscale of the smallest subbox.
Conclusions
Hard ellipsoidal particles are a relatively simple system posing an entropic packing problem only slightly more intricate than the one of spheres. Considering this, the richness of the states diagram of equilibrium and kinetically arrested states is striking. As is well known since Onsager’s work on thin needles, above a specific density, hard elongated particles align locally for entropic reasons. Unexpectedly, for an intermediate aspect ratio of the ellipsoidal colloids, local alignment gets frustrated on intermediate length scales, and ramified, differently oriented regions result. Our simulations show that polydispersity plays no major role, and we thus expect the formation of such liquid glasses driven by differently aligned cooperative regions to exist in other glass-forming systems as well. This effect thus needs to be considered in the active concerted efforts to form structured materials from colloidal constituents. Our findings suggest that obtaining high order will require strong enthalpic contributions. The emerging nematic precursors contain hundreds of particles, and it is the mutual obstruction of these cooperative regions that leads to the formation of liquid glass. Their sizes are quantified in the orientational structure factor . We showed that the critical long-range fluctuations connected with nematic ordering, which is a weakly first-order phase transition, are involved in the formation of this unique glassy state. This should be contrasted with the familiar glass transition which tracks the crystallization line, where a strongly first-order phase transition takes place. Thus, the liquid glass state may give the long-sought paradigm where the interplay between equilibrium critical correlations and critical slowing down versus glass formation can be studied microscopically. This promises to shed light on the origins of dynamic heterogeneity in molecular systems. Additionally, it could also result in an intriguing venue for future studies concerning the formation and evolution of topological defects. While, on a molecular scale, these dominate the phase-ordering dynamics in liquid crystals (53), they also serve as a model system for the evolution of matter in the universe according to the Kibble–Zurek mechanism (54). In both cases, the glassy arrest observed in our results will have an important influence on the resulting structures.
Materials and Methods
Experimental Methods.
In a first step, spherical PMMA/PMMA core–shell particles dyed with different fluorophores in the cores and the shells were synthesized according to a route described in refs. 35 and 55. As fluorophores for the cores, we used the Bodipy dye ((4,4-difluoro-8-(4-methacrylatephenyl)-3,5-bis-(4-methoxyphenyl)-4-bora-3a,4a-diaza-s-indacene), which was synthesized according to ref. 56. The dye Quasar 670 (LGC Biosearch Technologies) served as a marker for the shells and was used in the form of a 4-vinylbenzylester. For core particle synthesis, the dye was linked to methacrylic acid (Fluka) and copolymerized. The cores were cross-linked using ethylene glycol dimethylacrylate. The resulting particle cores had a diameter of 1m. Several seeded dispersion polymerization steps were then used to grow a PMMA shell of the desired thickness onto these cores. The PMMA in the shell material was not cross-linked.
In a second step, the particles were thermomechanically stretched as reported by Keville et al. (17), with modifications for the PMMA/PMMA core–shell particles as described in refs. 34, 37, and 57. After the stretching, the ellipsoidal particles were restabilized with polyhydroxystearic acid and dispersed in a mixture of 85:15 (w/w) cyclohexylbromide (CHB) and cis-decalin to match both the density and refractive index of the PMMA colloids (36). Since PMMA particles are known to charge in organic solvents, tetrabutylamoniumbromide was added to screen the charges.
The resulting suspensions were placed into a home-built sample chamber. Samples were studied using a confocal laser scanning microscope (TCSP5, Leica Microsystems) equipped with a resonant scanner (8 kHz, bidirectional mode) and a glycerol objective (63×, NA 1.30). An argon laser (wavelength nm) and a helium neon laser ( nm) were used for excitation of the dyes. The temperature of the whole microscope system was stabilized at C (Ludin Cube 2, Life Imaging Services), since, at this temperature, the density match between particles and solvent was optimal. Volume fractions up to were prepared by centrifugation at higher temperature and the removal of excess solvent. The highest were obtained by slightly raising the temperature in a dense sample directly in the measurement chamber for a few days to achieve density mismatch. This led to the slow enrichment of particles at the bottom of the sample.
The temperature was then changed back to C. After placing a sample onto the microscope, it was allowed to equilibrate for 15 h to minimize drift effects. Remaining drift, which, in all cases, was small compared to the particle movement, was corrected with a routine applied after detection and tracking. To minimize wall effects, all measurements were performed in a depth of 30 m to 100 m into the sample. Positions and orientations of all particles in one image volume (144 m m m for structural analysis and 144 m m m for measurements on the dynamics) containing more than 6,000 particles were identified and linked to trajectories using self-written and tested Matlab algorithms. The core–shell structure facilitates tracking of the ellipsoid position and orientation with accuracies of 60 nm and , respectively (35) (Fig. 1B). Experimental timescales were limited by the bleaching of the fluorophores after long laser exposure.
Volume fractions are the pivotal variable influencing the structural dynamics of the colloidal suspensions. For their determination, particles were detected and counted in each measured sample, and the related Voronoi volume was calculated to obtain the exact number fraction . Multiplying this with the volume of a particle gives ,
Glass Stability Analysis.
The values for the glass transitions for translation and rotation are found by the glass stability analysis of MCT in which the collection of all measured correlation functions is used. Close to the glass transition , a critical decay onto the plateau occurs in a correlation function (e.g., the translation or the rotation correlator functions and , respectively). Using first-order correction terms (43), the decay is given by
Below , the late plateau and the decay from the plateau is given by the von Schweidler law,
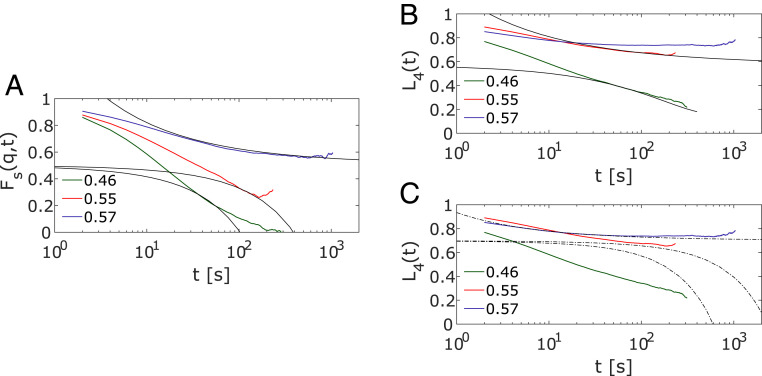
Glass stability analysis of (A) translational and (B) rotational relaxations: Data from experiment (colored lines) and fits (solid lines) according to Eqs. 6 and 7. Two different glass transitions for translation and rotation are necessary to fit the data. In C, the gray dash-dotted lines indicate the result, when an identical transition density is assumed for translation and rotation. For this condition, poor agreement with the data at is observed.
Simulation Details.
We performed ED-BD simulations (20, 38) that model overdamped Brownian dynamics of hard ellipsoids. The system consisted of nonoverlapping ellipsoids in a simulation box of length and volume that was varied depending on the desired . Similar to De Michele et al. (22), we set the moment of inertia to . For volume fractions of , ellipsoids were placed randomly in the simulation box, while, for volume fractions between and , the Lubachevsky–Stillinger (58) technique was used. All systems were equilibrated by Newtonian dynamics, allowing translational and rotational correlation functions to decay to zero. Two types of boundary conditions were modeled. The first case corresponds to systems with PBCs with . The second case corresponds to systems confined within rough walls. For the confined systems, we started from a random configuration of 1,231 ellipsoids and pinned the outermost particles in the range and to serve as the wall particles. The remaining 500 particles were free to move. The ED-BD model was first benchmarked for a dilute system of , where we reproduced the ratio of translational and rotational diffusion coefficients found in the experiments: , setting the ratio of Brownian time steps (with short enough to give angular diffusion). This ratio was then applied to all . At all densities, the timescale, when matching to the experiments, is taken from . All presented results were averaged from 20 initial configurations of the ellipsoids.
Acknowledgements
We thank S. Schütter and F. Rabold for particle synthesis, Dr. P. Pfleiderer for his contribution on particle detection, Dr. M. Gruber for calculations on the schematic Mode-coupling theory model, and Profs. Dr. H. Lekkerkerker, Dr. G. Maret, and Dr. R. Schilling for helpful discussions. We thank Profs. Dr. Z. Zheng and Dr. Y. Han for discussions and the exchange of data. We gratefully acknowledge the financial support by the Deutsche Forschungsgemeinschaft, Grant: Sonderforschungsbereich 1214, B5. J.-M. M. acknowledges funding provided by the Alexander von Humboldt Foundation.
Data Availability.
ASCII data have been deposited in Zenodo (59). All study data are included in the article and SI Appendix.
References
1
2
3
4
6
7
8
9
11
12
13
14
15
16
17
18
19
20
21
22
23
24
25
26
27
28
29
30
31
32
33
34
35
36
37
38
39
40
41
42
43
44
45
46
47
48
49
50
51
52
53
54
55
56
57
58
59