 Coexistence of three liquid phases in individual atmospheric aerosol particles
Proceedings of the National Academy of Sciences of the United States of America


Edited by Thomas Peter, Institute for Atmospheric and Climate Science, ETH Zurich, Zurich, Switzerland, and accepted by Editorial Board Member Akkihebbal R. Ravishankara March 2, 2021 (received for review February 7, 2021)
Author contributions: Y.H., F.M., and A.K.B. designed research; Y.H., S.X., M.S., and A.Z. analyzed data; Y.H., F.M., and A.K.B. wrote the paper; Y.H., F.M., and S.X. performed experiments; M.S. and A.Z. set up the kinetic and thermodynamic models and performed the simulations; and A.K.B. oversaw the project.
1Present address: Anton Paar Canada Inc., Saint Laurent H4R 2Z8, QC, Canada.

- Altmetric
Aerosol particles are ubiquitous in the atmosphere and play an important role in air quality and the climate system. These particles can contain mixtures of primary organic aerosol, secondary organic aerosol, and secondary inorganic aerosol. We show that such internally mixed particles can contain three liquid phases. We also demonstrate that the presence of three liquid phases impacts the time needed for the particles to reach equilibrium with the surrounding gas phase and likely impacts the ability of the particles to activate into cloud droplets. A framework is presented for predicting conditions needed for the formation of three liquid phases in the atmosphere. These results will lead to improved representations of aerosols in models for air quality and climate predictions.
Individual atmospheric particles can contain mixtures of primary organic aerosol (POA), secondary organic aerosol (SOA), and secondary inorganic aerosol (SIA). To predict the role of such complex multicomponent particles in air quality and climate, information on the number and types of phases present in the particles is needed. However, the phase behavior of such particles has not been studied in the laboratory, and as a result, remains poorly constrained. Here, we show that POA+SOA+SIA particles can contain three distinct liquid phases: a low-polarity organic-rich phase, a higher-polarity organic-rich phase, and an aqueous inorganic-rich phase. Based on our results, when the elemental oxygen-to-carbon (O:C) ratio of the SOA is less than 0.8, three liquid phases can coexist within the same particle over a wide relative humidity range. In contrast, when the O:C ratio of the SOA is greater than 0.8, three phases will not form. We also demonstrate, using thermodynamic and kinetic modeling, that the presence of three liquid phases in such particles impacts their equilibration timescale with the surrounding gas phase. Three phases will likely also impact their ability to act as nuclei for liquid cloud droplets, the reactivity of these particles, and the mechanism of SOA formation and growth in the atmosphere. These observations provide fundamental information necessary for improved predictions of air quality and aerosol indirect effects on climate.
Atmospheric aerosols are airborne suspensions of microscopic particles and are a major contributor to poor air quality, which causes respiratory and cardiovascular disease and results in over 3 million premature deaths globally per year (1). Atmospheric aerosols also modify climate by scattering and absorbing solar radiation and by serving as nuclei for liquid cloud droplets (2) and ice crystals (3). To predict the impacts of aerosols on air quality and climate, information on the number and types of phases present in atmospheric particles is needed. This is because the number and types of phases govern important aerosol processes and properties including aerosol growth and evaporation, optical properties, reactivity, and the ability of aerosols to act as nuclei for liquid cloud droplets and ice crystals (3456789101112–13). Nevertheless, our understanding of the phase behavior of atmospheric aerosols is far from complete, resulting in large uncertainties when predicting aerosol effects on air quality and climate.
A large fraction of atmospheric aerosols can be classified as primary organic aerosol (POA), secondary organic aerosol (SOA), and secondary inorganic aerosol (SIA). POA is emitted directly into the atmosphere. In contrast, SOA and SIA are formed in the atmosphere by gas and condensed-phase reactions. All three types of aerosols are abundant in and downwind of urban areas (14). Field measurements have also shown that POA, SOA, and SIA often become internally mixed in and downwind of urban areas (15161718–19). For example, Moffet and Prather (20) showed that primary aerosol particles are internally mixed with secondary aerosol on a timescale of 3 h in Riverside, United States, and Mexico City, Mexico. Cross et al. (21) showed that POA particles are internally mixed with secondary aerosol on a timescale of 30 min during mid to late morning in Mexico City, Mexico. Moreover, measurements by Vester et al. (18) showed that 20 to 40% of secondary aerosols are internally mixed with primary aerosols in the urban areas of Mainz, Germany. Mechanisms for the formation of these internally mixed particles include coagulation, gas–particle partitioning, cloud processing, and multiphase chemical reactions (5, 15, 22, 23). We refer to particles containing POA, SOA, and SIA as POA+SOA+SIA particles.
Previous studies on the phase behavior of atmospheric particles have focused on pure SIA (24), pure SOA (10, 13), mixtures of POA and SOA (252627282930–31), and mixtures of SOA and SIA (11, 32). These studies have often been carried out as a function of relative humidity (RH) since RH often cycles between low and high values in the atmosphere and since RH can impact the phase behavior of aerosol particles (11, 24, 32). Studies with mixtures of POA and SOA have shown that one or two liquid phases can form in individual particles, depending on the POA properties, SOA properties, and RH (252627282930–31). Similarly, studies with mixtures of SOA and SIA revealed that one or two liquid phases can form depending on the SOA properties, SIA properties, and RH (11, 32). Surprisingly, in a recent study, three liquid phases were observed in some mixtures of SOA and SIA proxies (33). However, two liquid phases were reported in the majority of those experiments, and conditions favoring three liquid phases were unclear and not elucidated.
The phase behavior of particles containing POA, SOA, and SIA have so far only been investigated using molecular dynamics simulations of nanoparticles less than 10 nm in diameter (34). Three separate chemically distinct domains were observed in these simulations, but laboratory studies are needed in order to confirm these predictions, especially for particles with larger diameters, which make up the vast majority of the mass of atmospheric particulate matter.
In the current study, a solvatochromic dye and fluorescence microscopy are used to determine the phase behavior of POA+SOA+SIA particles as a function of RH. Although solvatochromic dyes have been used widely in biology and chemistry (e.g., ref 35), they have, so far, not been used to characterize the phase behavior of atmospheric aerosols. We demonstrate that POA+SOA+SIA particles can often contain three distinct liquid phases. In addition, thermodynamic equilibrium predictions and associated kinetic gas–aerosol simulations are used to quantify possible atmospheric implications of these experiments. We show that the coexistence of three liquid phases in POA+SOA+SIA particles impacts their equilibration timescales with the surrounding gas phase and likely their ability to act as nuclei for liquid cloud droplets, with possible implications for interpreting field studies and predicting aerosol effects on climate.
Results and Discussion
In the first series of experiments, we studied particles containing a mixture of squalane (proxy for POA), 1 out of 21 different oxygenated organic compounds (proxy for SOA), and ammonium sulfate (a major type of SIA in the atmosphere). Squalane has an elemental oxygen-to-carbon (O:C) ratio of 0, similar to POA emitted from diesel and gasoline engines (26, 36). The 21 oxygenated organic molecules chosen for this study have molar masses between 92.1 and 600 g ⋅ mol−1, carbon numbers between 3 and 12, and O:C ratios ranging from 0.33 to 1.17 (SI Appendix, Table S1), covering the range of average O:C values of most atmospheric SOA particles (37).
To determine the phase behavior of POA+SOA+SIA particles, trace amounts of Nile red (9-diethylamino-5H-benzo[α]phenoxazine-5-one) were embedded within the particles. Nile red is a solvatochromic dye that fluoresces at different wavelengths depending on the polarity of the surrounding chemical environment (38). After Nile red was embedded in the particles, images of the particles were recorded as a function of RH using fluorescence microscopy (see Materials and Methods). For our experimental conditions, Nile red fluoresced green to yellow in a low-polarity organic-rich phase and orange to red in a higher-polarity organic-rich phase (SI Appendix, Fig. S1). On the other hand, Nile red was nonfluorescent in an aqueous phase due to its low solubility and quantum yield in water (38).
One of the striking results from our study is that when the O:C value of the SOA proxy was less than 0.8, in almost all cases (14 out of 16 cases), we observed three phases coexisting within the same particle over a wide RH range. Shown in Fig. 1 A and B and Movies S1 and S2 are images for two of these cases as the RH was decreased from ∼95 to 0%. At 90% RH, the particles contained two liquid phases, namely a low-polarity organic-rich phase (indicated by the green to yellow color) and an aqueous phase (indicated by the dark color or absence of fluorescence). We refer to the aqueous phase as an aqueous inorganic-rich phase since ammonium sulfate, which has a high solubility in water, will most likely partition predominantly into this phase. At 70% and 50% RH, the particles contained three liquid phases, namely a low-polarity organic-rich phase, an aqueous inorganic-rich phase, and a higher-polarity organic-rich phase (indicated by the orange to red color). At 30 and 0% RH, ammonium sulfate was predominately present in crystallized form inside the particle, as indicated by the irregular structure of the particle cores, resulting in particles containing two liquid phases and one crystalline phase.

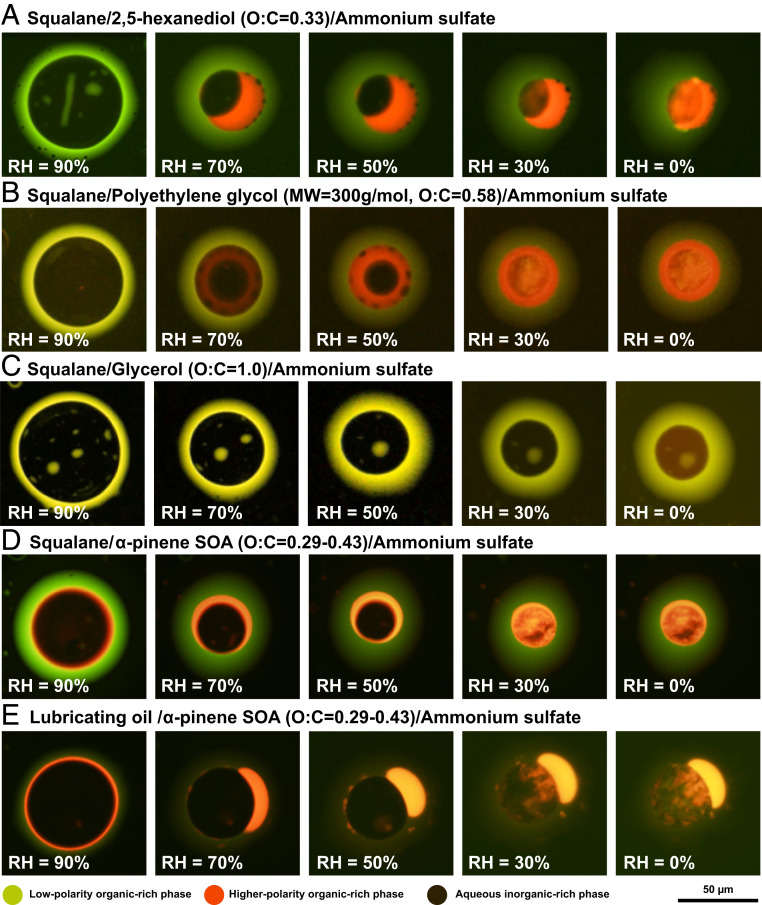
Fluorescence microscopy images of internally mixed particles containing primary organic aerosol (POA), secondary organic aerosol (SOA), and secondary inorganic aerosol (SIA) proxies. Fluorescence was due to trace amounts of Nile red embedded within the particles. The images were recorded for decreasing RH. The individual panels A–E correspond to different POA+SOA+SIA particle types, with the composition of the particles and the elemental O:C ratio of the SOA proxy indicated above each row. The O:C ratio of α-pinene SOA is based on previous studies (46, 47). For these experiments, either squalane or lubricating oil was used as the POA proxy, and ammonium sulfate was used as the SIA proxy. The scale bar applies to all images shown.
In contrast to the cases with O:C less than 0.8, when the O:C of the SOA proxy was greater than or equal to 0.8, three liquid phases were never observed. Shown in Fig. 1C and Movie S3 are images for one of these cases, as the RH was decreased from ∼95 to 0%. For this case, the particles contained two liquid phases for the full RH range investigated. At 90 to 30% RH, the particles contained a low-polarity organic-rich phase and an aqueous inorganic-rich phase. At 0% RH, the particles contained a low-polarity organic-rich phase and a higher-polarity organic-rich phase. As the RH was decreased from 30 to 0%, the inner phase changed gradually from an aqueous inorganic-rich phase to a higher-polarity organic-rich phase, based on the gradual color change (Movie S3), caused by a continuous loss of water from the inner phase.
As illustrated in Fig. 2A, two types of phase transitions were observed in our experiments as the RH was decreased: liquid–liquid phase separation and crystallization of ammonium sulfate. We refer to the RH at which we first observed these phase transitions as the separation relative humidity (SRH) and crystallization relative humidity (CRH), respectively. To make it clear that the liquid–liquid phase separation involved a transition from two liquid phases (2L) to three liquid phases (3L), we use the notation 2L–3L SRH.
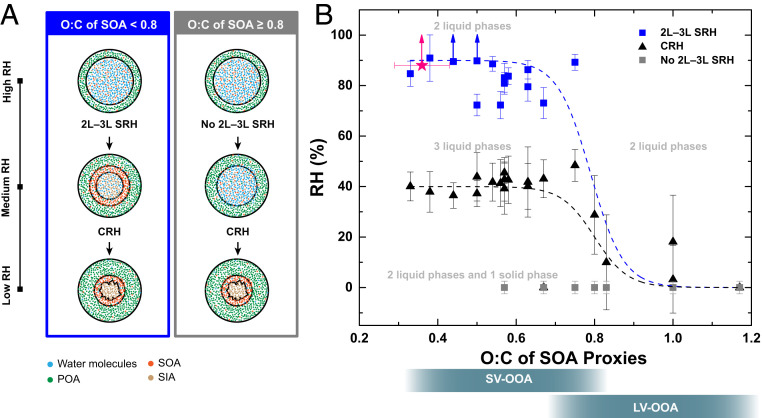
(A) Illustration of the phase behavior of particles containing mixtures of POA, SOA, and SIA at different RH values when the O:C of the POA is less than or equal to 0.02. (B) 2L–3L SRH (blue squares) and CRH (black triangles) of particles containing squalane (POA proxy), a single oxygenated organic compound (SOA proxy; 21 distinct cases studied), and ammonium sulfate (SIA proxy). 2L–3L SRH correspond to the RH at which a two liquids (2L) to three liquids (3L) phase separation event was first observed with decreasing RH. CRH corresponds to the RH at which crystallization of ammonium sulfate was first observed with decreasing RH. The gray squares indicate the cases where 2L–3L SRH was not observed over the full range of RH values studied. The pink symbol represents the 2L–3L SRH of particles containing a mixture of squalane, α-pinene SOA, and ammonium sulfate. The O:C ratio of the α-pinene SOA is estimated based on previous studies (46, 47). The error bars represent two SDs from the mean plus the uncertainty of the RH measurement (2.5%). The gray bars at the bottom indicate the typical O:C range of atmospheric SOA classified as SV-OOA and LV-OOA (49). The blue and black dashed lines denote fits to the 2L–3L and CRH values, which are detailed in SI Appendix, Table S4.
Shown in Fig. 2B and listed in SI Appendix, Table S1 are the 2L–3L SRH and CRH values measured in our experiments as a function of the O:C ratio of the SOA proxy. When the O:C ratio of the SOA proxy was less than 0.8, the average 2L–3L SRH was most often between 100 and 70%. On the other hand, 2L–3L SRH was not observed when the O:C ratio of the SOA proxy was greater than 0.8 (Fig. 2B). The average CRH was most often between 35 and 45% when the O:C ratio of the SOA proxy was less than 0.8. This range overlaps with the CRH reported for aqueous ammonium sulfate particles (24). The good agreement between the CRH in the POA+SOA+SIA particles when the O:C value is less than 0.8 for the SOA proxy and the CRH for aqueous ammonium sulfate is consistent with ammonium sulfate and the SOA proxies residing almost completely in separate phases. When the O:C value was greater than 0.8 for the SOA proxy, the average CRH was always less than 40% or, in some cases, crystallization was completely suppressed. This is consistent with ammonium sulfate being in the same phase as the SOA proxy, with the latter lowering the supersaturation of crystalline ammonium sulfate in the particles (39).
The results shown in Fig. 2B correspond to phase transitions as a result of an imposed decreasing RH. For a limited number of POA+SOA+SIA systems shown in Fig. 2B, we also investigated liquid–liquid phase separation as the RH was increased. For these experiments, the RH was increased starting from around 50% (i.e., above the CRH). In all cases, the SRH values obtained for increasing RH agreed with the results for decreasing RH within experimental uncertainty (SI Appendix, Table S2). Furthermore, the results shown in Fig. 2B were obtained using particles with diameters greater than 10 μm. Based on previous studies, liquid–liquid phase separation (or the RH range of its occurrence) may become restricted when the diameter of the particles is less than ∼40 nm (40). Based on these previous studies, our liquid–liquid phase separation results may apply to particles as small as 40 nm and potentially smaller (i.e., our results are relevant for a large fraction of atmospheric particles). Nevertheless, additional studies are needed to better understand the effect of particle size on the 2L–3L SRH and other phase transitions.
In our experiments, liquid–liquid phase separation resulted in either a core–crescent–shell morphology (Fig. 1A) or core–shell–shell morphology (Fig. 1B), with the majority of the particles that underwent liquid–liquid phase separation (78%) revealing a core–shell–shell morphology. However, no trend was observed between the morphology type and the O:C ratio of the SOA proxy (SI Appendix, Fig. S2 and Table S1). In all cases, the low-polarity organic-rich phase was on the exterior of the particles and the aqueous inorganic-rich phase was in the interior of the particles. This is consistent with the expected thermodynamic driving forces favoring an enhancement of low-polarity, low-surface–tension compounds at the air–particle interface. This is also consistent with the molecular dynamics simulations of Karadima et al. (34), who reported that the oxygenated organic molecule cis-pinonic acid (O:C = 0.3) was mainly located between alkanes (O:C = 0) and aqueous ammonium sulfate domains in their nanoparticles. While the particles in our experiments were suspended on hydrophobic glass substrates, which could influence the resulting morphology, previous results have shown good agreement between the morphology of particles deposited on hydrophobic glass substrates and particles levitated in the gas phase (41). However, different metastable morphologies may form depending on the formation mechanism of the particles (31, 42). As a result, care should be taken when extrapolating morphologies observed here to atmospheric particles. In some cases, small inclusions of the low-polarity organic-rich phase were observed within the inorganic-rich phase (e.g., Fig. 1 A and C). Such structures are likely metastable and have been observed previously in suspended particles containing POA proxies and SOA (42).
The experiments described above, each with a single oxygenated organic compound as a proxy for SOA, provide a framework for predicting when three liquid phases may form in atmospheric aerosol particles containing mixtures of POA, SOA, and SIA. As a next step, we carried out similar experiments to those described above but replaced the oxygenated organic compounds with SOA generated in an environmental chamber by ozonolysis of α-pinene (Materials and Methods). SOA generated in an environmental chamber contains tens to hundreds of oxygenated organic species, similar to atmospheric SOA (43). Furthermore, ozonolysis of α-pinene is a major source of SOA in the atmosphere (44). For particles containing squalane, α-pinene SOA, and ammonium sulfate, three phases coexisted over the full range of RH values studied (Fig. 1D). From 90 to 50% RH, three liquid phases were observed: a low-polarity organic-rich phase, a higher-polarity organic-rich phase, and an aqueous inorganic-rich phase. At 30 to 0% RH, the particles contained two liquid phases and crystalline ammonium sulfate. At low RHs (≲50%), a higher-polarity organic-rich phase consisting of mostly α-pinene SOA can become highly viscous and can even approach the glassy state (45). A highly viscous phase has implications for the time needed to reach equilibrium between POA+SOA+SIA particles and the surrounding gas phase. This aspect will be addressed below, but for convenience, we will continue to refer to the higher-polarity organic-rich phase as a liquid. For the particles containing squalane, α-pinene SOA, and ammonium sulfate, the 2L–3L SRH was greater than 88.0% (SI Appendix, Table S3). Since the O:C value of SOA from the ozonolysis of α-pinene is 0.29 to 0.43 for our experimental conditions (46, 47), this 2L–3L SRH is consistent with the results obtained using 1 out of 21 oxygenated organic compounds individually as a SOA proxy (compare pink star with blue squares in Fig. 2B).
As another step toward real atmospheric POA+SOA+SIA particles, we also investigated the phase behavior of particles containing mixtures of lubricating oil, α-pinene SOA, and ammonium sulfate. Unburnt lubricating oil has an O:C value of ∼0.02 (26) and makes up a large fraction of POA from motor vehicles (48). In these studies, three phases were also observed for the full RH range studied (Fig. 1E). For this particle type, the 2L–3L SRH was greater than 88.7%, consistent with the results obtained when using squalane as a POA proxy (SI Appendix, Table S3).
Field measurements suggest that POA associated with fossil fuel combustion can have average O:C values ranging from ∼0.02 to 0.26 in and downwind of urban areas (49), and hence, POA in the atmosphere can be more oxidized than lubricating oil. This could be due to some POA originating from fossil fuel combustion containing a mixture of lubricating oil and oxidized organic compounds from incomplete combustion of fuels (50). Alternatively, the higher O:C of POA could result from atmospheric oxidation of these lubricating oil particles. To capture the O:C range of atmospheric POA and as another step toward real atmospheric POA+SOA+SIA particles, we also investigated the phase behavior of particles containing α-pinene SOA, ammonium sulfate, and proxies of more oxidized POA. For proxies of more oxidized POA, we used dioctyl phthalate (O:C = 0.166), oleic acid (O:C = 0.11), a mixture of dioctyl phthalate and squalane (average O:C = 0.083), and a mixture of oleic acid and squalane (average O:C = 0.055). In all cases, three liquid phases were observed over a wide RH range (SI Appendix, Fig. S3). The 2L–3L SRH values were greater than 90.2% (SI Appendix, Table S3), consistent with the results obtained when using just squalane or lubricating oil as a POA proxy.
The overall picture that emerges is the likely coexistence of three liquid phases at intermediate RH values in particles containing POA, SOA, and SIA, if the O:C value of the SOA is less than 0.8 and the O:C value of the POA is ∼0.17 or less. As a first order approximation, we suggest using the fit to the data shown in Fig. 2B and tabulated in SI Appendix, Table S4 to predict the 2L–3L SRH, if the O:C of the POA is ∼0.17 or less.
Liquid–liquid phase separation in POA+SOA+SIA particles is expected to be a function of the distribution of polarities and hydrophilicities among the organic compounds as well as the salting-out ability of the inorganic ions interacting with the organics (29, 30, 51, 52). The O:C ratio is a convenient parameter for predicting an organic molecule’s polarity and hydrophilicity; hence, it is a convenient parameter for predicting in an approximate manner the 2L–3L SRH values. Thermodynamic models that take into account molecular structure and intermolecular forces should provide more accurate predictions of liquid–liquid phase separation, including phase compositions, if constrained by appropriate data. An example of such a model is the aerosol inorganic–organic mixtures functional groups activity coefficients (AIOMFAC) thermodynamic model and its phase separation extension (5354–55). An alternative to sophisticated thermodynamic models is the use of the Hansen solubility parameter approach. The Hansen solubility parameter takes into account intermolecular forces in a simplified way and has been used to predict miscibility of POA with SOA, as well as SOA with SIA (29, 30). Although beyond the scope of this study, additional studies that compare measured 2L–3L SRH values and the RH range of phase separation with predictions using Hansen solubility parameters may lead to an improved understanding of the occurrence of three liquid phases in atmospheric particles.
Several previous studies have investigated the phase behavior of particles containing mixtures of SOA and SIA proxies. In these studies, two liquid phases were often observed when the O:C value of the SOA proxy was less than 0.8, while one liquid phase was observed when the O:C value was greater or equal to 0.8, similar to the O:C trend observed here (11, 32). Furthermore, the 2L–3L SRH values measured here are in good agreement with one liquid to two liquids (1L–2L) SRH values reported by You et al. (56) in particles containing ammonium sulfate and the same oxygenated organic molecules as used here but without squalane (Fig. 3). This agreement provides compelling evidence that the POA proxies used in our experiments do not significantly influence the mixing thermodynamics (e.g., chemical potentials) of the SOA and SIA proxies. Several previous studies have also investigated the phase behavior of particles containing proxies of POA and SOA. In these studies, two liquid phases were often observed or inferred when the O:C value of the POA was low (252627282930–31). Our results unify the previous studies that investigated the phase behavior of mixtures of POA and SOA on the one hand and mixtures of SOA and SIA on the other hand.
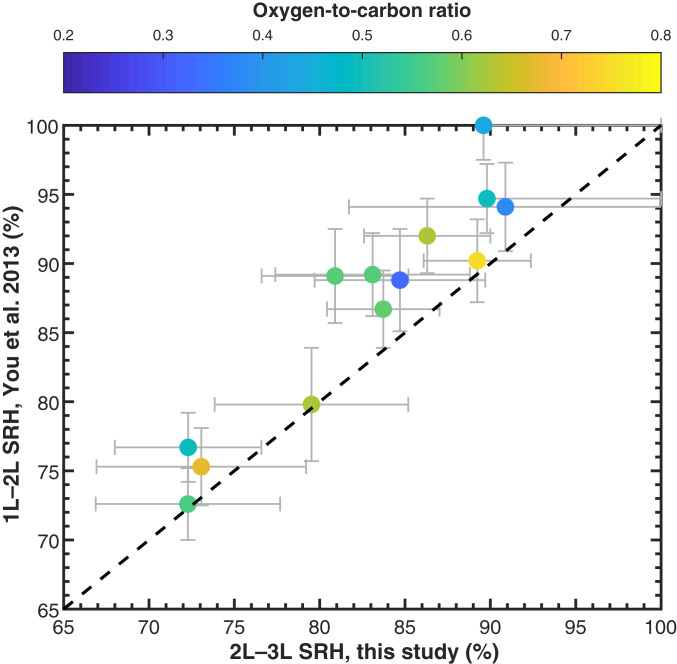
Comparison of the measured 2L–3L SRH values from the current study with the 1L–2L SRH reported by You et al. (56). SRH corresponds to the RH at which liquid–liquid phase separation was first observed when decreasing the RH from ∼95 to 0%. The color of the symbol indicates the elemental O:C ratio of the oxygenated organic material used as a SOA proxy. The error bars represent two SDs from the mean plus the uncertainty of the RH measurement. The data from You et al. (56) correspond to SRH in ternary mixtures of a SOA proxy, ammonium sulfate, and water, while the data from this study correspond to SRH in quaternary mixtures of squalane, a SOA proxy, ammonium sulfate, and water (see SI Appendix, Table S1). The dashed black line corresponds to the 1:1 identity line.
Measurements during field studies have detected two main types of oxygenated organic aerosol in the atmosphere, referred to as semivolatile oxygenated organic aerosol (SV-OOA) and low-volatility oxygenated organic aerosol (LV-OOA, refs. 37, 49). SV-OOA has average O:C values ranging from ∼0.32 to 0.83 and is consistent with freshly formed SOA, while LV-OOA has average O:C values ranging from 0.68 to 1.32 and is consistent with more oxidized SOA resulting from atmospheric aging processes. The average O:C ranges of LV-OOA and SV-OOA are indicated in Fig. 2B for comparison purposes. Based on the O:C values of SV-OOA and LV-OOA and the range for which liquid–liquid phase separation was observed in our experiments (O:C < 0.8), we expect particles consisting of POA, SIA, and newly formed SOA to often contain three liquid phases. On the other hand, particles consisting of POA, SIA, and aged SOA may consist of two or three liquid phases, depending on the average O:C ratio of the aged SOA.
Atmospheric Implications.
The coexistence of three liquid phases in POA+SOA+SIA particles has important implications for the mechanism of SOA formation and growth in the atmosphere. For descriptions of SOA formation in large-scale atmospheric models, it is often assumed that SOA can form by absorptive partitioning of semivolatile organic compounds into existing POA (57). Our results, however, suggest that this SOA–POA mixing mechanism may be less important than often assumed since our experiments show that POA with low to moderate O:C ratios and newly formed SOA can exist in separate phases. This conclusion is consistent with previous studies using just POA and SOA (252627282930–31) and has important implications for policies being considered to reduce SOA concentrations in urban environments (58). These results also suggest that absorptive partitioning might be less important than previously thought for internal mixing of POA and newly formed SOA in the atmosphere. Other mechanisms that can lead to mixing of POA and SOA in the atmosphere include 1) coagulation of POA and SOA particles (15), 2) heterogeneous nucleation of SOA on POA followed by condensational growth of the SOA on the POA (59), 3) condensation of inorganic material on POA followed by incorporation of SOA through absorptive partitioning and aqueous-phase chemistry at high RHs (5, 23), and 4) condensation of low volatility SOA on POA followed by adsorptive partitioning of additional SOA into the low volatility SOA. Related, condensational growth of SOA on existing aerosol has been observed in urban environments (60), and high RHs often occur in the planetary boundary layer, which would facilitate aqueous-phase chemical reactions as outlined above.
The presence of three liquid phases also has implications for the rate of uptake of reactive gases into POA+SOA+SIA particles. As an example, consider the reactive uptake of N2O5. N2O5 reacts efficiently on aqueous inorganic-rich particles, leading to a reduction of the gas phase pollutants NO2 and O3 and an increase in particle phase nitrate in the atmosphere (4, 61). Having both a low-polarity organic-rich phase of extremely low water content and a higher-polarity organic-rich phase on the outside of an aqueous inorganic-rich core could substantially limit the reactive uptake of N2O5 by acting as sequential barriers through which N2O5 must diffuse (62). A reduction of the reactive uptake of N2O5 would lead to an increase in NO2 and O3 but a decrease in particle-phase nitrate (4, 61).
A low-polarity organic-rich phase and a higher-polarity organic-rich phase on the outside of an aqueous inorganic-rich core could also reduce the rate of uptake of organic vapors and water vapor into these particles and, hence, increase the time needed to reach equilibrium between the particles and the surrounding gas phase. To calculate the equilibration timescales between POA+SOA+SIA particles and surrounding organic and water vapors, we used the kinetic multilayer model of gas–particle interactions in aerosols and clouds (KM-GAP) (7, 63) coupled with the AIOMFAC thermodynamic model (53, 54). In the simulations, we used particles of a dry diameter of 200 nm and dry mass percentages of 33.3% POA, 33.3% SOA, and 33.3% SIA. For POA, we used squalene; for SOA, we used 14 representative organic compounds of α-pinene SOA; and for SIA, we used ammonium sulfate. To determine equilibration timescales, first, an AIOMFAC-based equilibrium model (6) was used to predict the bulk equilibrium composition of the gas phase and the particle phases as a function of RH, including component activities and liquid phase viscosities. Next, in the kinetic multilayer model simulations, at selected RH levels, the individual gas phase concentrations of organic vapors and water vapor were enhanced by 40 and 1%, respectively, and the times required for the particles to change in diameter within 2% or 1/e of the new equilibrium diameter (normalized by the maximum diameter change), defined as the 2% or 1/e equilibration timescales, τ2% and τ1/e, respectively, were calculated with KM-GAP coupled to AIOMFAC (see details in SI Appendix, section S2). Our simulations confirm that 200 nm dry diameter particles with three separate phases have relatively long characteristic equilibration timescales. The τ2% values ranged from 98 s to 4,594 s for RH values ranging from 90 to 10%, while the τ1/e values ranged from 9 s to 670 s for the same RH range (Fig. 4). The τ1/e values capture the relatively fast diameter adjustments due to the gas–particle partitioning of water, which is especially substantial at higher RH levels (>85% RH), while the τ2% values better capture the combined effects of water equilibration due to the initial RH perturbation as well as the slower equilibration of the organic vapors accompanied by adjustments in water partitioning (SI Appendix, Fig. S10). At high RH values, the low-polarity organic-rich phase kinetically limits uptake of the vapors, while at low RH values, the higher-polarity organic-rich phase kinetically limits uptake of the vapors (SI Appendix, section S2 and Fig. S11). In contrast to the results with three liquid phases, simulations with POA+SOA+SIA particles assuming a single, homogeneously mixed phase and ideal mixing, though less realistic, resulted in shorter equilibration timescales, with τ2% values ranging from 42 to 61 s and τ1/e values ranging from 5 to 9 s for the same RH range (Fig. 4). Long equilibration timescales between the particles and surrounding gas phase (both water vapor and organic vapors) have implications for interpreting measurements of hygroscopic growth of atmospheric aerosols since these measurements often assume equilibration timescales of less than 10 s (64, 65).
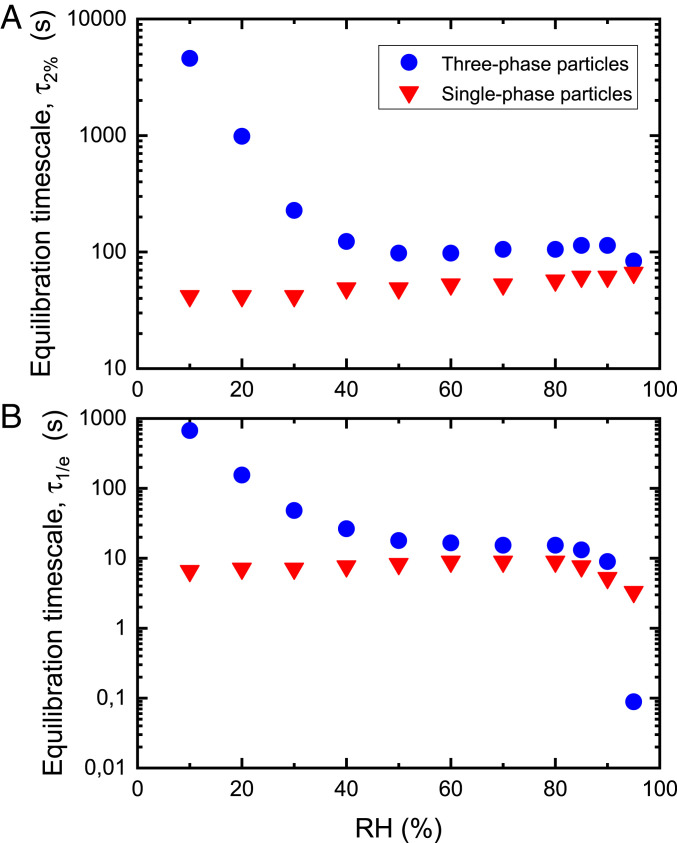
Characteristic equilibration timescales for POA+SOA+SIA particles in terms of (A) 2% equilibration timescale (τ2%) and (B) 1/e equilibration timescale (τ1/e). The τ2% and τ1/e timescales correspond to the time required for the particles to change in diameter within 2% and 1/e of the new equilibrium diameter (normalized by the maximum diameter change) after an initial perturbation of the gas phase concentrations. To calculate these characteristic equilibration timescales, the surrounding organic vapors and water vapor were initially enhanced by 40 and 1%, respectively. See text for details. A dry diameter of 200 nm and dry mass fractions of 33.3% POA, 33.3% SOA, and 33.3% SIA were used in these simulations. The blue circles indicate the timescale for the three-phase particles, accounting for nonideal mixing and assuming a core–shell–shell morphology with POA in the outer shell and SOA predominantly in the middle shell. The red triangles indicate the timescale for forced single-phase particles, assuming ideal mixing among all constituents.
The presence of multiple phases in POA+SOA+SIA particles can also influence the ability of such particles to activate into liquid cloud droplets (12). To quantify this effect, we calculated the equilibrium wet diameter, surface composition, and surface tension of a 50 nm dry diameter particle containing 33.3% POA, 33.3% SOA, and 33.3% SIA as it grows with increasing RH and is activated into a liquid cloud droplet (Fig. 5). The calculations are based on Köhler theory and the output from the AIOMFAC model (SI Appendix, Fig. S6 and section S3). The calculations show that the minimum environmental water vapor supersaturation required to activate such POA+SOA+SIA particles into a cloud droplet is about 0.42% (the maximum of the solid green curve in Fig. 5A). Prior to and at the point of cloud droplet activation, the particles are predicted to be completely or partially covered with a low-polarity organic-rich phase (Fig. 5 C and D), which results in a reduction and size-dependent evolution of the surface tension of the particles compared to the surface tension of pure water (Fig. 5B). This reduction in surface tension prior to and at activation causes a decrease in the supersaturation needed to activate the particles into cloud droplets compared to a particle with the same composition but assuming no surface tension reduction (Fig. 5A). A decrease in the supersaturation needed to activate particles in the ultrafine size range (less than 100 nm diameter) leads to a higher potential for more particles to become activated into cloud droplets under typical conditions at cloud base and, hence, a possible indirect aerosol composition and morphology effect on climate. Ignoring this effect will lead to underpredictions of the cloud condensation nucleation ability of POA+SOA+SIA particles.
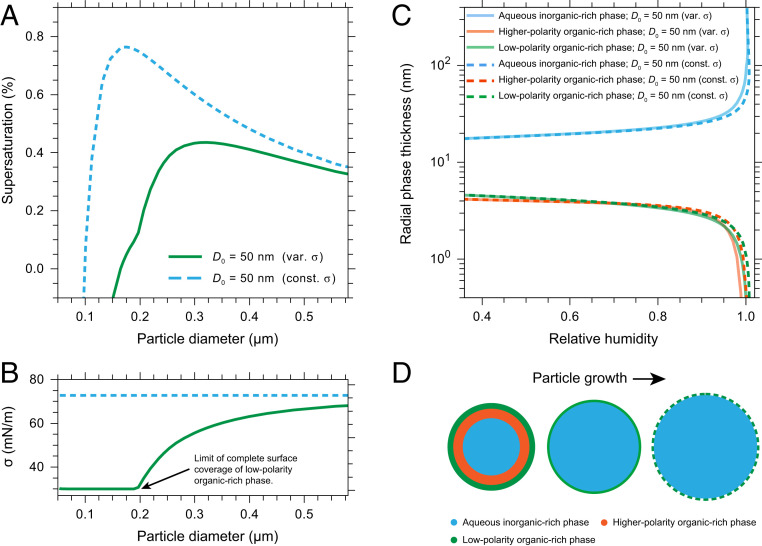
Thermodynamic equilibrium predictions for POA+SOA+SIA particles with a 50 nm dry diameter during growth and activation into cloud droplets. (A) Supersaturation with respect to water as a function of the wet diameter of the particle. (B) Surface tension, σ, as a function of the wet diameter of the particle. In A and B, the green curve represents the case with the low-polarity organic-rich phase on the exterior of the particle, causing a reduction in the surface tension of the particle. For full surface coverage of the organic-rich phases, a minimum layer thickness of 0.3 nm was assumed. The kink in the green curve at ∼0.2 µm diameter indicates the limit of full surface coverage by the low-polarity organic-rich phase, with only partial coverage for larger diameters; at this point the higher-polarity organic-rich phase has completely dissolved into the aqueous inorganic-rich phase. In A and B the dashed blue curve represents the comparison case with assumed constant surface tension, σ, of 72 mN ⋅ m−1, corresponding to the surface tension of water. (C) Predicted radial phase thicknesses (see panel D) for the three phases when assuming a core–shell–shell morphology as function of RH. (D) Sketch of anticipated particle morphology changes prior to and beyond the size at the cloud droplet activation point (not to scale). The images in the middle and to the right illustrate the states for RH >99% and into the supersaturated regime. For RH >99%, the higher-polarity organic-rich phase has completely dissolved into the aqueous inorganic-rich phase and only two phases remain.
For cloud droplet activation of a 50 nm dry diameter particle containing 33.3% POA, 33.3% SOA, and 33.3% SIA, a thermodynamic prediction with the particles limited to two liquid phases will result in a very similar behavior at high RH as the three-phase system discussed above and shown in Fig. 5 (SI Appendix, Figs. S8 and S9). This similarity in predicted cloud activation behavior is because in the three-phase system the higher-polarity organic-rich phase completely dissolved in the inorganic-rich phase at RH >99%. That is, while consisting of three liquid phases at lower RH, the particles consisted of only two liquid phases in the high RH range most relevant for cloud droplet activation. However, if the composition of the particles deviates from 33.3% POA, 33.3% SOA, and 33.3% SIA, a (forced) two-phase system may not always result in the same cloud droplet activation behavior as a three-phase system. For example, if the particles contain a significant amount of semivolatile SOA with intermediate polarity, a (forced) two-phase system would likely have a different equilibrium composition compared to a three-phase system (with the same dry composition) prior to and at cloud droplet activation, and hence have a different critical supersaturation for activation. Related, the existence of multiple phases at water vapor supersaturation conditions can contribute to differences between measured apparent hygroscopicities at cloud droplet activation under water-supersaturated conditions compared to water-subsaturated conditions (10, 13, 66). Such discrepancies have been observed previously in both laboratory and field studies (64, 67, 68).
Based on our experimental findings, in order for three liquid phases to form, the O:C value of the SOA must be less than 0.8, and the O:C value of the POA must be ∼0.17 or less. Although mechanisms exist for producing POA+SOA+SIA particles with these properties in and downwind of urban environments, the frequency of occurrence of atmospheric POA+SOA+SIA particles with the O:C of the SOA less than 0.8 and O:C of the POA less than 0.17 has not been sufficiently established to date and should be addressed by future studies. Further studies are also needed to better constrain how large an effect three liquid phases can have on air quality and climate. Additional studies are also needed to extend our results to POA with higher O:C values than studied here, such as POA from cooking and biomass burning sources.
Materials and Methods
Generation of Particles Containing a Mixture of Squalane (POA Proxy), 1 out of 21 Different Oxygenated Organic Compounds (SOA Proxy), Ammonium Sulfate (SIA Proxy), and Trace Amounts of Nile Red.
Two solutions were first generated gravimetrically: 1) a solution of squalane (2 wt %) and Nile red (9-diethylamino-5H-benzo[α]phenoxazine-5-one, 10 mg ⋅ L−1) dissolved in hexane and 2) a solution containing 1 out of 21 different oxygenated organic compounds (1 wt %) and ammonium sulfate (1 wt %) dissolved in purified water (Millipore, resistivity ≥ 18.2 MΩ cm). Next, the solutions were nebulized (Meinhard, TR-30-C0.5) consecutively onto a siliconized hydrophobic glass slide (12 mm diameter, Hampton Research, HR3-277). After nebulization, the solvents (hexane and water) evaporated, leaving behind particles with diameters between 50 and 70 μm, containing a mixture of squalane, the specific SOA proxy compound, ammonium sulfate, and trace amounts of Nile red.
Generation of Particles Containing Mixtures of POA, Secondary Organic Aerosol Generated in the Laboratory, Ammonium Sulfate, and Trace Amounts of Nile Red.
Ozonolysis of α-pinene was carried out to produce SOA particles at mass loadings between 60 and 70 μg ⋅ m−3 in an environmental chamber (SI Appendix, section S1). SOA particles were continuously collected from the environmental chamber onto hydrophobic glass slides for ∼24 h by inertial impaction using a multiorifice single-stage impactor (MSP Corporation) operated at a constant flow rate of 15 L ⋅ min−1 and a cut-size below 0.18 µm (aerodynamic particle diameter). A solution of 2 wt % of 5W30 lubricating oil (Pennzoil) and Nile red dissolved in hexane was also generated. After collecting the SOA, solutions of ammonium sulfate and squalane or lubricating oil were nebulized consecutively onto the same glass slides, similar to the method discussed above.
Fluorescence Microscopy.
The phase behavior of the particles was investigated using an inverted fluorescence microscope (Olympus, Model IX70), equipped with a mercury arc lamp (USH-103D, Ushio) as the light source and coupled to an RH-controlled flow cell. Images were captured with a color charge-coupled device camera (Olympus, Model DP80) using a fluorescence filter cube (Olympus, Model U-MNIB), resulting in excitation at 470 ≤ λ ≤ 490 nm and emission at λ > 515 nm, where λ is the wavelength of the photons. All experiments were carried out at 297 to 300 K, as determined with a T-type thermocouple (OMEGA, Model FF-T-20-100) attached to the flow cell. The RH was controlled by continuously passing a mixture of humid and dry nitrogen gas through the flow cell (total flow of 1.2 L ⋅ min−1). The dew point of the gas stream was measured downstream of the flow cell using a dew point hygrometer (General Eastern, Model M4/E4). The RH of the gas was calculated from the dew point and the temperature of the flow cell. Calibration of the RH was achieved by measuring the deliquescence RH of pure ammonium sulfate particles and comparing to values reported in the literature [80.0 ± 1.4% at 295 K (24)]. At the beginning of each experiment, the particles were equilibrated at ∼95% RH for ∼10 min. Next, the RH was decreased at a ramp rate of ∼0.5% RH ⋅ min−1 until the ammonium sulfate effloresced or an RH of 0% was reached. During the experiments, images were captured at a rate of 1 frame per second. The focus of the fluorescence microscope was adjusted manually so that the focal plane corresponded to the center of the particles.
Thermodynamic and Kinetic Modeling.
Predictions of the equilibrium chemical compositions of the gas and particle phases were achieved by using a coupled gas–particle and liquid–liquid equilibrium model based on the AIOMFAC model (53, 54). The KM-GAP (63) was used to simulate mass transport of semivolatile species between the gas phase and the particle phases and to estimate characteristic equilibration timescales. For details see SI Appendix, sections S2 and S3.
Acknowledgements
We acknowledge access and support from the Biological Services Laboratory at The University of British Columbia (UBC). James Boone (Olympus) is thanked for technical support. Elli Newman and Lola Bryson are thanked for help with experiments in the framework of UBC’s Work Learn International Undergraduate Research program, Grant Agreement 10045 (E.N.) and laboratory volunteer program (L.B.), respectively. Lauren Koch is thanked for proofreading of the manuscript. A.K.B. and A.Z. acknowledge support by the Natural Sciences and Engineering Research Council of Canada through Grants RGPIN/04441-2016 and RGPIN/04315-2014, respectively. M.S. and A.Z. further acknowledge funding from the Alfred P. Sloan Foundation (G-2019-12306). F.M. acknowledges support from the Swiss National Science Foundation through the Early Postdoc.Mobility Grant Agreement P2EZP2_191837. M.S. acknowledges funding from the US NSF (AGS-1654104).
Data Availability
All study data are included in the article and/or supporting information.
References
1
2
3
4
5
6
7
8
9
10
12
13
15
16
17
18
19
20
21
22
23
24
25
26
27
28
29
30
31
32
33
34
35
36
37
38
39
40
41
42
43
44
45
46
47
48
49
50
51
52
53
54
55
56
57
58
59
60
61
62
63
64
65
66
67
68