 Metastable–solid phase diagrams derived from polymorphic solidification kinetics
Proceedings of the National Academy of Sciences of the United States of America


Edited by Pablo G. Debenedetti, Princeton University, Princeton, NJ, and approved January 16, 2021 (received for review August 24, 2020)
Author contributions: B.S., L.Z.-R., and J.L.B. designed research; B.S. and L.Z.-R. performed research; B.S. and L.Z.-R. analyzed data; and B.S. and J.L.B. wrote the paper.

- Altmetric
- Thermodynamic Phase Diagram
- Phase Map of Ultrarapid Solidification
- SCL Basins and Thermodynamics of Multiphase Metastable Equilibria
- Metastable–Solid Phase Diagrams
- Extraneous-Phase Interface Layers: Interfacial Phase Transformations Coupled to Growth-Mode Transitions
- Discussion
- Materials and Methods
- Supplementary Material
- Data Availability
Kinetic stabilization of metastable phases in rapidly cooled metals and alloys has been established in experiments for decades. However, atomistic theories that can quantitatively predict the solidification conditions that produce nonequilibrium phases are still in their infancy. Recent advances in pulsed power/laser technologies, as well as in situ characterization, have brought to bear unprecedented understanding of matter at extreme temperatures and pressures. However, accurate predictions of kinetic stabilization of metastable phases that are necessary for physical interpretation of these experiments are lacking. This work provides a blueprint for development of kinetic phase maps of materials undergoing rapid solidification from first principles. Through atomistic simulations, the phases dominating nucleation are identified, and their kinetic stabilities during the growth stage are characterized.
Nonequilibrium processes during solidification can lead to kinetic stabilization of metastable crystal phases. A general framework for predicting the solidification conditions that lead to metastable-phase growth is developed and applied to a model face-centered cubic (fcc) metal that undergoes phase transitions to the body-centered cubic (bcc) as well as the hexagonal close-packed phases at high temperatures and pressures. Large-scale molecular dynamics simulations of ultrarapid freezing show that bcc nucleates and grows well outside of the region of its thermodynamic stability. An extensive study of crystal–liquid equilibria confirms that at any given pressure, there is a multitude of metastable solid phases that can coexist with the liquid phase. We define for every crystal phase, a solid cluster in liquid (SCL) basin, which contains all solid clusters of that phase coexisting with the liquid. A rigorous methodology is developed that allows for practical calculations of nucleation rates into arbitrary SCL basins from the undercooled melt. It is demonstrated that at large undercoolings, phase selections made during the nucleation stage can be undone by kinetic instabilities amid the growth stage. On these bases, a solidification–kinetic phase diagram is drawn for the model fcc system that delimits the conditions for macroscopic grains of metastable bcc phase to grow from the melt. We conclude with a study of unconventional interfacial kinetics at special interfaces, which can bring about heterogeneous multiphase crystal growth. A first-order interfacial phase transformation accompanied by a growth-mode transition is examined.
The idea of polymorphism of solid nuclei during crystallization dates back to Ostwald (1). It results from a lack of explicit correlation between the bulk free energies of different crystal phases and their respective interfacial free energies with the liquid. It is thus expected that the early stages of nucleation are likely to be dominated by the crystal phase with the smallest solid–melt interfacial free energy and the later stages by the equilibrium bulk phase (2). It has been recognized that classical nucleation theory (CNT) and density-functional theory (3), as well as phase-field models (4), need to be generalized to account for structural phase transformations of the growing nuclei as the ratio of the interface to the bulk regions changes. This so-called two-step nucleation has been observed experimentally in rapidly quenched metals (5), as well as block copolymer solutions (6, 7) and charged colloidal particles (8, 9), where metastable body-centered cubic (bcc) phase clusters are reported to occur before final crystallization into the face-centered cubic (fcc) phase takes place. A more dramatic outcome at large undercooling is that of nucleation of metastable solid phases that can under suitable circumstances, grow to macroscopic sizes. A large body of literature has grown over the past several decades in which rapid solidification of mainly metals and alloys, at cooling rates on the order of K, has been studied in containerless experiments through electromagnetic/electrostatic levitation techniques (10111213–14), where strong undercooling is achieved by avoiding heterogenous nucleation. Through X-ray diffraction of the freely suspended droplets, the dynamics of crystal nucleation during solidification have been investigated. As a result, solidification of diverse crystalline phases such as fcc, bcc, icosahedral, and quasicrystalline has been observed, and emergence of metastable phases, often in the bcc structure, in sufficiently undercooled liquids has been demonstrated. Through application of CNT, the undercooling necessary for metastable-phase growth has been rationalized. It is conjectured that phase selection takes place in the nucleation stage; the phase emerging is one with the smallest critical nucleation barrier. Consequently, models for solid–liquid interfacial free energies of different crystal phases have been derived from these experiments. Nevertheless, controversies remain when nucleation of metastable phases cannot be explained based on their interfacial free energies. Instead, the likely culprit is suspected to be preferential nucleation at the droplet surfaces (13).
Recent powerful advances in dynamic shock/ramp compression techniques (1516171819202122–23) have been able to achieve melting and solidification at rates that can exceed rapid cooling techniques described above. Hence, extreme undercoolings can be achieved in these experiments, and therefore, the limits of the current theories of phase transformation kinetics can be tested. These laboratory experiments are currently at the forefront of unraveling fundamental insights into the kinetics of solidification at extreme conditions. Freezing under such conditions is believed to play a major role in determining the structure of the planetary cores, which in turn, is responsible for many important properties (e.g., whether a planet can support a magnetic dynamo). It is thus essential to develop capabilities for predicting metastable-phase formation under these nonequilibrium conditions.
From a theoretical standpoint, the preference for nucleation of the bcc and the icosahedral phases from the undercooled liquid was first predicted decades ago through Landau expansion in density fluctuations near the liquid phase (24). The observation of two-step nucleation in molecular dynamics (MD) simulations was initially inconclusive (252627–28). The majority of attempts failed to demonstrate any convincing signature of intermediate phases during nucleation. The breakthrough came through the work of ten Wolde et al. (29, 30), where they performed umbrella sampling (31) simulations using the bond-orientational order parameter (32, 33) to induce crystallization at moderate undercoolings. They thus observed nucleation of predominantly bcc crystallites that would transform to fcc in their cores while the interface regions remained bcc. This finding was later reproduced by classical density-functional theory (34). Subsequently, it was observed that when varying both pressure and undercooling, one could make the bcc precritical crystallites grow to large sizes (35, 36).
In the following, we derive from atomistic first principles the kinetic maps of the crystal phases that are stabilized by nonequilibrium processes during solidification. For this purpose, we generalize the CNT and challenge the assumption that the precritical nucleation stage is solely responsible for crystal phase selection during freezing. Hence, rather than studying the intricacies of multistage nucleation and its effects on the rate of solidification (373839–40), we focus on the product phases that result from liquid–solid transformation kinetics and derive kinetic phase boundaries. The latter specifies the undercooling conditions, in the neighborhood of which multiple crystal phases are likely to grow from the melt. Near these boundaries, the postcritical stage can play a big role in promoting or impeding the growth of competing crystal phases. Hence, in contrast to thermodynamic phase boundaries that are straightforward consequences of thermodynamic rules that can never be violated given enough time, kinetic phase maps are mere guidelines for high-probability events and depend on the particular experimental context being considered. Nevertheless, metastable-phase maps are crucial for understanding solidification near the triple points of the thermodynamic phase diagram, where the liquid phase coexists with two solid phases.
CNT describes solidification in the language of canonical transition-state theory. It uses as the reaction coordinate the size of the solid cluster that nucleates inside the melt. It relies on separation of timescales involving two distinct processes: activation of critical nuclei and growth of postcritical solid clusters. The critical nucleus is the transition state that separates the liquid and the solid basins of attraction. The rate of solid-phase nucleation is dictated by the flux of trajectories through the critical nucleus. It is assumed that the solid-phase nuclei grow slowly enough that they can be considered near equilibrium at all times. A consequence of this is that the sizes of the critical nuclei can be put in one to one correspondence with the undercooling temperature. Furthermore, solid clusters can be stabilized within the melt by constraining volume and energy fluctuations through change of statistical ensemble, from open (e.g., isothermal–isobaric) to closed (e.g., microcanonical). This has been successfully utilized in computer simulations and has allowed the study of equilibrium shapes and sizes of solid clusters in liquid, as well as their coexistence temperatures (41). Through the Gibbs–Thomson (GT) condition, this information has been used to extract solid–liquid interfacial free energies under the assumption of negligible anisotropy (4142–43). Later in this paper, we will formulate a rigorous foundation for this approach and as a result, present a general algorithm for conveniently calculating accurate interfacial free energies that incorporate interfacial anisotropy as well as finite cluster-size curvature effects.
Let us now examine the phase space of the undercooled liquid by carving it into distinct subspaces, each containing all of the configurations of solid clusters of a particular phase , coexisting with the liquid phase. We refer to each such region as the -SCL (solid cluster in liquid) basin. The relative rates of nucleation of solids belonging to two different basins and are proportional to , where is the Gibbs free energy difference between the critical nuclei of the two phases at the undercooling temperature . has contributions from free energies of both the bulk solids as well as the solid–liquid interfaces. Hence, it is easy to see that at large-enough undercooling, when the critical nuclei are relatively small, the interfacial free energy may favor nucleation of the phase that is not the thermodynamically stable bulk phase. However, during the growth stage, the thermodynamic driving force for transformation to the thermodynamic equilibrium phase increases. It is thus imperative to identify under what conditions the thus nucleated metastable-phase clusters can grow to form micrometer-sized grains without transforming to the thermodynamically stable phase. For this purpose, we define the metastable solid cluster in liquid (MSCL) subspace, which is the collection of microstates that are weakly connected to other SCL basins. More precisely, nuclei that belong to the MSCL subspace do not undergo solid–solid transformations during their growth stage, which for a micrometer-sized grain and a typical interface velocity of 10 m/s, is on the submicrosecond timescale.
It is important to note that while the definition of the SCL basin as a collection of microstates is quite straightforward, the same is not true for the MSCL subspace. Metastability is the statistical property of the dynamic trajectories associated with the microstates. This problem can be tackled by noting that large metastable-phase solid clusters transform to equilibrium through activated nucleation processes in their interiors similar to the mechanism in the bulk. Hence, while the thermodynamic driving force as well as the number of nucleation sites for solid–solid transformation increases with the size of the growing clusters, the rate of nucleation of the equilibrium solid phase may in fact decrease due to rising activation barrier. The latter comes about because of increasing misfit strain energy of equilibrium-phase inclusions inside growing metastable-phase clusters. The existence and extent of the region of long-lived metastable-phase solid clusters in liquid that constitute the core of the MSCL subspace can be determined effectively through the closed ensemble technique mentioned above, by which critical nuclei of different sizes are stabilized.
With its core region identified, the boundary of an MSCL subspace can be delineated through direct canonical MD simulations of small solid–cluster seeds. This procedure relies on subdivision of each SCL basin into a contiguous MSCL domain and a transient region that connects it to other basins. Trajectories that are initiated by nucleation of critical solid clusters inside the MSCL subspace overwhelmingly grow to large sizes without structural transformation. Those initiated in the transient regions have a finite chance of crossing over into other SCL basins. This is analogous to transition path sampling, where trajectories initiated near the saddle points of the potential energy landscape are equally likely to decay into one or the other of the basins of attraction connected to it. We find that phase transformations of the critical nuclei initiated in the transient regions proceed through far from equilibrium processes involving cross-nucleation of the new phase at the crystal–liquid interfaces. It is important to note that the identification of the transient region boundaries does not rely upon CNT (or any of its assumptions therein) and thus, provides a general procedure for the construction of kinetic phase maps.
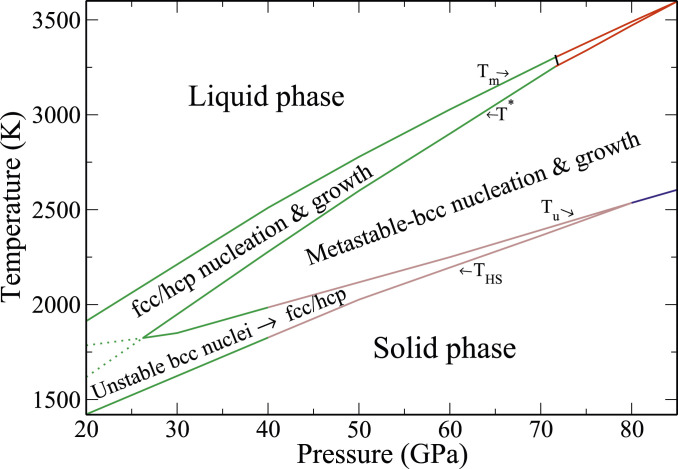
As a consequence of the above topology of the phase space of the undercooled liquid, as well as the one to one correspondence between the sizes of the critical nuclei and undercooling temperature, we can construct solidification–kinetic phase maps of the principal solid phases that grow out of the melt under different temperature and pressure conditions. In what follows, we outline a practical framework based on a combination of nonequilibrium MD simulations (44), free energy integrations, and multiphase equilibrium simulations, through which thermodynamic as well as kinetic phase diagrams can be constructed. This methodology is applied to a model Cu system described by a short-range semiempirical interatomic potential (45). It exhibits a rather complex phase diagram, shown in Fig. 1, with several solid phases present along the melt line. In the following, we develop the methodology to construct the kinetic phase map shown in Fig. 5, where the conditions under which freezing is dominated by the metastable–bcc phase are delineated. It is quite noteworthy how large the region of metastable-phase growth can be. We conclude this paper with an in-depth study of hexagonal close-packed (hcp) clusters in coexistence with the melt, demonstrating their unusual interface structures and phase transformations accompanied by growth-mode transitions. On this basis, a mechanism for interface-driven metastable-phase growth is presented.

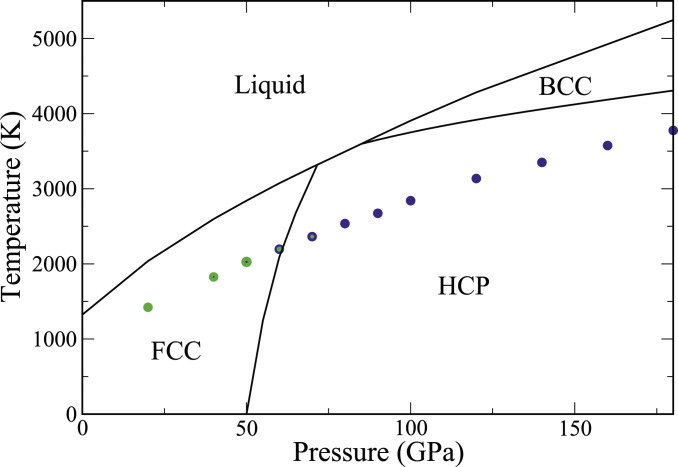
Thermodynamic and ultrafast kinetic phase diagram. The black lines delineate the solid–liquid and solid–solid (bcc–hcp and fcc–hcp, respectively) coexistence curves. The colored filled circles show the temperature at which nucleation of solid from the melt was observed in direct MD simulations. The color indicates the dominant solid phase, with blue equal to bcc and green equal to close packed (fcc and/or hcp). In the pressure range 40 to 70 GPa, both phases are observed. The relative green to blue content of each symbol qualitatively depicts the prevalence of the bcc to the close-packed phases.
Thermodynamic Phase Diagram
Fig. 1 shows the temperature–pressure phase diagram of the embedded atom method (EAM) model–Cu system. The melt line has been obtained from two-phase (solid–liquid) coexistence simulations in the isobaric–isoenthalpic (NPH) ensemble (464748–49). Details are described in SI Appendix. It is found that the equilibrium solid phase at is fcc for pressures GPa, hcp in the interval GPa, and bcc for GPa. The phase diagram contains two triple points: one at 71.6 GPa and 3,320 K, where fcc, hcp, and liquid coexist, and one at 85 GPa and 3,598 K, where hcp, bcc, and liquid coexist. A third three-phase coexistence point exists at 79.5 GPa and 3,478 K, but it does not appear in the phase diagram shown in Fig. 1 because it falls inside the stability range of the hcp phase. At this pressure, the hcp phase melts at the slightly higher temperature of 3,487 K.
The solid–solid coexistence lines shown in Fig. 1 are drawn via integration of their slopes, given by the Clausius–Clapeyron relation, starting from the respective triple points. A detailed discussion of these calculations, as well as the latent heats and volumes of melting, is in SI Appendix.
Phase Map of Ultrarapid Solidification
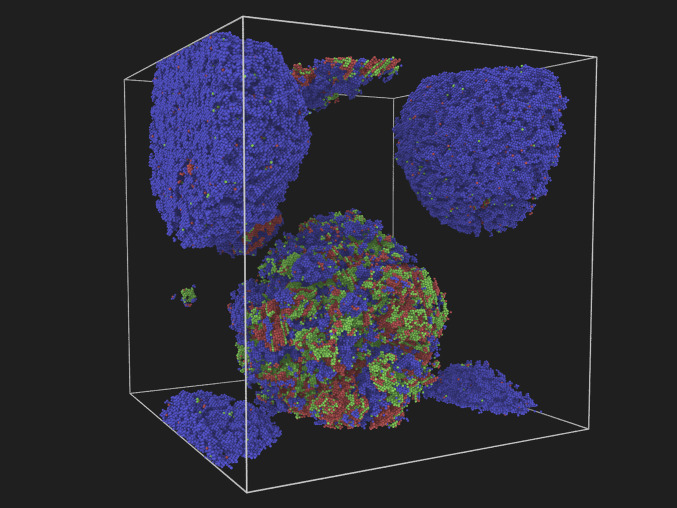
In contrast to the thermodynamic melt line, which delineates the boundary between the liquid and solid phases in the limit of infinitely slow change of thermodynamic variables, we explore in this section the maximal effect of kinetics, by determining the start temperature for freezing with vanishing nucleation barrier. We have measured through nonequilibrium molecular-dynamics (NEMD) simulations of ultrarapid cooling at a rate of 100 K/ns (Fig. 1). We have tracked the solid-phase evolution during these NEMD simulations using the adaptive cutoff common neighbor analysis (a-CNA) (5051–52) method, which allows for identification of the hcp, as well as the fcc and the bcc phases. Fig. 1 depicts by color the solid phases observed at each pressure, with blue depicting the bcc phase and green depicting the close-packed fcc/hcp phases. At 80 GPa and above, pure bcc nucleation is observed, and the bcc nuclei grow and dominate the simulation box. Similarly, at pressures below 40 GPa, pure fcc nucleation is observed, and the close-packed nuclei grow and dominate the simulation box. In the pressure region between 40 and 70 GPa, polymorphic solidification takes place in the simulations. The difference in the observed polymorphic evolution kinetics as pressure is increased from 40 to 70 GPa is quite noteworthy. At 40 GPa, small bcc as well as close-packed (fcc/hcp) nuclei are formed, but the bcc nuclei quickly transform to close-packed phases and vanish. At 60 GPa, pure bcc nuclei do form and grow. However, transformation to close-packed phases during growth is also observed (Fig. 2). In this scenario, at first, small bcc nuclei form. During their growth stage, at or near the bcc solid–liquid interface, transformation to close-packed phases occurs, which starts competing with the original bcc phase as the nucleus grows.
It should be noted that at all pressures is clearly outside the region of thermodynamic stability of the bcc phase. Nevertheless, at pressures 80 GPa and above, not only nucleation occurs in the bcc phase, but the bcc nuclei grow to fill the simulation box. Hence, the solidification process kinetically stabilizes the metastable bcc phase. At pressures below 80 GPa, mixed close-packed and bcc nucleation as well as bcc to close-packed transformation of the growing nuclei can be observed. Hence, the NEMD simulations provide proof for polymorphic solidification kinetics near the triple point of the phase diagram. In the following, we analyze the physical origin of this phenomenon and discuss the conditions for growth of macroscopic-sized metastable bcc crystals, observable in laboratory experiments.
SCL Basins and Thermodynamics of Multiphase Metastable Equilibria
In this section, we discuss the prevalence of solid–liquid metastable equilibria. Multiphase simulations in the NPH ensemble constitute an effective tool for exploring the cores of the MSCL subspaces. Fig. 3 show examples of compact solid-phase nuclei that coexist with the liquid in the pressure range 20 to 100 GPa. They range from single-phase bcc, fcc, or hcp clusters to multiphase mixed fcc/hcp nuclei. These basins are distinct and weakly coupled to each other. It should be noted that the bulk bcc phase becomes thermodynamically stable above 85 GPa. Nevertheless, bcc clusters containing at least several thousand particles can be found stable in MD simulations with durations in the range of 5 to 10 ns, down to 20 GPa. This indicates that phase transformation of these clusters is clearly an activated process with a substantial barrier, which only increases with cluster size since nucleation of a new solid phase involves misfit strain that is easier to accommodate in smaller clusters interfacing the isotropic liquid. Hence, these solid–liquid equilibria constitute the core regions of their respective MSCL subspaces. It should however be noted that most shallow SCL basins may lack metastable subspaces. As is laid out in some detail in SI Appendix, we have not been able to stabilize mixed bcc/close-packed clusters in coexistence with the melt.
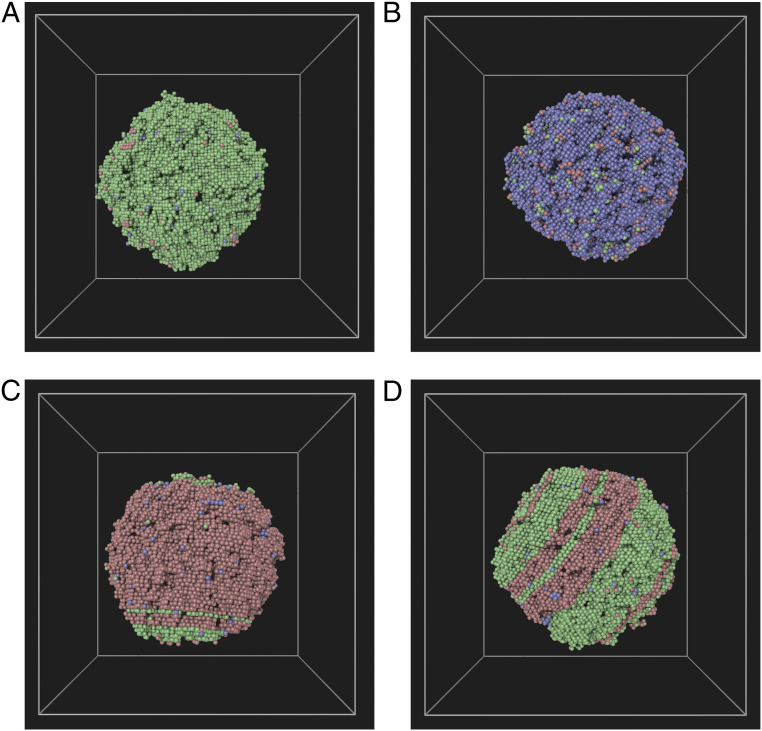
A–D show four different crystal-phase clusters that can coexist in metastable equilibria with the liquid phase. Color coding is based on phase designation of each particle through the a-CNA method: fcc (green), bcc (blue), and hcp (red).
The study of metastable-phase cluster–liquid equilibria (Fig. 3) reveals many surprising structural features. For instance, in contrast to previous works in Lennard–Jones systems (29, 30, 36), where the fcc clusters were found to interface the liquid through a bcc shell, negligible structural heterogeneities are found at the solid–liquid interfaces for either fcc or bcc clusters in this study. However, when examining the hcp clusters (Fig. 3C), we find that the hcp-(0001) facets interface the liquid through a shell of fcc-(111) layers. This amounts to a shift in the stacking of the close-packed layers of hcp clusters, in favor of the fcc symmetry, in the vicinity of the melt. It is shown in SI Appendix that the energy cost associated with the change in stacking of the solid layers is an order of magnitude smaller than the fcc–liquid interfacial free energy. Later in this paper, we discuss a kinetic mechanism that drives the growth of metastable–fcc phase at (0001)-hcp–liquid interfaces at all temperatures below the fcc melting point. This behavior is quite at odds with the other hcp–liquid interface orientations. It lends credence to the unusual hcp–liquid interface structure, seen in Fig. 3C, as well as the existence of distinct MSCL basins of multiphase solid clusters composed of mixed fcc/hcp stackings (see Fig. 3D).
We conclude this section by pointing out that the existence of a multitude of MSCL basins demands that we quantify their relative thermodynamic stabilities or in other words, their phase space volumes. In the next section, we derive a rigorous and surprisingly general and convenient framework for extracting free energies of solid–liquid metastable equilibria from macroscopic observables extracted from equilibrium two-phase simulations, utilizing the one to one correspondence between the sizes and the coexistence temperatures of equilibrium solid clusters in the melt. It makes no assumption regarding the equilibrium shapes of the crystalline nuclei or the complexity of their crystal structures. Later in this paper, the power of this methodology is demonstrated by applying it to computer simulations of the fcc and the bcc-phase MSCLs of the EAM–Cu model. Consequently, the relative prevalence of these phases during the different stages of the nucleation and the growth processes is quantified. Furthermore, the validity of several standard phenomenological rules that are commonly used to analyze kinetics of solidification in experiments is discussed.
Solid–Liquid Systems Thermodynamics.
In the following, we describe a general and convenient methodology for directly extracting interfacial thermodynamic parameters from expectation values of macroscopic observables in computer or real-world experiments. We start by constructing the thermodynamic potential of a two-phase solid–liquid system at equilibrium in a closed ensemble (e.g., NPH) containing particles at overall pressure and enthalpy . We propose a subdivision of this system into a region of bulk solid surrounded by bulk liquid and separated by an interfacial region. This system is equilibrated at a uniform temperature , which is controlled by the ensemble enthalpy . The thermodynamic potential can thus be written as
It is profitable to express the interfacial free energy as
In contrast, for smaller clusters, the interfacial free energy density becomes a nonlocal functional of the crystal plane orientations in the neighborhood of each surface element. In the simplest cases, there will be functional dependence on to account for cluster surface curvature. This is the origin of the curvature coefficient , introduced in Eq. 4, and its explicit dependence on cluster size . For large clusters, .
The equilibrium/critical cluster size can now be obtained by minimizing the thermodynamic potential with respect to :
In this section, we have thus devised a general framework for direct extraction of interfacial free energy per atom from experimental measurements of a system’s volume, temperature, and pressure by using Eqs. 2, 3, and 6. No severe assumptions or uncontrolled approximations are made, and the framework can be generalized to multicomponent as well as multiphase solid nuclei. Furthermore, finite-sized curvature effects beyond the GT limit can also be accounted for. Finally, it is worth noting that for systems where the specific volumes of solid and liquid phases are nearly indistinguishable, the condition of zero interface volume (Eq. 3) can be replaced by a more appropriate order parameter, such as energy or bond-orientational order. Nonetheless, for most systems, the simplest order parameters for distinguishing the solid from the liquid phase will be adequate.
Phenomenological Models.
When studying rapid solidification experiments for the purpose of identifying the conditions that lead to kinetics-driven phase selections, in contrast to predictions based on equilibrium thermodynamics, it is essential to have accurate models of multiphase thermodynamics. One of the most important developments in this regard is Turnbull’s phenomenological rule (54) for solid–liquid interfacial free energies, which he showed to hold for a diverse collection of materials (mainly metals). This rule can be generalized to an exact ansatz, at least in the GT limit, as follows:
Turnbull’s remarkable rule conjectures that the solid–liquid interfacial tension scales as the difference in heat content of the solid and the liquid phases at the melting point. As a result, the dimensionless Turnbull coefficient is expected to be nearly independent of material chemistry. However, Turnbull found from experimentally inferred nucleation rates that for most metals, , while for nonmetals, (54). Furthermore, variation of about was predicted theoretically between the Turnbull coefficients of the fcc and the bcc crystal phases based on a polytetrahedral structural model of a liquid in contact with a rigid solid (5556–57). It should be noted that extracting homogeneous nucleation rates from experiments is a daunting task, as solidification in most cases is driven by heterogeneous processes, and error bars are usually very large. It is thus desirable to use computer experiments to quantitatively study this conjecture.
The temperature dependence of the Turnbull coefficient, to first order in deviation from the melting point, is determined by the entropic contribution . Nelson and Spaepen (58) have argued that the origin of the solid–liquid interfacial tension is mainly entropic, whereupon they proposed the so-called negentropic model according to which the interfacial tension is all entropic (i.e., ). Since must necessarily be positive, this entails a negative interfacial entropy, thereof the name negentropic. The negentropic model in combination with Turnbull’s rule has been widely used to analyze rapid solidification experiments (10).
Validation by Computer Experiments.
We now show that while Turnbull coefficients have distinct values for different phases, such as bcc and fcc, they are nearly constant over a wide range of pressures in a typical metal. Furthermore, by explicit calculations of the interfacial energy , we calculate the entropic contribution to the interfacial free energy and demonstrate the accuracy of the negentropic model.
In order to calculate the Turnbull coefficients of the fcc and the bcc phases, we have conducted careful calculations of fcc–liquid and bcc–liquid equilibria in the pressure range from 60 to 100 GPa. For these studies, cubic simulation boxes, containing in excess of 13 million atoms, have been utilized. At each pressure, three two-phase systems at different are equilibrated for 8 ns each using NPH MD simulations with a time step of 2 fs, and the coexistence temperatures and the systems’ volumes are recorded. The coexistence temperatures range from 30 to 60 K undercooling below . The measured values of and are inserted into Eqs. 2 and 3 to obtain , which in turn, is used in Eq. 6 to obtain the interfacial free energy . The latter is further used in Eq. 9 for evaluation of , with . At each pressure, the calculated are fitted to a linear temperature dependence, which is used to estimate .
Fig. 4A shows in the pressure range from 60 to 100 GPa for both the bcc and the fcc phases. To within the statistical accuracy of our calculations, for both phases can be considered nearly pressure independent, with and . While this result confirms that the Turnbull coefficient of the fcc phase exceeds that of the bcc phase, their ratio of about 1.16 is significantly smaller than was found in ref. 59; Sun et al. (59) calculated the Turnbull coefficients of fcc and bcc iron using different empirical potential models and found to be in the range from 0.5 to 0.55 in agreement with this work, but they found to be in the range from 0.29 to 0.36, which is significantly smaller, leading to a ratio in excess of 1.5. Our result, however, is in closer agreement with the calculated relative Turnbull coefficients of the fcc and the bcc phases according to the polytetrahedral structural model of the liquid (5556–57), as well as particle systems interacting via inverse power law potentials (60, 61). We thus conclude that the value of the Turnbull coefficient for a crystal phase can be quite sensitive to particle interactions. Nevertheless, we find the pressure dependence of the Turnbull coefficient to be weak, in agreement with a recent study of flat fcc–liquid interfaces (62).
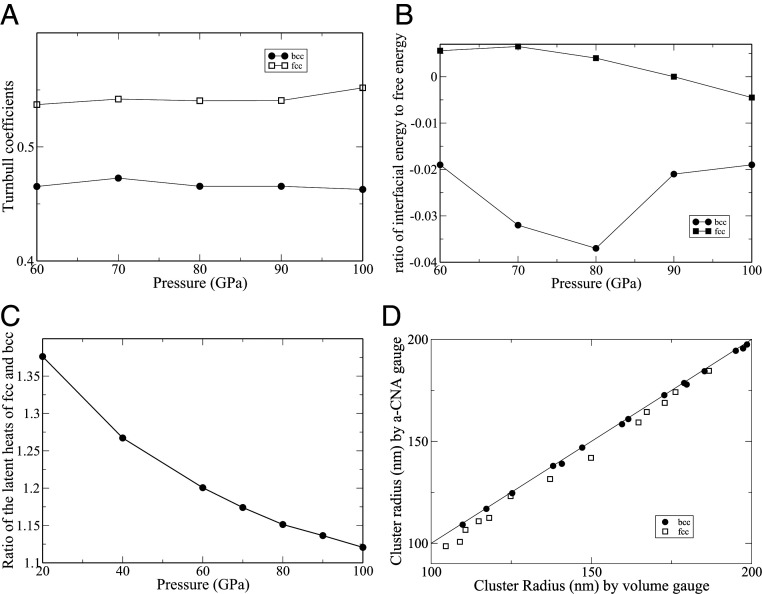
(A) Calculated Turnbull coefficients for the fcc and the bcc phases as a function of pressure. (B) Ratio of the interfacial energy to the interfacial free energy of the fcc and the bcc phases as a function of pressure. (C) Ratio of the latent heats of the fcc and the bcc phases as a function of pressure. (D) Comparison of two different algorithms (gauges) for extracting cluster radii from MD simulations. The filled circles are bcc-cluster radii extracted from two-phase simulations at different temperatures and pressures ranging from 60 to 100 GPa. The open squares are fcc-cluster radii extracted from two-phase simulations at different temperatures and pressures ranging from 60 to 100 GPa.
It should be noted that the preferential nucleation of the bcc phase at large undercoolings is driven by the interfacial free energy, which depends both on the relative Turnbull coefficients as well as the relative latent heats of the bcc and the fcc phases. The latter are shown in Fig. 4C, where it is observed that . Their ratio is, however, strongly pressure dependent. It is reduced from 1.37 at ambient pressure to 1.12 at 100 GPa. Nevertheless, at all pressures the larger latent heat and the larger Turnbull coefficient of the fcc phase contribute to .
In order to discuss the temperature dependence of the Turnbull coefficient, we calculate the energetic contribution as follows:
We conclude this section by exploring different gauges for determining the cluster size . We have until now only used the zero-volume gauge, which assumes the interface is infinitely thin. This gauge is convenient to use and applicable to any multiphase system with the coexisting phases having distinct specific volumes. In order to reduce the statistical error, elaborate order parameters have been devised in the literature that allow for accurate characterization the solid region within the liquid in two-phase systems. We have used one such method, described previously in ref. 41, as an alternative to the zero-volume gauge for determining . In this method, the phase character of each particle is first determined by the a-CNA (5051–52). Next, a coordination filter based on a radial distribution function is applied to remove atoms not belonging to the solid cluster. Finally, an effective radius for the cluster is determined by identifying its surface through Voronoi analysis. Fig. 4D shows the comparison between the radii calculated in this way and those calculated using the zero-volume gauge and the relation . The figure shows effective cluster radii extracted from a number of two-phase simulations of bcc- and fcc-phase clusters coexisting with liquid at different pressures and temperatures. Overall agreement is quite impressive. It is, however, interesting to note that the agreement between the two methods for the bcc cluster radii is clearly better than for the fcc ones. Furthermore, the common neighbor analysis seems to slightly underestimate the effective radii of the fcc-phase clusters compared with the zero-volume gauge. It is important to reiterate that the absolute value of the interfacial free energy is subject to the chosen gauge. The only gauge-invariant physical observables are the total system’s free energy, enthalpy, temperature, pressure, and volume. Therefore, it is important to use a consistent gauge when, for example, comparing the free energies of fcc- and bcc-phase nuclei coexisting with the liquid phase at a particular temperature and pressure.
Metastable–Solid Phase Diagrams
We are now ready to develop a general strategy for predicting kinetic stabilization of metastable crystal phases during solidification. For this purpose, we need to 1) quantify the relative phase stabilities of critical nuclei as a function of undercooling and 2) determine for each phase the extent of the MSCL basin or in other words, the range of solid-phase cluster sizes that can be considered metastable. In this way, we can predict the rate of transition from homogeneous undercooled liquid into any particular MSCL basin as a function of undercooling. As a result, we can identify the conditions that lead to metastable-phase growth by recognizing that whenever solidification occurs on a timescale shorter than the rate of transition out of an MSCL basin, the critical nuclei that belong to this basin are likely to grow to large sizes. To demonstrate the efficacy of this procedure, we apply it in the following two sections to the problem of metastable bcc-phase growth from the melt at pressures below 85 GPa, where one of the close-packed phases (fcc or hcp) is thermodynamically stable below the melting temperature (Fig. 1). It should be noted that in the vicinity of the hcp–fcc thermodynamic phase boundary (Fig. 1), stacking-fault free energies become so small that solidification into pure fcc or hcp phase becomes improbable. We conclude this paper with a discussion of intricacies arising from unusual structural features of hcp–liquid interfaces that promote mixed hcp/fcc-phase growth.
Solid–Nucleation-Phase Boundaries.
In this section, we describe the procedure for determining the undercooling temperature , below which the nucleation rate of the metastable bcc phase exceeds those of the fcc and the hcp phases of EAM–Cu. Above this temperature, nucleation is dominated by the close-packed phases (fcc, hcp, or a combination thereof) and below it, by the bcc phase. Within the CNT, the rate of nucleation of critical solid clusters at temperature is
Eq. 11 allows the nucleation-phase boundary to be determined by solving two equations: and . Hence, the phase boundary at any given pressure is the smaller of the two solutions and of the equations
Eq. 12 and its solutions are discussed in detail in SI Appendix. The resulting phase boundary , separating the temperature–pressure regions where bcc nucleation dominates [] from those where fcc or hcp nucleation prevails [], is shown in Fig. 5. At pressures GPa, (green line) is the nucleation phase boundary between the bcc and the fcc phases, and at GPa (red line), it constitutes the boundary between the bcc- and the hcp-phase critical nuclei. Whenever a critical nucleus belongs to an MSCL basin, it is expected to be long lived. It can thus grow to large sizes and be observed during solidification and likely even after the phase transformation has completed. In the next section, we determine the extent of the bcc–MSCL basin upon very strong undercooling by studying the kinetic stability of postcritical bcc nuclei.
A solidification–kinetic phase map. The top and bottom solid lines bound the region where solidification can take place. The four lines in order from top to bottom are 1) the thermodynamic melt line , with the green part depicting liquid/fcc-phase boundary and the red part depicting liquid/hcp; 2) the boundary , where the CNT rate of bcc nucleation equals the fcc rate (green part) or the hcp rate (red part) with a critical nucleation bcc–hcp–fcc triple point at GPa and K; 3) the boundary , below which the postcritical bcc nuclei become unstable and transform to fcc (green part) and mixed fcc/hcp (brown part); and 4) the boundary , below which the liquid phase becomes unstable and crystallization occurs with vanishing nucleation barrier and thus, can be observed in MD simulations. The colors depict the observed crystal phase in the simulations: fcc: green; mixed fcc/hcp: brown; and bcc: blue. The solid parts of the and lines bound the region, where the bcc phase is nucleated inside the bcc–MSCL subspace.
Before ending this section, we remark on the fcc–hcp–bcc critical nucleation triple point at GPa and K. The line connecting this point in Fig. 5 to the bulk thermodynamic fcc–hcp–liquid triple point at GPa and K is the boundary that separates the temperature–pressure regions where nucleation (according to the CNT) is dominated by the fcc phase from those where the hcp phase is most favored. However, we expect kinetic factors beyond those considered in this section to promote mixed fcc/hcp solidification at within at least a 10-GPa-wide pressure window about the thermodynamic triple point at GPa, due to diminishing energy cost of stacking faults. At first sight, this may seem only marginally relevant to solidification kinetics and have little effect on the liquid–solid interfacial kinetics. However, we will show in a later section that in regions where the CNT predicts hcp-dominated nucleation and growth, the liquid interface with special hcp plane orientations can in fact promote fcc-phase growth by a kinetic mechanism.
Kinetic Phase Stabilities of Postcritical Nuclei.
In the previous section, we computed the phase line , below which critical nucleation is dominated by the bcc phase. In this section, we determine the conditions for the bcc postcritical nuclei to grow to large sizes without transforming to other solid phases. Hence, we quantify the temperature–pressure region within which critical nucleation occurs inside the bcc–MSCL subspace. The weak coupling of the MSCL subspace to other basins guarantees growth of postcritical nuclei without solid–solid transformation. In contrast, the transient regions of the SCL basins contain postcritical clusters that may undergo structural instabilities. The extent of the transient subspace can be studied straightforwardly via NEMD simulations in the isobaric–isothermal (NPT) ensemble by 1) preparing atomistic configurations of critical solid-phase clusters embedded in the melt at different undercooling temperatures, 2) initiating dynamic trajectories from these configurations, and 3) characterizing the evolution of their solid-phase content as the solid clusters grow. The approach we have chosen to pursue for accomplishing the above tasks is detailed in SI Appendix. We have carefully applied this procedure to examining the kinetic stability of postcritical bcc nuclei at pressures 20, 30, 40, and 60 GPa. Our aim has been to identify the undercooling temperatures , below which the growing bcc nuclei transform to fcc/hcp phases. In other words, the critical nuclei smaller than do not belong to the bcc–MSCL basin, as they readily transform to fcc/hcp when growing. The result is shown in Fig. 5, where the line is green below 40 GPa and brown below 80 GPa. This coloring is intended to convey the fact that at temperatures below , in the green pressure region the unstable bcc nuclei are observed to transform to close-packed structures dominated by the fcc phase (SI Appendix, Fig. S9), while in the brown region, multiphase fcc/hcp clusters are observed (SI Appendix, Fig. S7). Of course, there is no sharp boundary between the two regions, and the hcp content of the multiphase region rises with increasing pressure. At 80 GPa, and coincide, and solidification at all undercoolings is found to be dominated by the bcc phase. This has been proven by direct NEMD simulations, which consistently show bcc nucleation and stable growth at GPa under ultrarapid cooling conditions.
It is beneficial here to discuss in some detail the physical meaning of the temperatures . They designate the lowest undercooling at which all of the computationally prepared bcc nuclei that could grow under this condition grow without transforming to other solid phases. This does not exclude that at lower temperatures, there may exist bcc clusters that can grow without transformation to close-packed phases. This rather conservative measure of metastability is justified if we seek to predict the conditions for experimental observations of macroscopic-sized solid phases. For this purpose, it should be recognized that our computer experiments are quite limited in their representation of the perturbations that can occur in realistic experiments. Nevertheless, examination of the ultrarapid solidification snapshot at 60 GPa, shown in Fig. 2, confirms the formation of bcc nuclei at the start of solidification, some of which transform to close-packed phases during early growth, with the close-packed content increasing with time.
It is instructive to briefly discuss the states at the boundary between the bcc–MSCL domain and the transient region. SI Appendix, Fig. S9 shows an example of a solid critical cluster at 30 GPa on the verge of dynamic stability. It contains about particles identified by a-CNA to mainly have bcc symmetry. This cluster was obtained by slowly shrinking a metastable bcc cluster in the NPH ensemble. When growing this cluster at 1,860 K in the NPT ensemble, it transitions to the fcc phase, while at 1,863 K, it grows to large sizes as bcc. This result is reproducible from different initial configurations, demonstrating the boundary of the bcc–MSCL subspace. It should be noted that the critical clusters at large undercoolings are far from compact and spherical, and their kinetics cannot be described within the CNT framework, which is better suited for the slower kinetics at small undercoolings.
We conclude this section by pointing out that here we have only scratched the surface of a vast phenomenology pertaining to kinetic stability of solid clusters growing within undercooled liquids. We have touched upon the growing bcc clusters in EAM–Cu, which transform to fcc at large undercoolings. This instability is conventionally expected to be due to the vibrational instability of the bulk bcc phase under these conditions. However, we show in SI Appendix that far from equilibrium conditions caused by fast interface kinetics can drive solid–solid phase transformations in growing clusters with stable bulk phonons. This mechanism is explicitly nonequilibrium and interface driven, and it cannot be explained by the dynamical structural properties of the bulk crystal phase alone.
Extraneous-Phase Interface Layers: Interfacial Phase Transformations Coupled to Growth-Mode Transitions
Hitherto in this paper, we have discussed kinetic stabilization of metastable single-phase bcc solid at significant undercooling. This is the expected regime based on Ostwald’s step rule, which suggests that small solid clusters in liquid can prefer phases other than the bulk equilibrium phase, due to their interfaces with the melt contributing substantially to their stability. As an example, the line representing in Fig. 5 depicts the minimal undercooling required for nucleation of metastable–bcc phase from the melt for the model Cu system of this study. In this analysis, the interface assumes a passive role. As described earlier in this paper, it suffices to consider the interface as a dividing surface occupying no space and containing no particles, only contributing to the overall free energy of solid nuclei immersed in the melt. This is reasonable as long as the internal structure of the solid–liquid interface can be neglected.
However, the observation of hcp nuclei with heterogeneous interface structures (Fig. 3C) is suggestive of the existence of such phenomenology that cannot be explained via the above approach. In particular, Fig. 3C shows that the (0001)-hcp planes interface the liquid via an fcc shell. This can be rationalized by the observation that the stacking fault free energy is an order of magnitude smaller than the solid–liquid interfacial free energy (SI Appendix).
The observation of a shell structure is not new. In fact, in the earliest computational studies (29) of the Lennard–Jones system, the fcc nuclei were found to be coated by bcc layers at their interfaces with the melt. To our knowledge, the ramifications of this unusual interfacial structure for the kinetics of solidification have not been explored in the literature. As mentioned earlier, we have not been able to observe such bcc shell structures in any of our systems, which suggests that the energy cost of fcc–bcc interfaces must be relatively high in our systems. However, the fcc shell structure at the interface of hcp-(0,001) planes with the melt offers an opportunity to study its unusual features.
Unusual internal structures of solid–liquid interfaces in finite-sized nuclei (e.g., Fig. 3C) inevitably bring forth the question of whether such atomic arrangements are dependent on the interfacial curvature. If so, structural transformations are to be expected at the interfaces of the growing solid nuclei. This is undoubtably a noteworthy phenomenon with possible deep ramifications for crystal growth kinetics. If not the case, the shell structure should appear even in the flat interface limit. In the following, we present an in-depth study of this limit by two-phase simulations of periodic slab geometries for two interface orientations, hcp-(0,001) and hcp-, in the neighborhood of the melting point K at 80 GPa, where hcp is the bulk equilibrium phase (Fig. 1). Based on our previous discussions of Fig. 3C, the hcp-(0001) interface with the liquid should be in the fcc phase, contrary to the hcp- interface that stays isostructural with the bulk phase (SI Appendix, Fig. S11). A systematic study of the dynamic properties of these solid–liquid configurations at small undercooling and superheating reveals the remarkable result shown in Fig. 6. It depicts the velocity of each interface as a function of temperature in the vicinity of ; positive sign of the velocity indicates growing liquid phase, and negative sign implies solid-phase growth. In the narrow range of temperatures studied in Fig. 6, about deviation from , linear response is expected. This is clearly observed for the hcp- interface mobility in Fig. 6. Note that due to the relatively small latent heat of the EAM–Cu system (i.e., ), which is typical of simple metals, the interface is atomically rough, and crystal growth is dominated by rates of attachment and detachment of atoms to the crystal surfaces that are controlled by liquid diffusivity, often only thermal velocity, and the latent heat (66). The available sites for attachment on the rough interfaces are large, commonly assumed to be about 1/4 of all of the sites, so-called repeatable step sites (67).
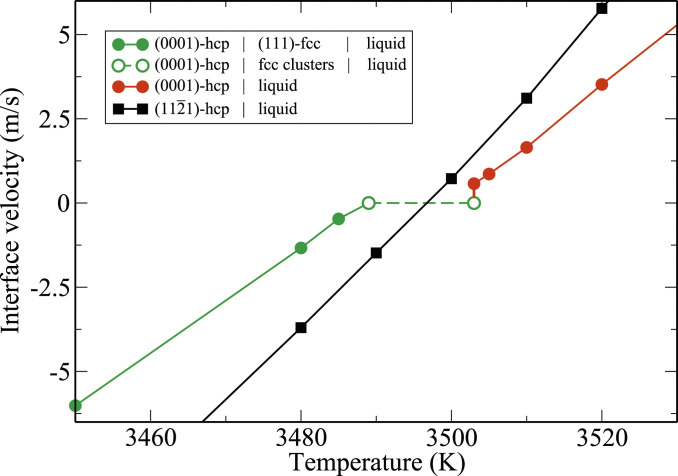
Temperature dependence of the mobility of two different hcp–liquid planar interfaces with orientations (0001) and at pressure GPa and K. The calculations are performed in periodic slab geometries, with dimensions specified in SI Appendix. The (0001) interface kinetics is partitioned into three temperature regimes. 1) K (green solid line with filled circles): The liquid phase transforms to the fcc phase, which grows on the hcp substrate. 2) K (green dashed line with open circles): No steady-state interface motion is observed. The hcp substrate interfaces the liquid through a film of fluctuating fcc clusters. 3) K (red solid line with filled circles): The hcp slab melts at steady rate.
In contrast, the (0001) interface velocity has strongly nonlinear temperature dependence. In particular, in the interval K, interface mobility vanishes on the simulation timescale exceeding 10 ns (dashed green line in Fig. 6). Outside of this interval, interface motion is observed to be normal, diffusive, and linearly changing with temperature variations. Above 3,503 K, the hcp phase shrinks smoothly at a speed proportional to the superheating, as shown in Fig. 6 as well as in SI Appendix, Fig. S13. Below 3,489 K, the interface region is solid fcc and grows steadily at a speed proportional to the undercooling from the fcc melting point at 3,489 K (Fig. 6 and SI Appendix, Fig. S14).
Fig. 7A explains the sudden dynamical arrest of the (0001) interface, observed at 3,503 K in Fig. 6, by invoking a first-order structural-phase transformation at the interface. The order parameter for this transformation is the fcc content of the interface. Above 3,503 K, the concentration of the fcc particles at the interface is dilute, which we designate as phase I. It undergoes a discontinuous jump at 3,503 K, transitioning to phase II, in which larger fcc clusters form and dissolve (SI Appendix, Fig. S12). While the rate of attachment to the fcc sites on the underlying hcp substrate is high, the clusters cannot become critical as long as the temperature is above the fcc melting point of 3,489 K. Further cooling toward the latter temperature causes the fcc content at the interface to steadily rise. As shown in SI Appendix, Fig. S11, the thicknesses of fcc-containing films at the interface are smallest near the transition temperature ( K) and increase upon cooling. Below 3,489 K, metastable fcc phase grows on the (0001) interface.
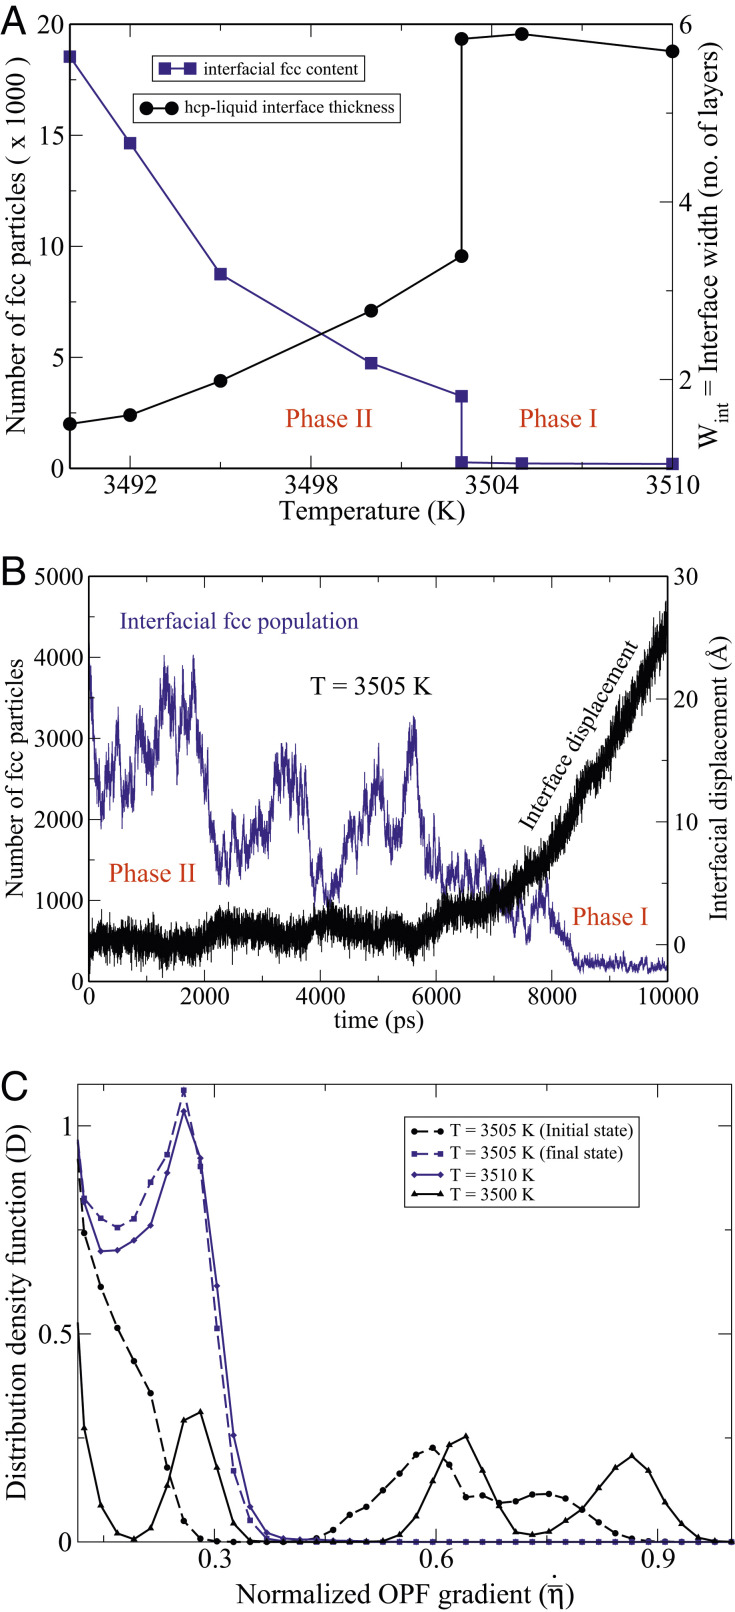
(A) The blue curve depicts the number of fcc particles in the system that mainly reside near the (0001)-hcp–liquid interfaces, and the black curve shows the interface widths as a function of temperature. (B) Time evolution of an NPT MD simulation at K, initiated from an (0001)-hcp–liquid equilibrium slab configuration at K. The blue line shows the evolution of the number of fcc particles, while the black line represents for the same simulation the displacements of the (0001)-hcp–liquid interfaces as a function of time, derived from the size fluctuations of the simulation box. The symmetry character of the particles have been identified via the common-neighbor analysis using a cut-off radius of 2.875 Å. (C) The distribution density function . The blue curves depict the distribution functions of the phase I atomically rough interfaces with relatively small OPF gradients, and the black curves show the sharp phase II interfaces with much higher OPF gradients. The dashed lines have been obtained by averaging over the first and the last 2,000 time steps of the simulation shown in B.
An important feature of first-order phase transformations is the presence of hysteresis, which implies that metastable phases exist in the vicinity of the transformation temperature. This is confirmed by NPT MD simulations at K, which can equilibrate in either phase I or II depending on initiation. In contrast, Fig. 7B clearly demonstrates that phase II is unstable at 3,505 K. It shows the time evolution of the fcc population at the interface in an NPT MD simulation starting from a configuration in phase II (large fcc content) generated at 3,500 K. During the course of the simulation, the fcc clusters dissolve, and the interfacial structure transforms to phase I (SI Appendix, Fig. S15). Similarly, we find that phase I is unstable at 3,501.5 K. Hence, the hysteresis window is at most 2 GPa.
Fig. 7B also records the motion of the interface with time. The intimate coupling of the interfacial structure to its dynamics is clearly evidenced in this figure. The fcc shell at the interface seems to constitute a protective shield for the hcp substrate, which starts dissolving at around 7,000 ps, when the fcc population has dwindled.
In order to explain the coupling mechanism between interfacial structure and its dynamics, we study the atomic roughness of the hcp–liquid interfaces at different temperatures. It correlates strongly with the width of an interface, which in turn, can be quantified by the extent of the region, where an order parameter field (OPF) exhibits large gradients. In the following, we outline a rigorous method for measuring interfacial thickness from atomistic simulations. As a result, we prove that hcp–liquid interfaces undergo an atomically diffuse to sharp transition concurrent with the structural transformation from phase I to phase II. Consequently, the growth mode changes abruptly from continuous (fast) to layer by layer with high nucleation barrier.
We choose as the order parameter the fraction of the particles in a volume element that are designated via the common-neighbor analysis as hcp. Let be the OPF along the hcp-(0001) plane normal, and define the OPF gradient as the derivative of this function. It is now straightforward to define and calculate the distribution of OPF gradients from the simulations. For this purpose, it is convenient to work with normalized OPF gradients: , where , with being the value of the order parameter in bulk hcp solid and being the interlayer spacing of the hcp-(0001) planes. The physical representation of is a maximally sharp interface, with a bulk solid layer next to a liquid layer with negligible order. We can now define the distribution density function in the interval , normalized by the relation
The result of the above analysis is shown in Fig. 7A, where a discontinuous drop in hcp–liquid interface thickness is observed upon phase transformation. Fig. 7C shows the density functions for a few interfaces belonging to the two different phases. It is clear that upon transformation from phase I to phase II, the interface becomes smooth and planar and grows layer by layer through two-dimensional nucleation with large activation barrier so that the interfacial motion halts within the computational time scale of this study.
We conclude this section by noting that the structural anisotropy of the hcp phase gives rise to heterogenous growth patterns. In particular, in the system studied here, a growing hcp cluster always contains smooth (0001) facets, on which only metastable fcc phase can grow (Fig. 3C). At the same time, other hcp–liquid interface orientations behave normally and promote the growth of the hcp phase. Hence, interfacial kinetics can drive the growth of multiphase nuclei. This explains the prevalence of mixed fcc–hcp clusters in the pressure range from 60 to 80 GPa (Fig. 3D).
Discussion
In this paper, we have conducted an in-depth study of the kinetic processes during solidification that stabilize crystal phases that are not thermodynamically stable in the bulk. At the nucleation stage, these phases are stabilized by their relatively low interfacial free energies. Additionally, at the growth stage, the kinetic barrier to structural transformation is high and therefore, makes any transition to the thermodynamic ground state improbable. This happens most prominently near the triple points of the phase diagram. By constructing a polymorphic nucleation theory from atomistic first principles and by conducting a rigorous study of the kinetic stability of postcritical nuclei during their growth stage, we have successfully managed to devise a rational framework for characterizing and quantifying the conditions for nucleation and growth of metastable crystal phases during solidification. As a result, in addition to the regular thermodynamic phase diagram, we also construct a kinetic phase diagram that delineates the temperature–pressure regions where metastable phases are favored to grow from the melt.
As a proof of concept, we have applied the above methodology to an atomistic system described by a model EAM–Cu interatomic potential. We thus construct a metastable phase map complementing the thermodynamic phase diagram of this system (Fig. 5). It is quite sobering to observe the significant extent of the metastable region. It is bounded from above by the solid-nucleation phase boundary and from below by , under which the growing bcc nuclei become kinetically unstable. The procedure adopted in this paper assumes near-equilibrium critical nuclei, whose thermodynamic as well as kinetic stabilities are investigated. However, no simplifying assumptions regarding their shapes or structures are made. No doubt, more sophisticated studies of the nonequilibrium kinetics during nucleation are necessary to determine the domain of validity of the assumption of near-equilibrium nuclei (68).
It should be noted that kinetic phase maps are not universal. They depend on the kinetic mechanism that is being considered. Conventionally, kinetic stabilization of metastable phases has been discussed as a result of phase selection during the nucleation stage described within the CNT. In this picture, thermodynamic driving forces govern the phase of a critical nucleus, which according to the CNT, grows to large sizes no fail. In this way, kinetic phase diagrams can be drawn and be interpreted just like thermodynamic phase diagrams. In this paper, we have generalized this idea by including kinetics in a restrictive way as to preserve the notion of a phase diagram. For this purpose, we have introduced the concept of SCL basins and their MSCL subspaces, defined as subdomains of the former that are weakly connected to other SCL basins. Hence, nucleation from the undercooled liquid into a particular MSCL subspace with near certainty is guaranteed to evolve without further phase transformations. The real power of this idea lies in the realization that MSCL subspaces contain all of the large clusters since the barrier to nucleation of solid–solid transformations only increases with cluster size. Hence, if critical nucleation occurs in the transient region of the SCL basin, unless kinetic instabilities occur within a short time after, the nucleus inevitably grows large enough to transition to the MSCL subspace. Hence, thermodynamic conditions that lead to nucleation into the MSCL subspace can be easily identified by exclusion of all those that lead to a finite number of clusters undergoing kinetic instabilities amid their early growths.
While the above is quite a reasonable guiding principle for construction of solidification–kinetic phase diagrams, it is too restrictive and sweeps all real complexities aside by excluding them from the MSCL subspaces. This shortcoming becomes apparent after the growth of metastable fcc in competition with an anisotropic crystal phase such as hcp is considered. In this case, the solid–liquid interface cannot be treated as uniform. Rather, there are special interfaces, whose behaviors are radically different from others. These interfaces can have complex structures distinct from the bulk of the solid clusters and can undergo phase transformations, which in turn, induce sharp transitions in the growth kinetics of competing crystal phases in their neighborhoods. Due to this explicit role of interfacial structure and dynamics, different crystal orientations may promote growth of disparate crystal phases. As a result, the fundamental notion of the kinetic phase boundary as an infinitely thin dividing surface in analogy with the thermodynamic phase boundary must be abandoned and generalized.
Materials and Methods
In this paper, we have presented results of a series of large-scale MD simulations using the LAMMPS code (44) and the EAM interatomic potential for Cu metal, as constructed by Mishin et al. (45). This model represents the bulk physical properties of Cu quite well at ambient condition. While it is not fitted to high-pressure ab initio data, it constitutes a reasonable model for atomic interactions in a generic close-packed metal under pressure. When not otherwise specified, simulations were performed with a 1-fs time step. Visualization and analysis of simulation snapshots were carried out using the OVITO program package (69). Solid-phase designation of each particle has been done via a-CNA (5051–52). Particles are colored according to their phase designation: fcc phase (green), bcc phase (blue), and the hcp phase (red).
Acknowledgements
B.S. and J.L.B. are grateful for the guidance, insights, and support from Prof. Russell Hemley. We acknowledge Alex Chernov, Lorin Benedict, Sebastien Hamel, and Amit Samanta for helpful discussions. We also thank A. Arsenlis, D. P. McNabb, B. K. Wallin, and R. S. Maxwell for project support. This work was performed under the auspices of the US Department of Energy by Lawrence Livermore National Laboratory Contract DE-AC52-07NA27344.
Data Availability
All study data are included in the article and/or SI Appendix.
References
1
2
3
4
5
6
7
8
9
10
11
12
13
14
15
17
18
19
20
21
22
23
24
25
26
27
28
29
30
31
32
33
34
35
36
37
38
39
40
41
42
43
44
45
46
47
48
49
50
51
52
53
54
55
56
57
58
59
60
61
62
63
64
65
66
67
68
69