 Nongenetic individuality, changeability, and inheritance in bacterial behavior
Proceedings of the National Academy of Sciences of the United States of America


Contributed by Stanislas Leibler, February 20, 2021 (sent for review November 9, 2020; reviewed by Thierry Emonet, William Ryu, and Tom Shimizu)
Author contributions: M.P., D.J., and S.L. designed research; M.P. and D.J. performed research; M.P., D.J., Z.F., and B.X. analyzed data; and M.P., D.J., Z.F., B.X., and S.L. wrote the paper.
Reviewers: T.E., Yale University; W.R., University of Toronto; and T.S., AMOLF, Amsterdam.
1M.P. and D.J. contributed equally to this work.
3Present address: Gurdon Institute, Cambridge University, CB2 1QN Cambridge, United Kingdom.
4Present address: Department of Physics, University of Florida, Gainesville, FL 32611.

- Altmetric
Isogenic microbial populations in constant and homogeneous environments can display remarkable levels of phenotypic diversity. Quantitative understanding of how such diversity is generated and maintained in populations is, however, experimentally and theoretically challenging. We focus on the swimming behavior of Escherichia coli as a model system of phenotypic diversity and show that, despite temporal changes in behavior that each individual undergoes, significant differences between individuals persist throughout most of their lifetimes. While the behavior of even closely related bacteria can be remarkably different, the behavioral variations produced by nongenetic mechanisms are inherited across generations. The general experimental and theoretical framework developed here can be applied to study quantitative aspects of phenotypic diversity in many biological systems.
Isogenic populations often display remarkable levels of phenotypic diversity even in constant, homogeneous environments. Such diversity results from differences between individuals (“nongenetic individuality”) as well as changes during individuals’ lifetimes (“changeability”). Yet, studies that capture and quantify both sources of diversity are scarce. Here we measure the swimming behavior of hundreds of Escherichia coli bacteria continuously over two generations and use a model-independent method for quantifying behavior to show that the behavioral space of E. coli is low-dimensional, with variations occurring mainly along two independent and interpretable behavioral traits. By statistically decomposing the diversity in these two traits, we find that individuality is the main source of diversity, while changeability makes a smaller but significant contribution. Finally, we show that even though traits of closely related individuals can be remarkably different, they exhibit positive correlations across generations that imply nongenetic inheritance. The model-independent experimental and theoretical framework developed here paves the way for more general studies of microbial behavioral diversity.
Phenotypic diversity plays a crucial role in ecological and evolutionary processes (1, 2). Traditionally, phenotypes of individuals are assumed to vary either as a consequence of genetic mutations present at birth (1) or in response to different environments experienced during the lifetime (3). However, it is now widely appreciated that even genetically uniform populations growing in constant and homogeneous environments can express a remarkable degree of phenotypic diversity. Such diversity is especially important for clonally reproducing microorganisms, which form dense populations with limited genetic variability (4). Indeed, nongenetic diversity in microorganisms has been shown to play important roles in various processes such as persistence to antibiotics (5), resistance to heat (6), competence for DNA uptake (7), chemotaxis (8), and many others.
How phenotypic variations are formed and transmitted across generations in isogenic populations at the organismal level is, however, poorly understood. For some phenotypic traits, individuals exhibit differences that persist throughout most of their lifetimes (individuality), which can result from uneven partitioning of cellular components upon cell division (9, 10), or from transcriptional regulation by epigenetic switches (11). For other traits, diversity arises from changes occurring during the lifetime (changeability), which can result from the stochastic nature of gene expression (12), or from deterministic changes associated with the progression of the cell cycle (13). Especially in the context of more complex features, such as the behavior, it is likely that multiple sources contribute to the total diversity in a population. However, disentangling the sources of diversity remains a challenge since it requires continuous, noninvasive measurements in a large number of individuals on the timescale of generations.
The swimming behavior of the bacterium Escherichia coli is a well-studied, biologically relevant aspect of the phenotype for which such measurements are feasible. The behavior of E. coli is customarily described as a sequence of periods (∼1 s) of straight swimming (“runs”), interrupted by abrupt (∼0.1 s) directional changes (“tumbles”) (14). Different parameters derived from this “run-and-tumble” model, such as run speed, tumble speed, tumble frequency, tumble bias, and so on (1516–17), have been previously used to characterize the behavior of individual E. coli and demonstrate the existence of substantial variation among individuals in a population (18), as well as changes over an individual’s lifetime (19). However, the choice of parameters used to describe behavior is often subjective and to a certain extent reflects our perception of the behavior, rather than the capacity of these parameters to capture the observed behavioral diversity. At the same time, such preselected parameters are in many cases correlated (15, 17) and are therefore redundant in the sense that they do not represent independent traits.
To overcome these issues, we build on the previously introduced model-independent framework for quantifying microbial behavior (20) and show that the swimming behavior of E. coli is effectively captured by two statistically independent and biologically interpretable traits. Representing the observed behavioral variation in this low-dimensional space allows us to use simple statistical tools to study basic aspects of behavioral diversity in E. coli including nongenetic individuality, changeability, and inheritance.
Results
Capturing the Nongenetic Individuality, Changeability, and Inheritance in Bacterial Behavior.
We sampled the behavioral diversity of E. coli by recording long-term swimming trajectories of hundreds of individual bacteria over two successive generations. In each experiment, a single bacterium was isolated from a large population grown under well-controlled conditions and subsequently enclosed in a circular microfluidic chamber filled with growth medium (Fig. 1A). The two-dimensional swimming trajectory of this bacterium was continuously recorded at a high frame rate (50 Hz) from the moment it was enclosed in the chamber until it divided. The swimming trajectories of the two daughter bacteria were also recorded from the time of their birth until next division (Movie S1). Together, the three bacteria constitute what will be referred to as a “family.” The bacteria in the first and the second generation will be referred to as the “mother” (M) and two “daughters” (D1 and D2), respectively (Fig. 1B).

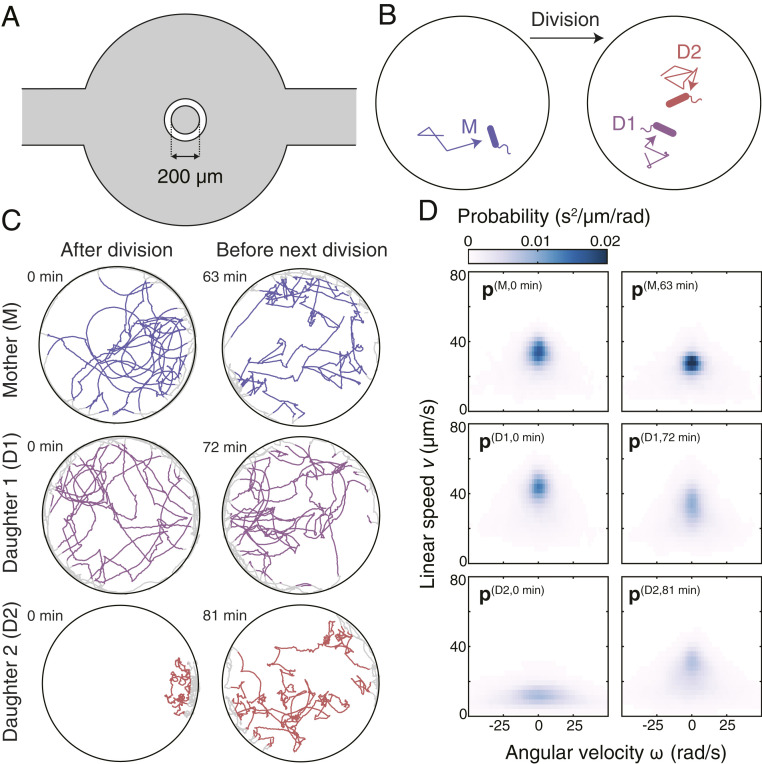
Behavioral diversity of E. coli and the probabilistic description of behavioral states. (A) A schematic representation of the microfluidic device. Parts filled with liquid medium are shown in gray. The diameter of the central chamber, in which the bacteria are observed, is 200 μm. The wall separating the central chamber from the loading channel (shown in white) is 50 μm thick. The channels and the central chamber are 15 μm deep. (B) A cartoon representing the experimental approach. Each experiment begins with enclosing a single bacterium in a circular microfluidic chamber filled with growth medium. The swimming behavior of the “mother” (M) and its two “daughters” (D1 and D2) is continuously recorded. The bacteria are not drawn to scale. (C) Representative trajectory segments of three bacteria constituting a single family. For each individual, we show two trajectory segments: one occurring just after division (Left) and one just before the next division (Right). The time each trajectory segment starts is specified. Parts of trajectories located in the bulk of the chamber are shown in color; parts excluded from the analysis due to wall proximity are shown in gray. (D) Probability distributions characterizing the trajectory segments shown in C. The full range of is −150 ro 150 rad/s. Only a part of the range was plotted to improve the readability of the figure.
Our sample of behavioral diversity includes trajectories from 150 families (150 mothers + 300 daughters) measured in two different strains and three types of growth media supporting different growth levels (Table 1). To describe gradual changes in the swimming behavior occurring over the lifetime of individuals, we split each trajectory into nonoverlapping segments of a fixed length (180 s). The length of the time segment was decided based on the analysis of autocorrelation functions of linear speed and angular velocity ( and , respectively) (SI Appendix, Fig. S1A), which will serve as the basic kinematic variables used in our description of a behavioral state presented below. We observed that the behavior of most bacteria showed changes at two characteristic time scales (SI Appendix, Fig. S1 B and C): one shorter than a fraction of a second, which likely represents switching between runs and tumbles, and one longer than several minutes, which represents long-term behavioral changes. While the short-timescale changes are not resolved at our level of coarse graining, the long-term changes in behavior are captured. This “time coarse graining” resulted in 20 segments per bacterium on average and segments in total (SI Appendix, Fig. S1D).

| Strain | Medium | No. of families | Doubling time, min (μ ± σ) | No. of segments |
| MG1655 | Cas | 60 | 53 ± 14 | 3,194 |
| Glu | 30 | 58 ± 15 | 1,791 | |
| Gly | 30 | 76 ± 25 | 2,310 | |
| RP437 | Cas | 30 | 49 ± 15 | 1,484 |
The positions of bacteria were tracked continuously in order to maintain identities. However, to avoid the effects of wall interactions, we include in our analysis only parts of the trajectories occurring in the “bulk” of the chamber, i.e., the area more than 10 μm away from the chamber’s wall (SI Appendix, Fig. S1E), where the linear speed and angular velocity were mostly independent of the radial position (SI Appendix, Fig. S1F). On average, the bacteria spent about 55% of time swimming in the bulk of the chamber (SI Appendix, Fig. S1G). The time spent near the wall was weakly positively correlated with the mean speed and weakly negatively correlated with the mean angular velocity (SI Appendix, Fig. S1 H and I), possibly because bacteria with a higher angular velocity are more likely to escape the wall region. Circular trajectories with a high curvature (SI Appendix, Fig. S1 J, K, and L), which are known to result from hydrodynamic interactions of flagella with flat surfaces (21), were rare in our dataset.
A Model-Independent Description of a Behavioral State.
Each trajectory segment represents a manifestation of the “behavioral state” expressed by an individual during the corresponding time interval. Indicative of nongenetic individuality and changeability, trajectory segments displayed qualitative differences between individuals as well as within individuals’ lifetimes even for bacteria from a single family (Fig. 1C). A systematic analysis of this diversity requires a quantitative description of a behavioral state. To this end, we characterize each behavioral state by a joint probability distribution of instantaneous linear speed and angular velocity ( and , respectively), calculated for each timepoint along the given trajectory segment (20) (Fig. 1D). In other words, a behavioral state of individual during the segment starting at time is described by a vector composed of nonnegative components corresponding to the normalized frequencies of the observed values. In practice, we discretize the range of and into 30 and 165 uniformly sized bins (SI Appendix), respectively, which yields bins in total. In contrast to characterizing the behavior using parameters based on the run-and-tumble model, which each only captures a specific aspect of behavior, quantifying behavioral states by probability distributions of and allows us to capture all changes in behavior that manifest as altered frequencies of these basic kinematic variables at the timescale of one segment (180 s). In general, additional kinematic variables besides and can be included in the model-independent description of a behavioral state to construct higher-dimensional probability distributions that capture specific aspects of behavior (SI Appendix).
A Low-Dimensional Representation of Behavioral States.
Because each behavioral state is described by a probability distribution specified by components, it can be represented by a single point in a -dimensional space. However, as we will show, the set of observed behavioral states does not spread along all -dimensions of this space but is largely restricted to an -dimensional subspace with . To find the low-dimensional subspace that captures the largest possible fraction of behavioral diversity (Materials and Methods), we used the method of nonlinear principal component analysis (NLPCA) (22). The method of NLPCA was preferred over the standard PCA, because the low-dimensional subspace was nonlinearly embedded in the high-dimensional space, which the standard PCA failed to represent (SI Appendix, Fig. S2A).
Remarkably, we found that more than 85% of the behavioral diversity could be captured by only two nonlinear principal components (NLPCs), with the first and second NLPC capturing 78% and 7% of the total behavioral diversity, respectively (Fig. 2A). The fraction of diversity captured by additional NLPCs beyond the first two quickly diminished. In agreement with its inability to represent nonlinear relationships between variables (SI Appendix, Fig. S2A), the standard PCA seemed to overestimate the number of principal components required to capture an equivalent fraction of diversity (Fig. 2A). As a result of the low effective dimensionality of the behavioral space, the behavioral state of individual during the segment starting at time can be represented by a two-dimensional vector with components and corresponding to the first and second NLPC, respectively. The two components will be referred to as “behavioral traits” b1 and b2. The set of all behavioral states embedded in the space defined by traits b1 and b2 is shown in Fig. 2B. Notably, we did not observe any correlation between b1 and b2, which signifies that the two traits are independent. This low-dimensional representation of behavioral states will be crucial for the statistical analyses of nongenetic individuality, changeability, and inheritance performed below.
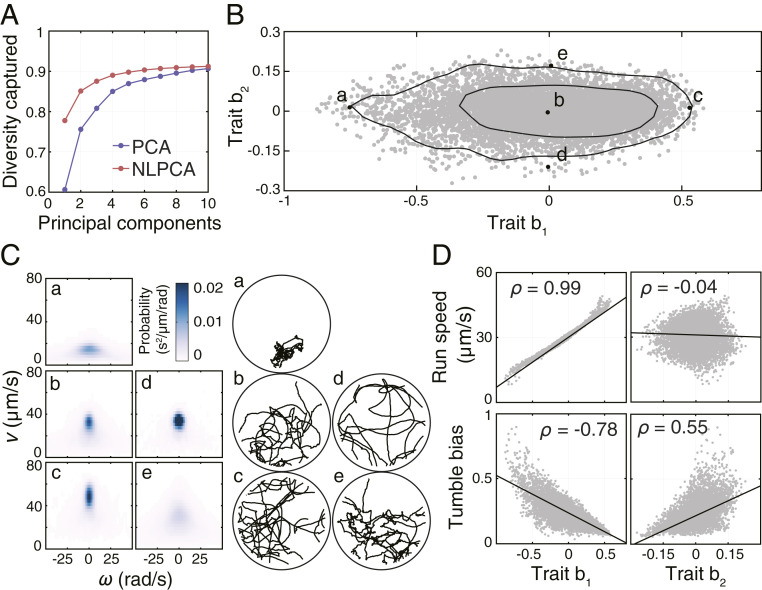
Dimensionality of the behavioral space and the interpretation of behavioral traits. (A) Fraction of captured behavioral diversity as a function of the number of principal components obtained in either linear PCA or NLPCA. The diversity captured by linear PCA was calculated as the variance of the first principal components. The diversity captured by nonlinear PCA was calculated by first projecting the behavioral states from the -dimensional space of NLPCs back to the full -dimensional space and calculating the corresponding variance. (B) Distribution of all 8,779 observed behavioral states embedded in the low-dimensional space of traits b1 and b2. Black lines enclose the smallest areas containing 68% and 95% of the kernel-estimated density of all observed behavioral states. Highlighted in black are five representative behavioral states (a, b, c, d, and e) whose probability distributions and trajectories are shown in C. (C) Probability distributions and trajectory segments corresponding to the five behavioral states highlighted in B. (D) Interpretation of traits b1 and b2 in terms of the run-and-tumble model of behavior. is Pearson’s correlation coefficient. Regression lines are shown as black solid lines.
Interpretation of Behavioral Traits.
By plotting probability distributions and trajectory segments corresponding to the behavioral states located along the axes of the low-dimensional behavioral space (points a, b, c, d, and e in Fig. 2B), we observed that the first trait (b1) correlated with the mean swimming speed, whereas the second trait (b2) increased with the number of turns in the trajectory segment (Fig. 2C). To quantify these relationships, we identified runs and tumbles in each trajectory segment using a usual stereotyping approach (14, 16) (SI Appendix) and calculated the mean speed of runs (run speed) and the fraction of the time spent tumbling (tumble bias) for each segment. We found that trait b1 correlated positively with run speed and negatively with tumble bias (Fig. 2D), whereas trait b2 was independent of run speed but correlated positively with tumble bias. Because run speed and tumble bias were themselves negatively correlated (SI Appendix, Fig. S2C), it followed that b1 captured the run speed and the correlated part of tumble bias, whereas b2 captured the part of tumble bias not correlated with run speed (SI Appendix, Fig. S2D). In addition to capturing a large fraction of the observed behavioral diversity, the two behavioral traits thus have a simple interpretation in terms of the established run-and-tumble model, which highlights the ability of our approach to extract biologically meaningful features from a model-independent description of behavior.
Genetic and Environmental Effects on Swimming Behavior.
The distribution in Fig. 2B shows all behavioral states expressed over the lifetimes of 450 bacteria representing two different genotypes grown in three different media (Table 1). To assess the genetic and environmental effects on the swimming behavior, we compared the distributions of behavioral states observed under different experimental conditions. In all cases, the distributions were broad and overlapped to a large extent (SI Appendix, Fig. S3 A and B). Differences in experimental conditions explained less than 10% of variance in both traits, indicating that the observed behavioral diversity originated predominantly from within experimental conditions, i.e., from nongenetic diversity, rather than from genetic or environmental effects.
Nongenetic Individuality and Changeability in Swimming Behavior.
To visualize the sources of behavioral diversity within an experimental condition, we highlight in Fig. 3A behavioral states of three bacteria constituting a single representative family. The traits expressed by these individuals showed differences that persisted throughout their lifetimes, while, at the same time, long-term trends, as well as rapid, seemingly random changes could be observed. In order to quantify these effects, we described the behavioral states of individual during the segment starting at time as , where corresponds to the mean behavioral state of individual calculated as the mean of behavioral traits expressed by the individual over its lifetime (individuality term), corresponds to the temporal trend calculated from regression as described below (changeability term), and is the residual term capturing changes in behavior not captured by the trend. While calculating is straightforward, determining and requires first specifying a model for how traits of individuals change as a function of time . For the sake of generality, we used a family of polynomial functions , where are parameters fit by regressing the mean-subtracted traits on time As an example, we show in Fig. 3B the behavioral states expressed by a representative individual (D2 from Fig. 3A) fit by a second-order polynomial function.
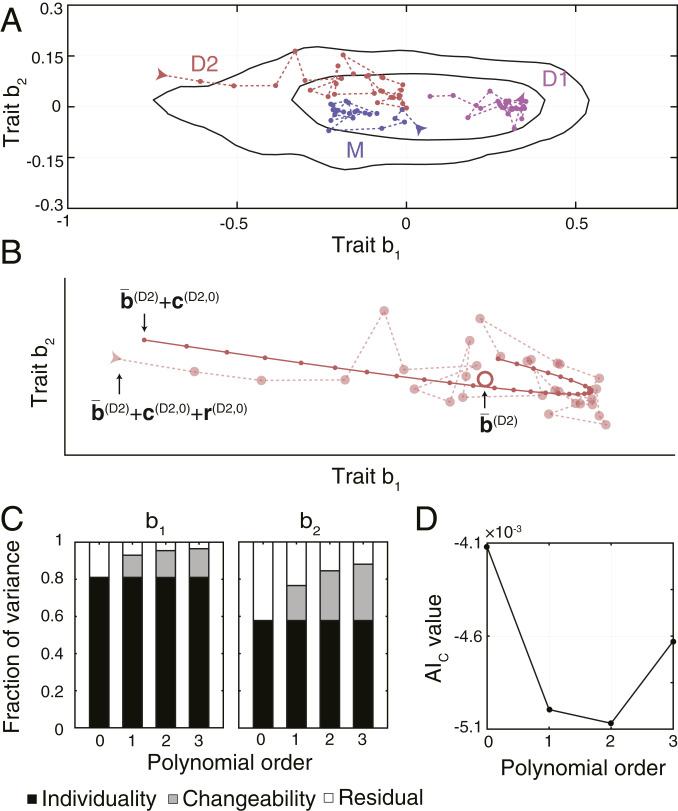
Nongenetic individuality and changeability in swimming behavior. (A) Behavioral states of a representative family (the same as shown in Fig. 1C). Behavioral states of the same individual are connected by a dashed line. Arrows mark the first state of each individual. Black lines enclose the smallest areas containing 68% and 95% of the kernel-estimated density of all observed behavioral states. (B) Behavioral states of D2 shown in A, fitted with a second-order polynomial. The observed behavioral states are shown as semitransparent points connected with a dashed line. The large, open point represents the mean behavioral state. Small, closed points connected with a solid line show the fitted trend. (C) Fractions of variances across all 450 bacteria attributed to individuality, changeability, and residual variance for models of increasing complexity. (D) AIC values for models of increasing complexity. A lower value indicates a more appropriate model of temporal trends. The AIC values were calculated using the traits of all 450 bacteria across all experimental conditions.
Decomposing the Behavioral Diversity.
Describing the behavior of individuals as specified above allows us to decompose the total variance in behavioral traits into three contributions (Materials and Methods):
By decomposing the variance in traits of all 450 bacteria, we found that nongenetic individuality accounted for 81% and 58% of variance in traits b1 and b2, respectively, and was thus the main source of behavioral diversity (Fig. 3C). The fraction of variance attributed to changeability increased with the order of the polynomial function used to model the temporal trend, simply because models with more parameters can fit the data better. To prevent overfitting, we used a model selection criterion, the aim of which is to balance the explanatory power of the model with the number of its parameters (SI Appendix) (23). This criterion, according to which models with a lower corrected Akaike information (AIC) value provide a better representation, indicated that a second-order polynomial provided the most appropriate model for temporal trends (Fig. 3D). The long-term trends of individual bacteria varied in their direction and magnitude (SI Appendix, Fig. S3C), indicating that changes in behavior during the lifetime of individuals cannot be explained purely by cell-cycle progression. These results show that while changeability represents a nonnegligible source of behavioral diversity, the most important source is nongenetic individuality. Performing the decomposition for each experimental condition separately yielded consistent results (SI Appendix, Fig. S3D), as did varying the segment length in the range of 1 to 6 min (SI Appendix, Fig. S3E).
Nongenetic Inheritance of Swimming Behavior.
In agreement with nongenetic individuality being the major source of behavioral diversity, the mean behavioral states of individuals were broadly distributed (Fig. 4A) over the low-dimensional behavioral space. The means and the variances of the two distributions were in a good agreement (SI Appendix, Table S1), which indicates that the behavioral states of mothers and daughters are sampled from very similar distributions. However, this does not imply that the behavior of daughters is independent of their mothers’ behavior. In particular, transmission of traits across generations could result in positive correlations between traits of mothers and their daughters. To test whether such transmission occurs, we calculated the Pearson correlation coefficient between mean behavioral states of all mother–daughter pairs under a given experimental condition. The use of here is analogous to its use as a measure of “heritability” in biometry, where it quantifies phenotypic similarity caused by transmission of genetic factors (24). However, in our experiments the genotype is identical for all bacteria under a given experimental condition, so the parameter quantifies similarities in behavior caused by transmission of nongenetic factors, rather than genetic factors. We observed positive correlations between mother–daughter pairs for both traits across all experimental conditions (Fig. 4B). The magnitude of these correlations was comparable across conditions even though some differences were observed, in particular the stronger inheritance of trait b1 in bacterial strain RP437. Positive correlations were also measured between daughter–daughter pairs, even though their magnitude was more heterogeneous across experimental conditions (as compared to mother–daughter correlations) (SI Appendix, Fig. S4A).
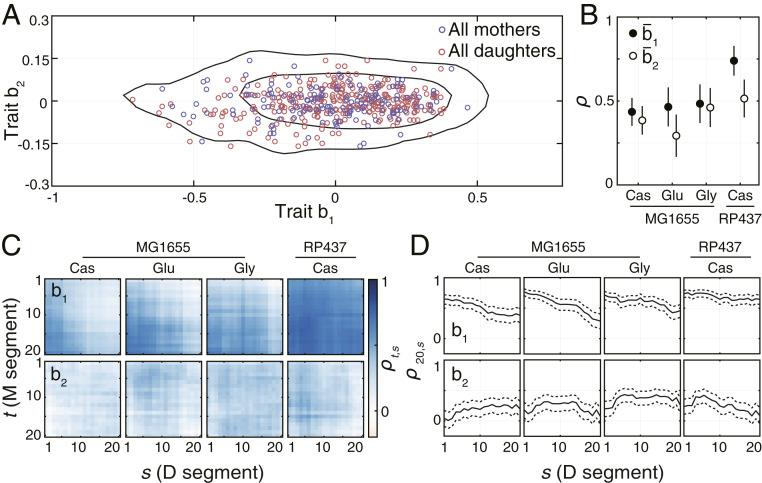
Inheritance of swimming behavior. (A) Mean behavioral states of all 450 bacteria. Black lines enclose the smallest areas containing 68% and 95% of the kernel-estimated density of all observed behavioral states. (B) Correlation coefficients of mean behavioral states between all mother–daughter pairs under the given environmental condition. Error bars show SE of the correlation coefficient. The number of mother–daughter pairs used to calculate the correlation coefficients was 120 for MG1655 in Cas and 60 for the remaining conditions. (C) Time-resolved cross-correlations for all mother–daughter pairs observed under different experimental conditions. The mean segment length was 173 s with the SD of 60 s. (D) Correlations between behavioral traits expressed during the last segment (t = 20) of the mother’s lifetime and the behavioral states expressed throughout the daughters’ lifetime. Dashed lines show SE of the correlation coefficient.
To account for the tendency of traits to change during the lifetime of individuals, we calculated the cross-correlations between traits of all mother–daughter pairs in a time-resolved manner. Specifically, we split each trajectory into an equal number of segments of varying length (as opposed to a varying number of segments of a fixed length used above) and calculated the cross-correlation between each pair of segments from the mother and the daughter respectively. In the case of trait b1, we observed that the correlations were largest between the end of the mother’s lifetime and the beginning of the daughter’s lifetime (Fig. 4C). These correlations decreased continuously yet remained positive throughout the lifetime of daughter bacteria (Fig. 4D). The rate of decrease was significantly slower in RP437, as compared to MG1655 which indicates a longer memory of the inherited behavioral state and explains the larger heritability of observed in this strain. In comparison, the correlations in trait b2 remained approximately constant throughout the lifetimes of the mother and daughter bacteria (Fig. 4 C and D). These results indicate that temporal trends in trait b1 tend to reduce the similarity between daughters and their mothers. The cross correlations of daughter–daughter pairs remained mostly unchanged throughout the lifetimes of bacteria, even though weak temporal trends could be observed under some conditions (SI Appendix, Fig. S4B).
Discussion
The benefit of quantifying the behavior by traits inferred from the data, as compared to preselected parameters derived from an assumed model, is that the inferred behavioral traits are not dependent on our knowledge or perception of behavior and therefore provide a more natural and inclusive representation of the observed behavioral diversity. In the case of E. coli, the low number of behavioral traits sufficient to capture a major part of behavioral diversity might seem unexpected, given the large number of physiological factors known to affect the swimming behavior (25). This disproportion implies that even though numerous physiological factors might be involved in generating the observed diversity, the individual contributions are integrated at the level of the organism such that the behavioral variations occur predominantly along a small number of dimensions. For example, it was shown that the length and density of flagella (26) and the intracellular concentration of cyclic di-GMP (27) affect run speed, whereas the stoichiometry of proteins in the chemotaxis signaling network affects tumble bias (16, 19). At the level of individual motors, some factors such as the proton motive force and motor load affect both the motor rotation speed, as well as the rate of directional switching (2829–30). However, it should be noted (as was pointed out to us by one of the reviewers) that decreasing the proton-motive force is expected to decrease both the rotation rate and the switching rate of individual motors, which stands in contrast to the negative correlation between the run speed and tumble bias observed here. This contrast indicates that qualitatively different constraints apply at the level of individual motors, as compared to the level of freely swimming bacteria and that some of the mechanisms imposing these constraints are yet to be elucidated.
Our observation that nongenetic individuality is the main source of behavioral diversity indicates that the underlying molecular processes have typical timescales comparable to a bacterium’s generation time. As a particularly strong manifestation of individuality, we observed significantly different behaviors even between two daughters originating from the same mother. We hypothesize that asymmetric partitioning of cellular components such as flagella, proton pumps, and chemotaxis receptors could produce such differences between individuals (9, 10, 31). This type of asymmetry could lead to differences in the total number of such structures, as well as in their positioning on the cell envelope (31), both of which could affect the behavior. Changeability could then reflect processes occurring at shorter timescales, such as pulses of expression from promoters regulating flagellar synthesis (32), as well as more deterministic processes related to cell-cycle progression, such as the increased drag caused by cell growth. The main appeal of the statistical method for decomposing the total diversity described here is that it provides a higher-level overview of behavioral diversity in a population without the necessity to keep track of the large number of physiological and molecular factors known to influence the swimming behavior.
By recording the swimming behavior of bacteria across two consecutive generations, we estimated the extent to which traits are inherited across generations. Because, in our experiments, the bacteria are genetically identical, the information transmitted must be stored elsewhere than in the DNA sequence. For single-celled organisms that reproduce by binary fission, the phenomenon of nongenetic inheritance can be explained by the fact that, in addition to the genetic sequence, a daughter inherits from its mother about half of the cellular components, including membrane structures, metabolic proteins, and regulatory elements. While nongenetic inheritance was previously observed in bacteria (11, 33), as well as single-celled eukaryotes (34), its role in the ecology and evolution of these organisms is unclear. In the context of bacterial motility, nongenetic diversity in swimming behavior was previously linked to diversity in chemotactic performance (8). Our observations that individuality dominates diversity and that behavioral traits are heritable raise the possibility for the nongenetic diversity to act as a substrate for natural selection, for example in gradients of chemoattractants self-generated by collectively migrating bacterial populations (35).
In our study, we focused on quantifying the nongenetic individuality, changeability, and inheritance of bacterial behavior in simple homogeneous environments. It would be interesting to examine how our results apply to more complex settings, such as chemically (35) and physically (36) heterogeneous environments. The main limitation of our experimental approach is that only a small number of bacteria can be reliably tracked in a single microfluidic chamber before the high frequency of crossing events complicates keeping track of the identity of individuals. This makes recording a large number of long-term trajectories under a given experimental condition inefficient and thus precludes assaying a large number of environments. Monitoring the swimming behavior in three, rather than two, spatial dimensions would reduce the frequency of crossings and thus allow maintaining the identity of a much larger number of bacteria for more generations. Measuring the swimming behavior in three dimensions would also minimize the effect of interactions with surfaces, which likely do occur in our experimental setup. The method of holographic microscopy previously used to measure population dynamics (37) could be used for this purpose. Such an approach should make it possible to probe more systematically how different environmental and genetic factors influence the observed patterns of nongenetic individuality, changeability, and heritability.
Conclusion
The key advantage of the experimental and theoretical framework presented here is that it makes minimum assumptions about the behavior of the organism under study and can thus be applied to a large variety of microorganisms, the behavior of which is typically poorly understood. This approach could help answer basic questions regarding the diversity of microbial behavior: How does the dimensionality of the behavioral space grow with microbial species diversity? How does the relative importance of individuality and changeability vary across species with different life histories? To what extent are behavioral traits of different microorganisms heritable? We hope that the general experimental and theoretical framework that we have developed here will encourage and facilitate studies of behavioral diversity in organisms other than E. coli, ultimately leading to a better understanding of the ecology and evolution of microbes.
Materials and Methods
Bacterial Strains, Media, and Culture Preparation.
Experiments were performed with either MG1655 (CGSC #8237) or RP437 (CGSC #12122) obtained from the Coli Genetic Stock Center. Both strains carry different IS5 elements integrated at different positions upstream of the flhD promoter. It was previously shown that integration of different IS elements at different locations upstream of the flhD promoter results in different levels of gene expression, as well as differences in swarming speeds (38). The bacteria were grown in M9 medium containing per 1 L 56.4 g Difco M9 Salts (33.9 g Na2PO4, 15.0 g KPO4, 2.5 g NaCl, and 5.0 g NH4Cl), 2 mL 1 M MgSO4, 100 μL CaCl2, and 0.01% thiamine. The medium was supplemented with either 1% Bacto Casamino acids (Cas), 0.4% glucose (Glu), or 2% glycerol (Gly). The strain RP437 was grown in Cas only, since it is auxotrophic for several amino acids (leucine, histidine, methionine, and threonine). All bacterial cultures were grown at 30 °C with vigorous shaking.
Splitting Trajectories into Segments and Estimating Probability Distributions.
The raw trajectories reconstructed as described in SI Appendix were smoothed using a Gaussian low-pass filter that attenuated high-frequency “wobbling” of bacteria that occurred at frequencies higher than 10 Hz. The trajectories were then split into nonoverlapping segments of a fixed length (180 s). The last segment, in which the division occurs, is shorter than 180 s. In every trajectory segment, we computed the displacement vector at each frame as , where is the two-dimensional position of the bacterium at the respective time point. The linear speed was calculated as , where is the Euclidean norm of and is the time interval between two subsequent frames (20 ms in our experiments). The angular velocity was calculated as the difference in angle between two consecutive displacement vectors, and .
To characterize behavioral states quantitatively, we computed, for each trajectory segment traced by individual during the segment starting at time , a probability distribution of and values observed in the given segment. In computing the distribution, we only included values of and from timepoints at which the bacterium was further than 10 μm away from the wall of the chamber (SI Appendix, Fig. S1B). Only the probability distributions for which more than 1,000 values of and were available were included in the analysis. The vast majority of the omitted segments were those in which the bacterium divides shortly after the start of the segment. The method for computing the probability distributions is described in SI Appendix.
Dimensional Reduction.
To identify principal components in the high-dimensional behavioral space, we employed the method of hierarchical NLPCA (22). NLPCA uses a multilayer feed-forward network called an autoencoder to effectively learn a low-dimensional submanifold embedded in a high-dimensional space. The autoencoder has an input layer and an output layer, both with components. In addition, there are several hidden layers in between, with the middle layer having the fewest components. The hidden layers of the autoencoder use a hyperbolic tangent transfer function, which allows representing nonlinear dependencies between variables. The network learns the structure of a nonlinear submanifold by training its weights to minimize the mean-squared reconstruction error , where is the number of data points (probability distributions corresponding to behavioral states in our case), is the input, and is the reconstructed output. This task is nontrivial because in the process of reconstruction the data have to pass through the middle layer of size , with In other words, an -dimensional representation of the data has to be found, from which it is possible to reconstruct the original -dimensional data with minimal error. Thus, the components of the middle layer are the nonlinear principal components. Additional details on how the dimensional reduction was performed are described in SI Appendix.
Describing the Temporal Aspect of Swimming Behavior.
To describe the changes in behavior occurring over each individual’s lifetime, we express the traits of individual during the segment starting at time as
Here is the mean behavioral state of individual , defined as , where is the number of segments observed for individual . Then, is the temporal trend of individual as a function of time . In our analysis, we assumed the trend to be a polynomial function of time, , where are coefficients of regression obtained by fitting the mean-subtracted traits over time using the ordinary least-squares method. Finally, represents the deviation of the observed traits from the trend, i.e., the residuals from the regression.
Variance Decomposition.
Describing the long-term behavior of an individual as a sum of three terms (mean, trend, and residual) allows us to decompose the total variance of traits:
This equation can be derived as follows. First, we have
where is the total number of individuals, is the number of time segments of individual , and is the mean of all observed behavioral traits. This equation is analogous to the “law of total variances,” where the first term on the right corresponds to the variance of the mean behavioral traits of each individual, and the second term corresponds to the mean of the variances within each individual’s lifetime. Then for each individual, assuming a particular model for the trend of behavioral changes during its lifetime, we can write , where is the trend that results from regression of the mean-subtracted traits over time , and is the residual. It can be shown that, for least-squares regression in general, we have
where and are the means of and , respectively. This equation is essentially the “partitioning of the total sum of squares,” where the first term on the right corresponds to the explained sum of squares, and the second term corresponds to the residual sum of squares. Inserting this equation into the previous one, we have
Dividing all terms by the number of data points, we obtain the decomposition of the total variance. Notably, this decomposition is valid beyond the particular model of the trend (quadratic in this study).
Quantifying Nongenetic Inheritance.
The extent to which traits are inherited across generations was quantified using Pearson correlation coefficient . This correlation was calculated for each experimental condition separately. For the inheritance of trait b1, the correlation coefficient in mother-daughter pairs was calculated as
where and denote, respectively, the mean b1 traits of all mother and daughter bacteria in a given experimental condition. The correlation coefficients for the trait b2 were calculated analogously.
The time-resolved correlations were calculated as
and analogously for the trait b2. Here, and are time indices of mother and daughter trajectory segments, respectively. Note that in calculating this correlation the full trajectories of individual bacteria were split into equal (20) numbers of segments, rather than being split into segments of equal length (as for the rest of the analysis presented in this work). Analogous formulas were used to calculate correlations between daughter–daughter pairs.
Acknowledgements
We acknowledge current and previous members of the Laboratory of Living Matter, as well as Calin Guet and Yuichi Wakamoto, for many discussions and comments on the manuscript. We thank Seppe Kuehn for help in setting up the initial microscopy system. D.J. acknowledges Eric Miska for hosting and accommodating the preparation of this manuscript. This research has been partly supported by grants from the Simons Foundation to S.L. through Rockefeller University Grant 345430 and Institute for Advanced Study Grant 345801. D.J. is supported by the Herchel Smith Fund. M.P. is a Simons Foundation Fellow of the Life Sciences Research Foundation.
Data and Materials Availability
All data needed to evaluate the conclusions in the paper are present in the paper and SI Appendix. Additional data related to this paper, as well as the computer scripts used to perform the analysis, may be requested from the corresponding authors.
References
1
2
3
4
5
6
7
8
9
10
11
12
13
14
15
16
17
18
19
20
21
22
23
25
26
27
28
29
30
31
32
33
34
35
36
37