 Quantifying and visualizing weak interactions between anions and proteins
Proceedings of the National Academy of Sciences of the United States of America


Edited by G. Marius Clore, National Institute of Diabetes and Digestive and Kidney Diseases, Bethesda, MD, and approved November 3, 2020 (received for review July 27, 2020)
Author contributions: J.I. designed research; B.Y. and C.C.P. performed research; B.Y. and J.I. analyzed data; and B.Y. and J.I. wrote the paper.

- Altmetric
Living systems require ions in cellular fluids. These ions electrostatically interact with biological macromolecules and influence their functions. Some ions are attracted to charged protein surfaces, whereas other ions are excluded. Because ion–protein interactions are generally weak and ions dynamically change their locations with respect to proteins, investigations of ion–protein interactions are challenging. It is not well understood how ions behave around proteins and affect their properties. In this work, using unique spectroscopic approaches, we quantified and visualized the weak anion–protein interactions. New knowledge about weak ion–protein interactions may lead to new strategies for protein engineering and drug development.
The molecular properties of proteins are influenced by various ions present in the same solution. While site-specific strong interactions between multivalent metal ions and proteins are well characterized, the behavior of other ions that are only weakly interacting with proteins remains elusive. In the current study, using NMR spectroscopy, we have investigated anion–protein interactions for three proteins that are similar in size but differ in overall charge. Using a unique NMR-based approach, we quantified anions accumulated around the proteins. The determined numbers of anions that are electrostatically attracted to the charged proteins were notably smaller than the overall charge valences and were consistent with predictions from the Poisson–Boltzmann theory. This NMR-based approach also allowed us to measure ionic diffusion and characterize the anions interacting with the positively charged proteins. Our data show that these anions rapidly diffuse while bound to the proteins. Using the same experimental approach, we observed the release of the anions from the protein surface upon the formation of the Antp homeodomain–DNA complex. Using paramagnetic relaxation enhancement (PRE), we visualized the spatial distribution of anions around the free proteins and the Antp homeodomain–DNA complex. The obtained PRE data revealed the localization of anions in the vicinity of the highly positively charged regions of the free Antp homeodomain and provided further evidence of the release of anions from the protein surface upon the protein–DNA association. This study sheds light on the dynamic behavior of anions that electrostatically interact with proteins.
Biological systems involve various inorganic and organic ions. Protein functions are influenced by the surrounding ions not only through the electrostatic screening effect (1), but also through direct interactions at the molecular surfaces (2). Compared to typical protein–ligand interactions, protein–ion interactions are weaker and more transient, yet ions can significantly influence various properties such as solubility, stability, and functional activities of proteins (3). The influences depend on ionic species. For example, when Cl− ions are replaced with glutamate ions in biochemical experiments, some DNA-binding proteins exhibit substantially stronger (>100-fold for some cases) affinity for DNA (4, 5). To understand how ions affect the molecular properties of proteins, the behavior of ions around proteins should be elucidated.
For DNA and RNA, ion-counting methods have greatly advanced experiment-based knowledge of ionic interactions (6, 7). These methods were successfully used to examine and validate theoretical models for ion–nucleic acid interactions (8, 9). However, ion-counting methods do not provide any information about the spatial distribution and dynamic properties of counterions around macromolecules. Even at high resolution in crystal structures, the vast majority of counterions are unresolved, suggesting that they are highly mobile. The dynamic nature of ions causes a major difficulty in studying the interactions between ions and biological macromolecules.
Weak transient interactions of monovalent ions with proteins are particularly difficult to capture by experiments. Unlike nucleic acids that possess a negative charge at every residue, proteins typically contain both positively charged and negatively charged residues as well as many neutral residues. Consequently, proteins possess a far smaller overall charge than nucleic acids of similar molecular size. This implies that the electrostatic attraction of ions to proteins could be intrinsically weaker than that to nucleic acids. Furthermore, local environments around individual charged moieties of proteins are more diverse compared to those of nucleic acids. Although NMR spectroscopy is powerful for investigating various physicochemical properties of proteins (10, 11), there has been a lack of methods suited to quantitatively investigate ion–protein interactions. Experimental studies of weak ion–protein interactions have been challenging (3).
In this work, using unique experimental methods, we study how anions behave in the vicinity of proteins. Our NMR-based approach allows us to determine how many anions are attracted to proteins. Our data show that the number is significantly smaller than the overall charge valence of each positively charged protein. We explain this observation using the concept of the ion atmosphere and theoretical calculations based on the Poisson–Boltzmann equation. Our experimental approach also reveals the diffusional properties of anions interacting with proteins and unravels the release of anions from the protein surface upon protein–DNA association. Furthermore, our solvent paramagnetic relaxation enhancement (PRE) data show how anions are spatially distributed around the protein surface and how their distribution changes when the protein binds to DNA. Our study sheds light on the dynamic behavior of counterions around proteins.
Results
To investigate anion–protein interactions, we used three proteins: the Antp homeodomain (7.9 kDa), bovine pancreatic trypsin inhibitor (BPTI; 6.5 kDa), and ubiquitin (8.6 kDa). These proteins are similar in size but differ in overall charges (Fig. 1A). The amino acid compositions of the proteins are shown in SI Appendix, Fig. S1. The overall charges at pH 7.5 are calculated to be +12e for the Antp homeodomain, +6e for BPTI, and 0e for ubiquitin. We quantified and characterized anions interacting with the proteins. For the Antp homeodomain, we also investigated the release of these anions from the positively charged surfaces upon the formation of a complex with a 15-bp DNA duplex containing an Antp recognition sequence.

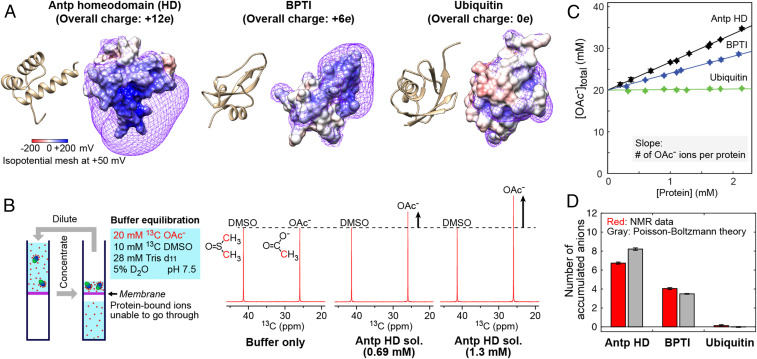
NMR-based quantification of anion accumulation around proteins. (A) Three-dimensional structures and electrostatic potentials of the Antp homeodomain, BPTI, and ubiquitin. The surface electrostatic potentials are color-coded on the molecular surfaces. The violet meshes represent isopotential surfaces of the electrostatic potential at +50 mV. (B) Solutions of the Antp homeodomain, bovine pancreatic trypsin inhibitor (BPTI), and ubiquitin were equilibrated with the buffer at pH 7.5 containing 20 mM methyl-13C-labeled acetate, 28 mM Tris d11, 10 mM 13C DMSO, and 5% D2O. Note that acetate (OAc−) is the only anion in this buffer. Also shown are 1H-decoupled 13C NMR spectra recorded for the original buffer and the Antp homeodomain solutions. Due to the accumulation of anions around the proteins, the total concentration of OAc− ions increases when the concentration of a positively charged protein is raised. (C) Total OAc− concentrations measured for the protein solutions equilibrated as shown in B. The slope corresponds to the number of OAc− ions accumulated around the protein. (D) The number of accumulated anions determined by NMR and the number predicted by the Poisson–Boltzmann theory for the Antp homeodomain, BPTI, and ubiquitin at pH 7.5.
Anion Accumulation Around Proteins.
Using NMR spectroscopy, we investigated the anion accumulation around the proteins in a solution where acetate (OAc−) ions are the only free anions present in the solvent. The protein solutions were equilibrated with a buffer of 20 mM methyl-13C-labeled OAc−, 10 mM 13C dimethyl sulfoxide (DMSO), 28 mM Tris-d11, and 5% D2O. The concentration of Tris-d11 was set to adjust the pH to 7.5. The vast majority (>99%) of acetate (pKa = 4.75) is ionic in this buffer at pH 7.5. When a protein solution is equilibrated with this buffer using a centrifugal filter, ions that are thermodynamically bound to proteins cannot pass through the 3-kDa cutoff membrane whereas free ions and other small compounds can. Consequently, the concentration of OAc− ions in the protein solutions becomes higher than the original concentration in the buffer (i.e., 20 mM) if some anions are electrostatically attracted to the protein. As shown in Fig. 1B, the methyl 13C NMR signal from OAc− was stronger at a higher concentration of the Antp homeodomain. Only one signal from OAc− was observed even for the cases where the OAc− signal intensity was dependent on the protein concentration. This indicates a fast exchange between the OAc− ions in the free and protein-bound states. Using the signal from the two methyl 13C groups of 10 mM 13C DMSO, which is a neutral compound used as an internal control, we quantified the total amount of OAc− ions using integrals of the NMR signals measured for the methyl 13C nuclei of OAc− and DMSO in the Boltzmann equilibrium state. Assuming that the DMSO concentration remained at 10 mM, the OAc− concentration was determined from the ratio of the 13C signal integrals.
Fig. 1C shows the total concentration of OAc− ions measured at various concentrations of the proteins. The total concentration of OAc− ions in the solutions of the Antp homeodomain or BPTI was significantly higher than the original concentration in the buffer and linearly depended on the protein concentrations. The OAc− concentration in the ubiquitin solutions was virtually independent of the protein concentration. These results are qualitatively reasonable because the Antp homeodomain and BPTI are positively charged whereas ubiquitin is neutral. Because OAc− ions are the only anions in the present systems, the slope in the graph shown in Fig. 1C corresponds to the total number of anions accumulated around each protein.
Through linear fitting to the NMR data of Fig. 1C, we determined the number of accumulated anions to be 6.7 ± 0.1 for the Antp homeodomain, 4.1 ± 0.1 for BPTI, and 0.1 ± 0.1 for ubiquitin. Since the overall charge is +12e for the Antp homeodomain and +6e for BPTI, some readers may expect the accumulation of 12 anions around the Antp homeodomain and 6 anions around BPTI. However, our experimental data clearly indicate that this is not the case.
To explain why the number of anions accumulated around a protein is smaller than the overall charge valence of the protein, we introduce the concept of the ion atmosphere that has often been used in research on nucleic acids (7). The ion atmosphere corresponds to the zone where the ion density is higher than the background density due to the ion–macromolecule interactions. To retain the neutrality of the system, the total combined charge of the space containing the ion atmosphere and the protein should be zero as follows:
For nucleic acids, ΔNia(anions) and ΔNia(cations) have been well studied. Herschlag and coworkers studied the ion atmosphere around various DNA and RNA molecules using ion-counting methods (7, 8, 12). They showed that the experimental ΔNia(anions) and ΔNia(cations) data agreed well with those predicted by the Poisson–Boltzmann equation-based theory.
Using the same Poisson–Boltzmann equation-based approach, we examined whether the theoretical approach can accurately predict ion accumulation around proteins. For proteins, charged moieties tend to be highly flexible, and therefore Poisson–Boltzmann calculations from a single structure may not be sufficient to reproduce the experimental data. Therefore, for each system, we generated 100 structures in which the backbone atoms of the original crystal structures were kept fixed while the side-chain conformations were varied through high-temperature dynamics under the influence of the conformational database potentials (13) using the Xplor-NIH software (14), as described in SI Appendix. The structures are shown in SI Appendix, Fig. S2A. The Poisson–Boltzmann equation-based predictions from these structures were as follows: ΔNia(anions) = 8.2 ± 0.3 and ΔNia(cations) = −3.8 ± 0.3 for the Antp homeodomain; ΔNia(anions) = 3.5 ± 0.1 and ΔNia(cations) = −2.5 ± 0.1 for BPTI; and ΔNia(anions) = −0.01 ± 0.1 and ΔNia(cations) = 0.01 ± 0.1 for ubiquitin. The uncertainties in these numbers represent twice the SD for the 100 structures (histograms are shown in SI Appendix, Fig. S2B). Although the total number of side-chain salt bridges was found to vary among these structures, there was no obvious correlation between ΔNia(anions) and the number of salt bridges for each system (SI Appendix, Fig. S2C). In Fig. 1D, the experimentally determined ΔNia(anions) values are compared with the theoretical predictions. Although continuum electrostatic models have often been criticized for the lack of consideration of ion solvation (15, 16), the predictions from the Poisson–Boltzmann equations were consistent with our experimental ΔNia(anions) data.
Compared to nucleic acids, the proteins appear to have a weaker ability to accumulate counterions per charge. Whereas ΔNia(cations)/|n| is 0.80–0.90 for DNA and RNA duplexes at ionic strength < 100 mM (8, 12), our NMR data show that ΔNia(anions)/|n| is 0.56 for the Antp homeodomain and 0.68 for BPTI. The weaker ability to attract counterions is presumably due to the smaller charge density on the molecular surfaces. According to the theory on the preferential interaction coefficients (17), the theoretical lower limit of ΔNia(anions)/|n| is 0.5 for a positively charged protein. This limit can be achieved when ions within and outside the ion atmosphere undergo an ideal Donnan equilibrium due to a low charge density (17). The value of ΔNia(anions)/|n| for the Antp homeodomain is close to this limit. For nucleic acids, due to their large |n| and high charge density, counterions are condensed and their local concentration within the ion atmosphere around the macromolecule can be as high as 1.2 M (18, 19). Manning’s theory for linear polyelectrolytes predicts that the condensation occurs only when the spacing between the charged moieties of the same kind is shorter than the Bjerrum length (7.1 Å in water) (20). Phosphates of DNA and RNA satisfy this criterion. While some basic side chains in the Antp homeodomain (e.g., R28 and R31) and BPTI (e.g., R20 and K46) may satisfy the criterion, other basic side chains do not. It is reasonable that the proteins exhibit a weaker ability to accumulate counterions per charge.
Diffusion of OAc− Ions Around Proteins.
To gain insight into how anions behave in the ion atmosphere, we investigated the diffusional properties of OAc− ions in macromolecular solutions using 1H-detected 13C-selective NMR method. This method implements the bipolar pulse pairs longitudinal encode-decode (BPP-LED) (21), 1H-13C coherence transfer (22), and relaxation filter schemes (SI Appendix, Fig. S3A) and allows for precise measurements of diffusion coefficients of 13C-labeled small molecules in solutions of unlabeled macromolecules (SI Appendix, Fig. S3 B–E). Fig. 2A shows the apparent diffusion coefficients measured for OAc− ions and DMSO (10 mM) in the solutions of the Antp homeodomain, BPTI, or ubiquitin at various concentrations.
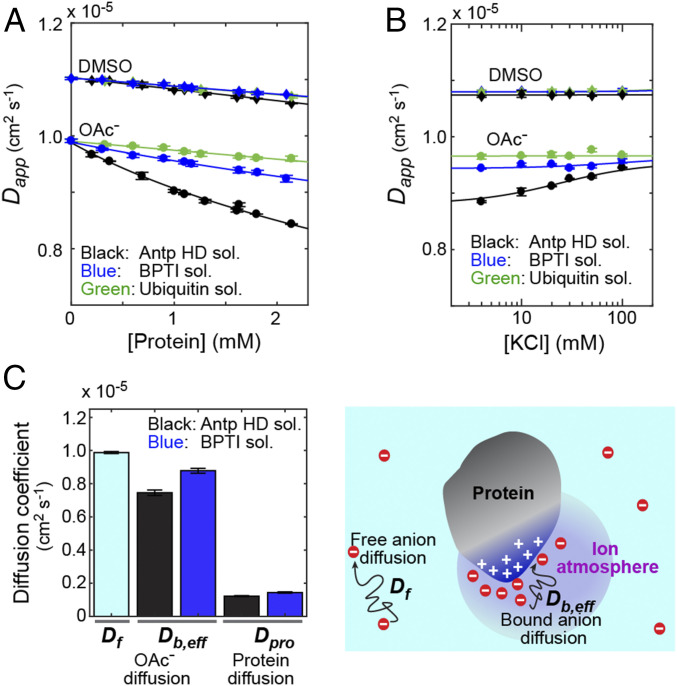
Diffusional properties of OAc− ions around the proteins. (A) Apparent diffusion coefficients of 13C OAc− ions at various concentrations of the Antp homeodomain, ubiquitin, and BPTI. The diffusion coefficients of 10 mM 13C DMSO in the same solutions are also plotted. The same buffer as that for Fig. 1 was used to equilibrate the protein solutions. (B) Data on the ionic competition between OAc− and Cl− ions for the ion atmosphere around the proteins. KCl was added to 1.6 mM protein solutions equilibrated with the buffer shown in Fig. 1B. (C) Diffusion coefficients for free OAc− (Df), bound OAc− (Db,eff), and the protein (Dpro) measured for the Antp HD and BPTI solutions. Db,eff was determined from the Dapp data at various concentrations of the proteins. See SI Appendix for details of the fitting calculations.
The apparent diffusion coefficient of OAc− ions in the Antp homeodomain solutions was considerably smaller at higher concentrations of the protein. This result suggests that the diffusion of OAc− ions within the ion atmosphere around this protein is significantly slower. However, this dependence is partly due to macromolecular crowding because DMSO (10 mM), in all protein solutions, also exhibited a slight decrease in apparent diffusion coefficients upon an increase in the protein concentration (Fig. 2A). We conducted another diffusion experiment to examine whether the decrease in the OAc− diffusion coefficient was largely due to the ion accumulation around the proteins. In this experiment, we added KCl to the protein solutions. If OAc− ions compete with Cl− ions for the ion atmosphere around the protein, some of the OAc− ions must be released from the ion atmosphere upon the addition of Cl−. As shown in Fig. 2B, when KCl was added to the solution of the Antp homeodomain, the apparent diffusion coefficient of OAc− ions increased while that of DMSO remained virtually constant. These results indicate that the strong dependence of the OAc− diffusion coefficient on the concentration of the Antp homeodomain is largely due to the ion accumulation around the protein.
To what extent are the OAc− ions constrained in the ion atmosphere around the protein? To address this question, we analyzed the diffusional properties of the OAc− ions within the ion atmosphere. The complexity of the protein surface and the nonuniform distribution of its positive and negative charges may complicate the diffusional behavior of anions within the ion atmosphere. However, as theoretically demonstrated by Zwanzig, an effective diffusion coefficient can be defined for a system with a rough potential (23). We assumed that such an effective diffusion coefficient can be defined for OAc− ions within the ion atmosphere. Due to the fast exchange of the OAc− ions within and outside the ion atmosphere, the apparent diffusion coefficient (Dapp) is given by the population average of the diffusion coefficient for the anions in the free state (Df) and the effective diffusion coefficient for the anions within the ion atmosphere (Db,eff) as follows (24):
Release of Anions from the Protein upon Binding to DNA.
Our NMR data show that the highly positively charged protein, the Antp homeodomain, accumulates 6.7 anions in its ion atmosphere. This protein is a DNA-binding protein that recognizes the TAATGG sequence. Charge neutralization upon protein-DNA association is known to cause a release of cations from DNA (2526–27). In our recent NMR study using 15NH4+ ions, we showed that the 15-bp DNA duplex containing the Antp recognition sequence releases 10.8 cations when it forms a complex with the Antp homeodomain (28). Does the Antp homeodomain also release the anions from its ion atmosphere upon binding to DNA?
To answer this question, we investigated the impact of protein-DNA association on the apparent diffusion coefficient of OAc− ions. Using a solution of 2.2 mM Antp homeodomain, a solution of 2.8 mM 15-bp DNA, and the buffer used for the equilibration, we prepared 1) a solution of 1.1 mM protein (260 μL protein + 260 μL buffer), 2) a solution of 1.4 mM DNA (260 μL DNA + 260 μL buffer), and 3) a mixture solution of 1.1 mM protein + 1.4 mM DNA (260 μL protein + 260 μL DNA), which forms 1.1 mM protein–DNA complex due to the strong binding affinity. We measured the apparent diffusion coefficients of OAc− ions for the protein solution (DP), DNA solution (DD), and the complex solution (DPD). Since BPTI is positively charged and can nonspecifically interact with DNA (29), we also conducted the same experiments for BPTI. Fig. 3A shows Df – DP*, DPD* – DP*, and DPD* – DD* data, where * denotes the values corrected for the macromolecular crowding effect ( SI Appendix). Individual original and corrected values are shown in SI Appendix, Table S1. Both proteins exhibited Df – DP* > 0 due to anion–protein interactions. Df – DP* was larger for the Antp homeodomain, reflecting its smaller Db,eff coefficient (Fig. 2C) and larger number of accumulated anions. If the proteins release the anions upon protein–DNA association, then DPD* – DP* > 0. As the maximum value of DPD* – DP* is defined by Df – DP*, information about the number of the anions released upon protein–DNA association can be obtained from the relative magnitude of DPD* – DP* with respect to Df – DP* (28). For the Antp homeodomain, DPD* – DP* was as large as Df – DP*, suggesting that the Antp homeodomain released all of the anions in its ion atmosphere when the protein binds to DNA.
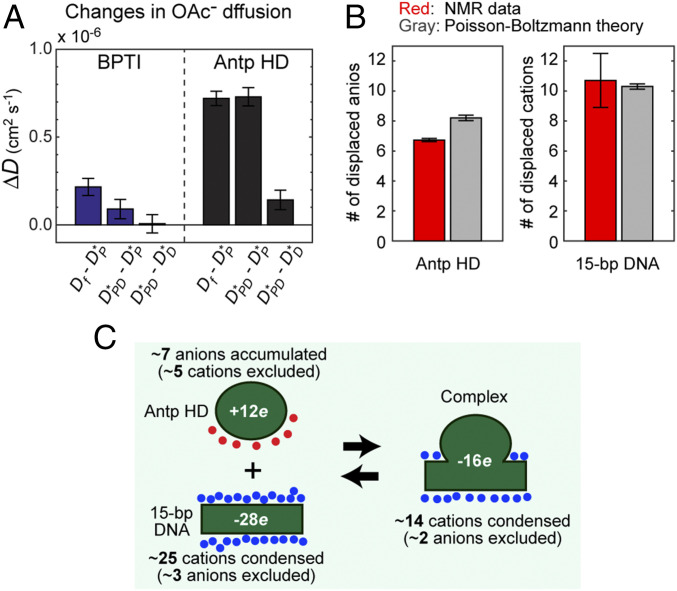
Anion displacement from the protein upon formation of the Antp homeodomain–DNA complex. (A) Impacts of protein-DNA association on the OAc− diffusion. Df is the diffusion coefficient of free OAc− ions. DPD, DP, and DD are the apparent diffusion coefficients of OAc− ions in the protein–DNA complex solution, the protein solution, and the DNA solution. * denotes a value corrected for the macromolecular crowding effect. The original and corrected values of the diffusion coefficients are shown in SI Appendix, Table S1. (B) Numbers of the ions displaced from the protein and DNA upon the formation of the Antp homeodomain–DNA complex. The NMR data for displacement of DNA-bound cations are from Pletka et al. (28). (C) A schematic summary of the findings from our previous (28) and current NMR studies on the counterion accumulation and the coion exclusion for the system of the Antp homeodomain and the 15-bp DNA.
We also compared the experimental results with theoretical prediction. For the complex of the Antp homeodomain and the 15-bp DNA duplex, the aforementioned Poisson–Boltzmann equation-based approach predicted ΔNia(anions) = −4.7 ± 0.3 and ΔNia(cations) = 11.3 ± 0.3. For the Antp homeodomain, the theoretical approach predicted ΔNia(anions) = 8.2 ± 0.3 and ΔNia(cations) = −3.8 ± 0.3. For the 15-bp DNA duplex, the theoretical approach predicted ΔNia(anions) = −6.4 and ΔNia(cations) = 21.6. As shown in Fig. 3B, the theoretical predictions are consistent with the NMR data for the anions displaced from the Antp homeodomain (from the current work) and for the cations displaced from the 15-bp DNA [from our previous work (28)] upon formation of the complex.
Fig. 3C summarizes our findings from our current and previous NMR data about counterion accumulation and coion exclusion for the Antp homeodomain, the 15-bp DNA duplex, and their complex. Previously, for many DNA-binding proteins, thermodynamic studies on the salt concentration dependence of the binding constant Kobs have indirectly estimated the release of counterions upon protein–DNA association (e.g., refs. 4, 30, 31). In this approach, the slope (sK) of the linear relationship between logKobs and log[salt] is given by (19, 32)
However, the entropic impact of the release on the binding free energy may not be as large as one may expect. Based on the diffusion coefficients for free ions (Df) and bound ions (Db,eff), the entropic increase due to the counterion release can be estimated using the theoretical relationship between entropy and diffusion (33): ΔSrelease = kBln(Df/Db,eff) per ion. If Db,eff is small due to strong interactions with a macromolecule, the ions released from the ion atmosphere would gain more entropy, which should consequently increase the affinity for protein–nucleic acid association. Our NMR data for the Antp homeodomain–DNA complex show that ionic diffusion within the ion atmosphere is far more rapid than the diffusion of the macromolecule. The current and previous studies show Df/Db,eff = 1.4 for OAc− ions around the Antp homeodomain and Df/Db,eff = 1.7 for NH4+ ions around the 15-bp DNA duplex. These ratios would be as large as 10 if the ions were tightly bound to the macromolecules. The rapid ionic diffusion within the ion atmosphere should diminish the entropic gain arising from the counterion release.
Spatial Distribution of Anions Around Proteins.
For further investigations of the ion accumulation and exclusion, we also conducted 1H-15N NMR experiments for the Antp homeodomain in the free state and its complex with DNA. We compared NMR spectra recorded for the samples in two different buffers at pH 6.8. In one of the buffers, Cl− ions were the only anions (i.e., 20 mM Tris•HCl, 100 mM KCl, and 5% D2O); and in the other, OAc− ions were the only anions (i.e., 20 mM Tris•acetate, 100 mM KOAc, and 5% D2O). Because the anions are the only difference between these buffers, this comparison allows us to examine the impacts anions have on the protein. As shown in SI Appendix, Fig. S4A, the replacement of Cl− ions with OAc− ions remarkably perturbed 1HN and 15N NMR chemical shifts of the Antp homeodomain in the free state. In contrast, the anion replacement caused virtually no perturbation in the 1HN and 15N chemical shifts for the complex (SI Appendix, Fig. S4B). These results are consistent with the anion accumulation around the Antp homeodomain in the free state and the anion exclusion in the DNA-bound state. However, since NMR chemical shift perturbation reflects both direct and indirect effects of molecular interactions (34), these data do not directly allow us to learn how the anions are spatially distributed within the ion atmosphere surrounding the protein.
To gain more direct information about the spatial distribution of anions, we measured NMR paramagnetic relaxation enhancement (PRE) arising from a paramagnetic analog of OAc−, carboxy-PROXYL (Fig. 4A). This compound is a conjugate of OAc− and a paramagnetic group, 2,2,5,5-tetramethyl-pyrrolidinooxy (PROXYL). Recently, for ubiquitin, Okuno et al. used carboxy-PROXYL and its neutral analog, carbamoyl-PROXYL to observe weak protein–cosolute interactions through PRE measurements (35). This type of PRE, which is conventionally referred to as solvent PRE, occurs through dipole–dipole interactions between the unpaired electrons of the cosolutes and nuclei of a protein (36). In general, protein 1H nuclei near the molecular surface exhibit large PRE arising from paramagnetic cosolutes. If the paramagnetic cosolutes are distributed uniformly around the protein, the PRE profile can be predicted from the protein structure using an empirical approach proposed by Pintacuda and Otting (37) and by Hernández et al. (38) However, for nitroxide compounds involving a tetramethyl moiety (e.g., TEMPOL, PROXYL, and their derivatives), the spatial distribution around a protein is known to be nonuniform and biased due to hydrophobic interactions with apolar patches on protein surfaces (35, 37). A similar bias in the spatial distribution of PROXYL derivatives may also occur on DNA surfaces (39). For the OAc− analog, carboxy-PROXYL, the spatial distribution is expected to be biased due to electrostatic interactions with positively charged protein surfaces as well.
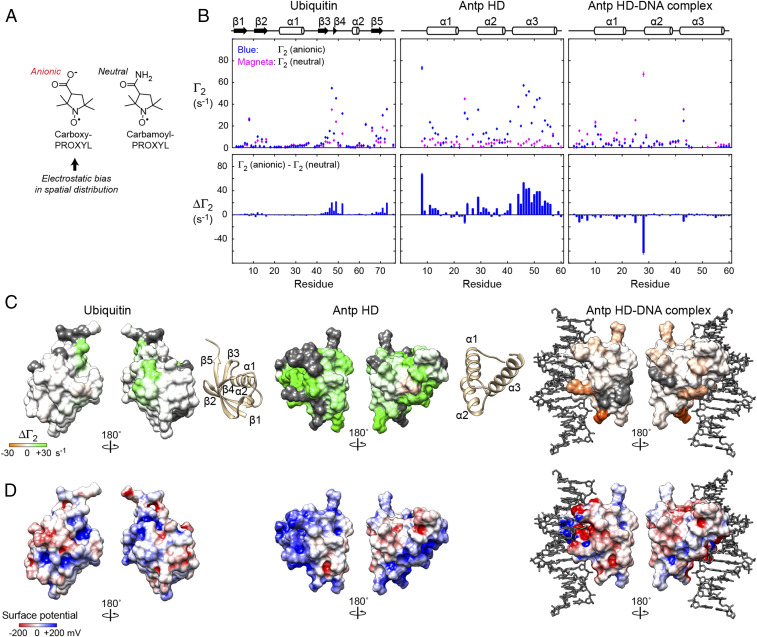
NMR PRE data on the spatial distribution of the anions around the protein surfaces. (A) Chemical structures of carboxy-PROXYL and carbamoyl-PROXYL. The unpaired electrons of the PROXYL moieties cause PRE for protein 1H nuclei. (B) Data of PRE arising from 10 mM paramagnetic cosolute carboxy-PROXYL (anionic) or carbamoyl-PROXYL (neutral) for backbone 1HN nuclei of ubiquitin, the Antp homeodomain, and the Antp homeodomain-DNA complex. The first raw dataset shows the protein backbone 1HN transverse PRE rates Γ2 arising from carboxy-PROXYL or carbamoyl-PROXYL. Also shown are differences (ΔΓ2) between the PRE Γ2 rates for carboxy-PROXYL (anionic) and carbamoyl-PROXYL (neutral) cosolutes. (C) Mapping of the ΔΓ2 data on the protein surfaces for ubiquitin, the Antp homeodomain, and the Antp homeodomain–DNA complex. The magnitudes of positive and negative ΔΓ2 are represented by green and orange color intensities, respectively. The residues that could not be analyzed are shown in gray in this panel. (D) Surface electrostatic potentials for the same molecules.
For the protein backbone 1HN nuclei of ubiquitin, the Antp homeodomain, and the Antp homeodomain-DNA complex at pH 6.8 and 25 °C, we measured transverse PRE rates Γ2 using 10 mM carboxy-PROXYL or 10 mM carbamoyl-PROXYL. Because the buffer equilibration in the manner shown in Fig. 1B would increase the concentration of carboxy-PROXYL due to the anion accumulation, we first prepared the solutions of the proteins and the protein–DNA complex containing no paramagnetic components, and lastly, added the PROXYL compounds dissolved in the same buffer (with pH adjusted to 6.8). This ensures the final concentration of 10 mM. Fig. 4B shows the Γ2 data for ubiquitin, the Antp homeodomain, and the Antp homeodomain-DNA complex. The PRE profiles we observed for ubiquitin were consistent with those observed by Okuno et al., although our Γ2 rates were smaller due to a lower concentration of the paramagnetic cosolutes (i.e., 10 vs. 25 mM). As shown in Fig. 4B, the differences between the Γ2 rates for the carboxy-PROXYL and carbamoyl-PROXYL samples [ΔΓ2 = Γ2 (carboxy-PROXYL) – Γ2 (carbamoyl-PROXY)] were relatively small for ubiquitin. The ΔΓ2 data reflect the bias in the spatial distribution of carboxy-PROXYL due to electrostatic interactions. None of the ubiquitin residues exhibited ΔΓ2 > 20 s−1. In contrast, many residues of the Antp homeodomain exhibited ΔΓ2 > 20 s−1 (Fig. 4B). Due to the long-range nature of PRE (36), many residues can exhibit large ΔΓ2 values if carboxy-PROXYL anions are electrostatically attracted to positively charged regions. The clusters of residues with large ΔΓ2 for the Antp homeodomain are most likely due to this effect. In fact, as shown in Fig. 4 C and D, large positive ΔΓ2 were observed for the residues in the highly positively charged regions of the Antp homeodomain.
The ΔΓ2 data for the Antp homeodomain–DNA complex were strikingly different. Unlike the Antp homeodomain in the free state, the complex exhibited negative ΔΓ2 for the majority of the residues (Fig. 4B). For many residues of the complex, the Γ2 rates for the carboxy-PROXYL sample were smaller than those for the carbamoyl-PROXYL sample, suggesting that carboxy-PROXYL is excluded from the surface of the Antp homeodomain. This is consistent with our aforementioned data on the release of anions from the Antp homeodomain upon formation of the protein–DNA complex (Fig. 3). The release is also understandable based on the surface electrostatic potentials (Fig. 4D). The surface electrostatic potentials of the Antp homeodomain in the complex are largely negative due to the strong influence of negatively charged DNA.
Discussion
In this work, we have provided quantitative information about the behavior of anions around proteins. Our NMR-based methods provide the number of ions accumulated around proteins. The number of the accumulated anions was smaller than that of the overall charge valence. This means that the neutralization of the positively charged proteins is achieved partially by the exclusion of cations from the ion atmosphere. The Poisson–Boltzmann equation-based predictions of the accumulated ions were in good agreement with the experimental data. Our analysis of the protein concentration dependence of the ionic diffusion data showed that the anions interacting with the protein are only loosely constrained and rapidly diffuse within the ion atmosphere. Our NMR-based diffusion data also showed that all of the anions accumulated around the Antp homeodomain are released when the protein binds to DNA. Our current study provides direct evidence of the accumulation of anions around positively charged proteins and the release of these anions upon protein–DNA association.
Our NMR-based approach for quantifying ions has significant advantages over ion-counting methods that have been used for the investigations of ion condensation and exclusion for nucleic acids. The most important advantage is that our NMR-based method can allow us not only to quantify ions accumulated around macromolecules, but also to obtain quantitative information of the ionic diffusion. Other ion-counting methods cannot provide such information. Another advantage is that our NMR-based method can provide information about organic ions, whereas typical ion-counting methods do not.
Our NMR data also provide atomic-level information about the spatial distribution of ions around the macromolecules. The PRE experiments showed that the Antp homeodomain attracts anions to the positively charged regions on the surface of the protein in the free state. The PRE data also provided further evidence that upon binding to DNA, the protein releases the anions due to the strong influence of the highly negatively charged DNA.
It is likely that the findings and methodologies presented in this work are applicable to various other proteins and their molecular association processes. Although we used OAc− and its derivative ions in this work, in principle, essentially the same approach can be used to quantitatively study interactions of proteins with other ions, including some ions of the Hofmeister series. It may be possible to obtain more detailed information about interactions between ions and charged side-chain moieties, particularly due to recent advances in NMR methods for investigating the charged side chains of proteins (11, 40). We expect that further applications of our NMR approach will provide invaluable insight into how ions influence various properties of proteins.
Materials and Methods
Proteins, DNA, and Chemicals.
Unlabeled and 15N-labeled Antp homeodomain proteins were expressed in Escherichia coli and purified as previously described (41). The 15-bp DNA duplex with the sequence of CTCTAATGGCTTTCT (underlined, the Antp recognition site) was chemically synthesized and purified through anion-exchange chromatography as described (41). Unlabeled and 15N-labeled ubiquitins and unlabeled BPTI were purchased from Sigma-Aldrich. Acetic acid-2-13C (99% 13C at the methyl group), DMSO-13C2 (99% 13C), carboxy-PROXYL, and carbamoyl-PROXYL were purchased from Sigma-Aldrich. Deuterated Tris (Tris-d11) dissolved in D2O was purchased from Cambridge Isotope Laboratories.
Solution NMR Experiments on Ion Accumulation and Release.
All NMR experiments were performed at 25 °C using a Bruker Avance III spectrometer equipped with a QCI cryogenic probe operated at the 1H frequency of 600 MHz. Solutions of ubiquitin, BPTI, the Antp homeodomain, and 15-bp DNA were equilibrated with a pH 7.5 buffer of 20 mM methyl-13C-labeled acetate, 28 mM Tris-d11, 10 mM 13C DMSO, and 5% D2O using an Amicon Ultra-4 centrifugal filter with a molecular weight cutoff at 3 kDa (Millipore EMD). Buffer equilibration was conducted through at least four rounds of concentrating the solution to ∼400 μL and 8× dilution with the aforementioned buffer. For each sample, a 520 μl solution was sealed in a 5-mm NMR tube. The total concentration of OAc− ions, which deviated from the original concentration due to the ionic accumulation by the proteins, was measured using the ratio of the integrals of the methyl 13C signal from OAc− to that from DMSO under the assumption that the DMSO concentration remains 10 mM. For the quantification, 1H-decoupled 1D 13C NMR spectra were recorded using a repetition delay of 70 s to allow 13C nuclear magnetizations to reach the Boltzmann equilibrium state. Apparent diffusion coefficients of 13C OAc− ions and 13C DMSO in macromolecular solutions were measured using the NMR pulse sequence shown in SI Appendix, Fig. S3A. Other details of the diffusion measurements are described in SI Appendix. The quantitative data analyses were conducted using the MATLAB software (MathWorks). Quantitative NMR experiments were repeated three times. Error bars for raw data represent SDs for three replicates. Error bars for fitting parameters represent a 95% confidence interval.
PRE Measurements.
PRE rates Γ2 for 1H transverse magnetizations were measured for protein backbone 1HN nuclei of 15N-labeled ubiquitin, 15N-labeled Antp homeodomain, and the complex of 15N-labeled Antp homeodomain and unlabeled 15-bp DNA. The sample concentration was 0.4 mM for each. The NMR experiments for the measurement of PRE rates Γ2 were performed using the two time-point approach (36) with a time difference of 10 ms. For each molecular system, the PRE experiments were conducted with three samples: one without any paramagnetic cosolute (for the diamagnetic control), one with 10 mM carboxy-PROXYL, and the other with 10 mM carbamoyl-PROXYL. To avoid a deviation of the concentration of the paramagnetic compounds due to the ionic accumulation by proteins, the samples were first equilibrated with a pH 6.8 buffer of 20 mM Tris-d11•acetate, 20 mM KCl, and 5% D2O, and then each paramagnetic cosolute was added to the final concentration of 10 mM at the last step. In this process, stock solutions of 20 mM carboxy- or carbamoyl-PROXYL, 20 mM Tris-d11•acetate, 20 mM KCl, 5% D2O at pH 6.8 were used. The spectra were processed with the NMRPipe software (42). Signal intensities were quantified using the NMRFAM-SPARKY software (43).
Poisson–Boltzmann Calculations.
Electrostatic potentials were calculated with the APBS software (44) by numerically solving the nonlinear Poisson–Boltzmann equations. Full-atom models for BPTI, ubiquitin, Antp homeodomain, and Antp-DNA complex were constructed from the crystal structures (Protein Data Bank entries 6PTI, 1UBQ, and 9ANT) using the Xplor-NIH software (14). In this step, hydrogen atoms and other atoms absent in the crystal structures but present in the actual molecules were added to the structure models. The PDB2PQR tool (45) was used to assign charges and radii to individual atoms using the AMBER ff99 force-field parameter set and the protonation states at pH 7.5 predicted with PROPKA3 (46). The grid box used for the APBS calculations was 405 × 405 × 405 Å3 for the Antp homeodomain, ubiquitin, and BPTI. A larger box of 463 × 463 × 463 Å3 was used for the Antp homeodomain-DNA complex. The monovalent ion concentration was set to 20 mM. The ionic radius and the solvent van der Waals radius were set to 2.0 and 1.4 Å, respectively. The dielectric constant of the solvent was set to 78.54 and the internal dielectric constant for the macromolecule was set to 2. The number of ions accumulated around a macromolecule was computed by integrating the excess ion density using (8)
where nA is the Avogadro constant; c is the bulk ion concentration in M; ρ defines ion accessibility in the box with ρ = 1 for accessible regions and ρ = 0 for regions that are inaccessible due to macromolecular atoms; e, the elementary charge; z, the ionic valence; φ, the electrostatic potential; kB, the Boltzmann constant; T, the temperature; and v, the volume (m3). A factor of 1,000 is for the conversion of the volume unit from liters to cubic meters. Subtraction of 1 in the integral corresponds to subtraction of the Boltzmann factor for the background with an electrostatic potential of zero. The integral was calculated with a MATLAB script using the APBS outputs of φ and ρ for the individual grid points. For each structure, ΔNia values were calculated with z = −1 for monovalent anions and z = 1 for monovalent cations.
Acknowledgements
This work was supported by Grant R35-GM130326 (to J.I.) from the NIH. We thank Dr. Montgomery Pettitt and Dr. Chuanying Chen for useful discussions.
Data Availability.
All study data are included in the article and SI Appendix.
References
1
2
3
4
5
6
7
8
9
10
11
12
13
14
15
16
17
18
19
20
21
22
24
25
26
27
28
29
30
31
32
33
34
35
36
37
38
40
41
42
43
44
45