 HIV TAT-mediated microglial senescence: Role of SIRT3-dependent mitochondrial oxidative stress
Redox Biology


- Altmetric
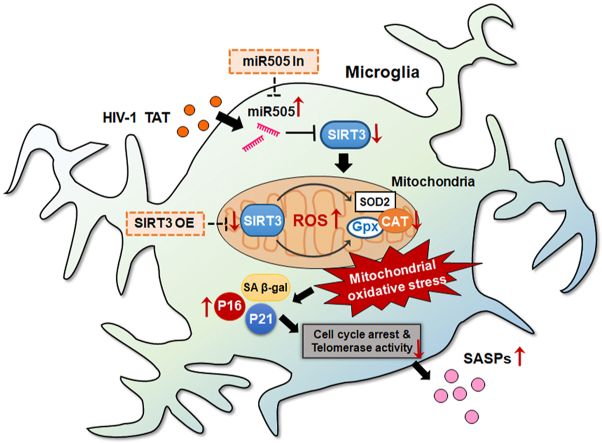
The advent of combined antiretroviral treatment (cART) as a treatment for HIV-1 infection has not only resulted in a dramatic decrease in the peripheral viral load but has also led to increased life expectancy of the infected individuals. Paradoxically, increased lifespan is accompanied with higher prevalence of age-related comorbidities, including HIV-associated neurocognitive disorders (HAND). Present study was aimed at exploring the role of HIV TAT protein in mediating microglial mitochondrial oxidative stress, ultimately resulting in neuroinflammation and microglial senescence. Our findings demonstrated that exposure of mouse primary microglial cells (mPMs) to HIV TAT protein resulted in a senescence-like phenotype, that was characterized by elevated expression of both p16 and p21 proteins, increased numbers of senescence-associated-β-galactosidase positive cells, augmented cell-cycle arrest, increased release of proinflammatory cytokines and decreased telomerase activity. Additionally, exposure of mPMs to HIV TAT also resulted downregulation of SIRT3 with a concomitant increase in mitochondrial oxidative stress. Dual luciferase reporter assay identified miR-505 as a novel target of SIRT3, which was upregulated in mPMs exposed to HIV TAT. Furthermore, transient transfection of mPMs with either the SIRT3 plasmid or miRNA-505 inhibitor upregulated the expression of SIRT3 and mitochondrial antioxidant enzymes, with a concomitant decrease in microglial senescence. These in vitro findings were also validated in the prefrontal cortices and striatum of HIV transgenic rats as well as cART-treated HIV-infected individuals. In summary, this study underscores a yet undiscovered novel mechanism(s) underlying HIV TAT-mediated induction of senescence phenotype in microglia, involving the miR-505-SIRT3 axis-mediated induction of mitochondrial oxidative stress.

•
HIV TAT induces senescence-like phenotype in microglia.
•HIV TAT decreases SIRT3 with concomitant increase of mitochondrial ROS.
•Overexpression of SIRT3 attenuated HIV TAT-mediated microglial senescence.
•miR-505 negatively regulate SIRT3 expression.
•miR-505 inhibition prevents SIRT3-mediated mitochondria stress and glial senescence.
Introduction
The advent of combination antiretroviral therapy (cART) has transformed the face of HIV infection from a progressive, fatal infection to a manageable but chronic disease. As the infected individuals live longer lives, there is also increased risk of developing non-AIDS comorbidity referred to as “premature aging” [[1], [2], [3]]. Factors such as toxicity due to long-term treatment with antiretrovirals coupled with the presence of residual HIV-1 viral protein such as Trans-activator of transcription (TAT), have been implicated as critical contributors of sustained immune activation, neuroinflammation, and cellular senescence, commonly referred to as “inflammaging,” or accelerated aging [[3], [4], [5], [6], [7], [8]]. A major characteristic feature underlying inflammaging is chronic activation of the innate immune system and an inflammatory process, in which the myeloid cells macrophages play a central role [9].
Microglia, the resident macrophages of the brain are immune cells that are continually involved in surveillance of the brain parenchyma, thereby providing the first line of defense against disease-causing pathogenic stimuli [10,11]. Repeated or prolonged exposure of microglia to pathologic stimulus leads to failure of these cells to resolve injury, resulting, in turn, into abnormal, uncontrolled microglial activation and production of proinflammatory factors. This process then culminates into chronic neuroinflammation and ensuing neurodegeneration [12,13]. Intriguingly, chronic persistent activation of microglia has been shown to drive these cells to senescence phenotype, involving up regualtion of a senescence-associated beta-galactosidase (SA β-gal) activity, growth arrest, and more importantly, a distinct senescence-associated secretory phenotypes (SASPs) involving uncontrolled secretion of proinflammatory cytokines, that can exhibit detrimental effects on cells such as the glia and the neurons [14]. Senescence-driven impairment of microglial immune responses and dysfunction have been widely recognized as an essential players in the onset and progression of age-associated neurodegenerative diseases such as Alzheimer's disease, Parkinson's disease, and amyotrophic lateral sclerosis [[14], [15], [16], [17], [18]]. Persistent uncontrolled activation of microglia and microglial immune senescence could thus be a sentinel factor underlying neuro-inflammaging.
Ample in vivo and in vitro studies have demonstrated that microglia are the key CNS cells that are productively infected by HIV-1 and that serve as cellular reservoirs in the brain throughout the life of the infected patients [19,20]. Despite cART therapy, microglial cells potentially contribute to low-level viral replication and release of proinflammatory cytokines such as TNF-α, IL-1β, and IL6 in the CNS [2,21,22]. The presence of Tat has also been implicated in persistent microglial activation, as evidenced by increased release of proinflammatory mediators in both in vitro as well as in vivo models [[23], [24], [25], [26], [27]]. HIV TAT is one of nine HIV-1 proteins, an early regulatory viral protein that is involved in the transcription of HIV-1 and is actively secreted by infected cells following viral entry. HIV TAT is cytotoxic for various CNS cells and is known to impair immunological responses and contribute to the ongoing neuroinflammation in the CNS [[28], [29], [30], [31], [32], [33], [34], [35], [36], [37]]. It has also been shown to play a key role in developing neurocognitive impairment [25,30,38,39] and neurodegeneration associated with Alzheimer's disease [40]. Adding further complexity is that cART therapy does not impact the expression of HIV TAT in the CNS, resulting in persistent accumulation of this protein in the brain, despite the presence of cART [30,41]. It has also been demonstrated that exposure of microglia to HIV TAT resulted in mitochondrial dysfunction as well as accumulation of dysfunctional mitochondria, involving defective mitophagy - a potent contributor of persistent microglial activation and ensuing neuroinflammation [26,42]. Whether HIV TAT could also be involved in driving microglial senescence however, remains unclear and is the focus of the current study.
Mitochondria are small double-membrane organelles that provide energy for cellular functions [43]. Among the complex factors underlying aging, mitochondrial dysfunction has been in the spotlight for a long time and has been reported as a significant determinant of cellular senescence and aging process [[44], [45], [46]]. Recent discoveries have suggested that dysfunctional or damaged mitochondria promote cellular senescence through increased production of reactive oxygen species (ROS), such as superoxide radicals and hydrogen peroxide, which, in turn, irreversibly damage the proteins, lipids, and DNA. Mitochondrial stress or dysfunction thus plays a significant role in aging and age-related diseases [44,[47], [48], [49], [50]].
Sirtuin-3 (SIRT3), NAD+-dependent deacetylase, one of the main sirtuin proteins associated with human longevity, is localized in the mitochondria. SIRT3 regulates and maintains the total mitochondrial energy, oxidative, and antioxidant processes, including the tricarboxylic acid cycle, ketogenesis, antioxidant pathway, oxidative phosphorylation, fatty acid β-oxidation, and respiratory chain via targeting of the enzymes involved in these pathways. Through these actions, SIRT3 regulates the mitochondrial functions while also regulating the fate of the cells and exerts protection against the progression of aging and age-related diseases [[51], [52], [53]]. The role of mitochondrial SIRT3 in HIV-1 associated cellular senescence or premature aging, however, has not yet been explored. Additionally, the regulatory mechanism(s) underlying SIRT3 expression, mitochondrial stress, and microglial senescence in the context of HIV TAT remain poorly understood and form the basis of this study.
In this study we thus sought to assess HIV TAT-mediated microglial senescence using well-accepted senescence markers, including the protein expressions cyclin-dependent kinase inhibitors p16INK4a (p16), p21, SA β-Gal activity, cell cycle arrest and telomerase activity. In addition, the expression of SIRT3, antioxidant enzymes, as well as mitochondrial ROS levels were also evaluated to address the role of mitochondria stress in HIV TAT-mediated microglial senescence.
Materials and methods
Reagents
Antibodies were purchased from the following sources: Rabbit monoclonal anti-p21 (ab109199), Rabbit polyclonal anti-SIRT4 (ab124521), Rabbit polyclonal anti-SOD2/MnSOD (ab13533), Rabbit polyclonal anti-Glutathione Peroxidase 1 (Gpx; ab22604) and Rabbit polyclonal anti-TIMP3 (ab39184) from Abcam, Rabbit polyclonal anti-p16 (10883-1-AP) from Proteintech, Rabbit polyclonal anti-Catalase (CAT; 219010) and Rabbit polyclonal anti-MMP-9 (AB19016) from Millipore Sigma, Rabbit monoclonal anti-SIRT3 (5490S) and Rabbit monoclonal anti-SIRT5 from Cell Signaling, Rabbit polyclonal anti-Iba1 (019–19741) from Wako Pure Chemical Industries, Ltd. Peroxidase-AffiniPure Goat Anti-Rabbit IgG (H + L) (111-035-003) and Peroxidase-conjugated AffiniPure Goat Anti-Mouse IgG (H + L) (115-035-003) from Jackson ImmunoResearch Inc. The endotoxin-free, recombinant HIV TAT protein (1032–10) was purchased from ImmunoDX. TaqMan® miRNA Reverse Transcription Kit (4366596), TaqMan® miRNA assays for miRNA-505–3p (4427975), TaqMan™ miRNA Control Assay – U6 snRNA (4427975), and TaqMan® Universal PCR Master Mix, no AmpErase® UNG (4324018) were obtained from Applied Biosystems. miRNA-505–3p mimic (MC11678), miRNA-505–3p inhibitor (MH11678), miRNA mimic negative control (4464061) and miRNA inhibitor, negative control (4464076) were purchased from ThermoFisher Scientific. Opti-MEM® I Reduced Serum Media (31985070) and Lipofectamine™ RNAiMAX transfection reagent (13778150) were obtained from Life Technologies.
Animals
HIV-1 transgenic rats were produced using a non-infectious provirus expressing 7 of the 9 HIV-1 viral proteins including Tat, Env, Rev, Nef, Vif, Vpr, and Vpu [54]. 15 months old, male, HIV transgenic rats (HIV-1, F344) and the corresponding age, sex, background-matched wild type rats were used in this study (n = 3/group). The animals were group-housed in clean polypropylene cages under conditions of constant temperature with related humidity and 12/12 h day-night cycle, during which time they had free access to food and water ad libitum. Animal care and the experimental procedures involving animals were approved by the University of Nebraska Medical Center (Protocol #18-030-04-FC) and the National Institutes of Health. The animals were killed by isoflurane overdose followed by transcardial perfusion with ice-cold PBS to remove blood. The brain was dissected out, and the brain regions, including medial prefrontal cortical regions, striatum were separated and stored at −80 °C for further experiments.
Mouse primary microglia (mPMs) isolation
Pregnant C57BL/6 mice were purchased from Charles River Laboratories (Wilmington, MA USA) for mouse primary microglial isolation. Mixed mouse primary glia cultures were prepared from the cerebral cortices of 1- to 3-day old C57BL/6 newborn pups as described earlier [55,56]. Briefly, cerebral cortices from newborn mice were dissected out and freed of blood vessels and meninges. Subsequently, the cerebral cortices were minced and subjected to mild trypsinization using 0.25% trypsin (Invitrogen, 25300–054). The mixed culture of cerebral cells freed of undigested tissue cluster were obtained by triturating and passing through a 40 μm nylon mesh. The filtrate containing cell were centrifuged and the pellet obtained was resuspended in Dulbecco modified Eagle medium (DMEM; Corning Cellgro®, 10-013-CV) supplemented with 10% fetal bovine serum (FBS; Atlanta Biologicals, S11150H), Penicillin (100 U/ml)/Streptomycin (100 μg/ml) (Gibco, 15140122) and 0.25 ng/ml of macrophage colony-stimulating factor (Millipore Sigma, GF026). Then 2 × 10⁷ cells were added to 75 cm2 culture flasks containing 20 mL culture medium and were cultured in a humidified incubator under the condition of 37 °C and 5% CO2. On third day, the whole media was replaced with fresh culture media followed by 5–10 ml of culture medium was added every 3 days. Once the mixed glial cultures had attained 85% confluence (approximately 12–14 days), the flask containing mixed glial culture was shacked at 220 g for 2 h at 37 °C, for detachment of all microglia cells from the astrocytic bed. The culture media containing detached microglia were centrifuged and pellet was resuspended in culture media. Cells were plated in either 6 or 12 or 24 well plates and placed in incubator for adherence of microglia cells to the bottom for further experiments.
Human brain tissues
HIV -ve, HIV +ve patients’ brain tissues were obtained from the UNMC PEN Brain Banking for Study of Neurologic Diseases (IRB: 056–00-FB). Patient clinical characteristics are provided in Table 1.

| S. No. | Case number | HIV infection | Age | Gender | Race | Pathologies |
|---|---|---|---|---|---|---|
| 1. | 99–113 | Negative | 66 | Male | Caucasian | Massive pulmonary consolidation secondary to diffuse alveolar damage (ARDS). Cryptogenic cirrhosis complicated with portal hn, upper GI bleed due to ulcers, hepatic encephalopathy, corpulmonate, chronic renal failure. |
| 2. | 99–114 | Negative | 58 | Female | Caucasian | End-stage liver disease secondary to non-alcoholic steatohepatitis |
| 3. | 99–132 | Negative | 55 | Male | Caucasian | Sudden Cardiac death in a setting of moderate-severe coronary artery disease |
| 4. | 96–100 | HIV +ve | 55 | Male | Caucasian | Cortical brain thrombosis. Intracerebral hemorrh. And necrosis. AIDS |
| 5. | 96–102 | HIV +ve | 35 | Male | Caucasian | Atypical leptomeningeal lymphocytosis, consistent with non-hodgkins lymphoma, small cell type. Cause: AIDS |
| 6. | 96–103 | HIV +ve | 54 | Male | Caucasian | Cause of death is AIDS. No pathologic alterations found in brain |
| 7. | 95–100 | HIVE | 38 | Male | Caucasian | HIV Encephalopathy/Leukoencephalopathy. No evidence of toxoplasma infection or progressive multifocal leukoencephalopathy. AIDS |
| 8. | 95–101 | HIVE | 36 | Male | Caucasian | Cytomegalovirus (CMV) Encephalitis. End stage AIDS Mild dementia, opportunistic infections. |
| 9. | 98–120 | HIVE | 52 | Male | Caucasian | Atherosclerosis and HIV Encephalopathy |
SA β-gal staining
SA β-gal activity was evaluated in mPMs using SA-β-gal staining kit (Cell Signaling Technology; 9860S) according to the manufacturer's instruction. Briefly, mPMs exposed to HIV TAT (7 nM) for 48 h or unexposed control cells were fixed onto coverslip with 4% formaldehyde for 15 min and stained overnight using SA β-gal as substrate. SA β-gal activity positive cells appear as blue color and images were acquired on a Zeiss Observer using a Z1 inverted microscope (Carl Zeiss, Thornwood, NY, USA). The positive (blue) and negative cells were counted using ImageJ software. At least six images per condition and 200 cells were counted per images, in triplicate and graphed.
Telomerase activity assay
The telomerase activity was measured in mPMs exposed with HIV TAT using TRAPeze® Telomerase Detection Kit (EMD Millipore; S7700) according to the manufacturer's instructions. Briefly, the mPMs were seeded into 6-well plates (5 × 10⁵ cells per well) followed by either exposed to HIV TAT or heat inactivated HIV TAT or unexposed control for 48 h. Then, cultured cell pellets were lysed with 1 × CHAPS lysis buffer for 30 min on ice and centrifuged at 12,000 g for 20 min. The protein concentration was quantified and 500 ng of cell lysates was used for the assay which includes two-steps: (i) In first step the cell lysates were incubated for 30 min at room temperature with TS primer for telomerase-mediated extension of an oligonucleotide. Next, the reaction products were amplified using PCR for 30 cycles in the presence of 10X TRAP Reaction Buffer (5 μl), 50X dNTP Mix (1 μl), TS Primer (1 μl), TRAP Primer Mix (1.0 μl) and Taq Polymerase (5 units/μl; 0.4 μl). The final reaction products were running on a 10% polyacrylamide gel for generating a ladder of products with 6 base increments starting at 50 nucleotides: 50, 56, 62, 68, etc. The images were acquired using Kodak Gel logic 212 Imaging System (GL 212). Since, telomerase is a heat-sensitive enzyme, heat inactivated samples were used as a negative control. Telomerase-positive cell extract (2μl/ reaction) and TSR8 (Control Template) instead of sample extract were used as positive control.
Cell cycle analysis
The cell cycle analysis was performed using Flow cytometry. MPMs were seeded into 6-well plate at a density of 5 × 10⁵ cells/well and cultured in a humidified, 5% CO2 incubator at 37 °C. Followed by overnight starvation, the cells were exposed with HIV TAT (7 nM) for 48 h. Next, the cells were washed with PBS and subjected to mild trypsinization for detachment from the bottom. The cells pellet was obtained by centrifugation. The cells were fixed with 70% ethanol for 24 h at 4 °C, followed by propidium iodide (PI) staining, with 50 μg/ml PI solution and 100 μg/ml RNase A in PBS. The FACS Calibur system was used to analyze samples with flow cytometer. All collected data were analyzed with FlowJo software (TreeStar Inc., OR, USA). All the experiments were repeated six times.
Proinflammatory cytokine assays
MPMs were seeded onto 96-well plates (8000 cells/well) overnight, and subsequently exposed to HIV TAT, or transfected with SIRT3 plasmid or miR-505 mimic/inhibitor or left untreated. Supernatant fluids were collected at 48 h post-HIV TAT treatment, followed by quantification of proinflammatory cytokines such as IL-1β (MLB00C), TNF-α (MTA00B) and IL-6 (M6000B) by ELISA according to the manufacturer's instructions (R&D, Minneapolis, USA).
Mitochondrial superoxide production
The level of mitochondrial-derived superoxide radicals in the mPMs exposed to HIV TAT was monitored using the MitoSOX™ Red dye (Invitrogen; M36008) according to the manufacturer's instructions. Briefly, MitoSOX™ Red reagent permeates live cells where it selectively targets mitochondria and is rapidly oxidized by superoxide, but not by other ROS or reactive nitrogen species. Oxidation of MitoSOX™ Red reagent by superoxide produces red fluorescence that is visualized by microscopy. Herein, mPMs seeded on sterile glass coverslips (11 mm) placed in a 24-well plate at a density of 5 × 10⁴ cells per well and exposed to HIV TAT (7 nM) for 48 h. Followed by the cells were washed with 1x PBS and incubated with MitoSOX™ Red dye (5 μM) for 15 min at 37 °C. After staining, the cells were washed and fluorescent images were acquired on a Zeiss Observer using a Z1 inverted microscope (Carl Zeiss, Thornwood, NY, USA). As a precaution, images were acquired within 10–20 min, since MitoSOX tends to accumulate in the nucleus after approximately 40 min [57]. All the experiments were repeated six times.
Superoxide dismutase-2 (SOD2) activity assay
MPMs were seeded into 6-well plates (5 × 10⁵ cells per well) followed by either exposed to HIV TAT or heat inactivated HIV TAT or unexposed control for 48 h. Mitochondrial fraction was isolated from the cytosolic fraction using the Mitochondria/Cytosol Fractionation Kit (Bio Vision, Mountain View, CA; Cat No K256). The amount of proteins was estimated using a commercially available Pierce™ BCA Protein Assay Kit (Thermo Fisher Scientific, 23227) according to the manufacturer's guidelines. The SOD activity was determined using superoxide dismutase activity assay kit (Abcam; ab65354). Relative SOD activity was normalized by protein amount and shown as ratio to 100% which is the SOD activity in control cells.
SIRT3 overexpression
MPMs were seeded in 6 well at a density of 5 × 10⁵ cells per well and 24-well plate containing sterile glass coverslips at a density of 1 × 10⁵ cells per well at 37 °C in a humidified, 5% CO2 incubator. Cells were transfected with the plasmid mSIRT3-L, a gift from Michael Sack (Addgene plasmid # 33309; http://n2t.net/addgene:33309; RRID:Addgene_33309) or pcDNA3.1 vector alone using Lipofectamine® 2000 Reagent according to the manufacturer's protocol. After 6–8 h, the culture medium was replaced with DMEM supplemented with 10% heat-inactivated FBS. After 24 h, transfected mouse primary microglia were then exposed to HIV TAT (7 nM) for 48 h. Total RNA and proteins were extracted from the cultured cells for further investigation and overexpression efficiency was analyzed by western blotting of anti-SIRT3 and anti-FLAG antibodies.
TaqMan® miRNA assays
The expression of miRNA-505 was quantified using TaqMan® miRNA assays as described earlier [39]. Briefly, the total RNA was extracted using Quick-RNA™ MiniPrep Plus (Zymo Research, R1058) as per the manufacturer's protocol and quantified using Thermo Scientific NanoDrop™ 8000 spectrophotometer. Subsequently, cDNA for specific miRNA was synthesized by reverse transcription using specific miRNA primers from the TaqMan® miRNA assays and the TaqMan® miRNA Reverse Transcription kit. Then the obtained cDNA was used for the real time expression of specific miRNA using Taqman qPCR master mix (Applied Biosystems, 43024018) and Applied Biosystems® QuantStudio™ 3 Real-Time PCR System (Applied Biosystems, Grand Island, NY). Each PCR reaction was carried out in triplicate, and six independent experiments were run. The expression level of miRNA-505 was normalized with U6 snRNA.
Transient transfection of miRNA-505 mimic/inhibitor
MPMs were seeded into 6-well plates (5 × 10⁵ cells per well) and were transiently transfected with 30 pmol of either miRNA-505 mimic or miRNA-505 inhibitor or miRNA control using Lipofectamine™ RNAiMAX as described. After 6–8 h the culture medium was replaced with DMEM and transfected mPMs were exposed to HIV TAT (7 nM) for 48 h. Total RNA and proteins were extracted for further investigation and transfection efficiency was analyzed by real time PCR as indicated earlier.
Western blotting
At the end of each experiment set up, mPMs were washed with PBS and cell lysate was prepared using RIPA buffer supplemented with Protease Inhibitor Cocktail (Thermo Fisher Scientific, 78429) and Phosphatase Inhibitor Cocktail (Thermo Fisher Scientific, 78426). Cell lysates were sonicated and centrifuged at 12000 g for 15 min at 4 °C. The protein concentration of supernatant thus obtained was estimated using a commercially available Pierce™ BCA Protein Assay Kit (Thermo Fisher Scientific, 23227) according to the manufacturer's guidelines. Subsequently, the protein expression of each proteins such as p16 (1:2000), p21 (1:2000), SIRT3 (1:1000), SIRT4 (1:1000), SIRT5 (1:1000), SOD2 (1:1000), CAT (1:1000), Gpx (1:1000), IL-1β (1:1000), MMP-9 (1:1000) and TIMP-3 (1:1000) were analyzed using immunoblotting. Briefly, equal amounts of soluble proteins (10 μg) were resolved using 10% or 15% sodium dodecyl sulfate-polyacrylamide gel electrophoresis following that the separated proteins were transferred onto a polyvinylidene fluoride membrane using Bio-Rad wet blot transfer unit. Subsequently, the membranes were blocked with 5% non-fat dry milk in 1 × TTBS buffer (pH 7.5) for 1 h at room temperature and incubated for overnight with the specific primary antibody at 4 °C. Next day, the membranes were incubated with secondary antibody specific to primary antibody for 1 h at room temperature followed by exposed with Super Signal West Chemiluminescent Substrates (Thermo Fisher Scientific, 34078) and immunoreactive bands captured using FluorChem M System supplied by Protein simple. ACTB (actin beta; 1:5000) was used as an internal control. The intensity of each band was quantified using ImageJ analysis software [58] and the data are presented as a relative fold change.
Immunocytochemistry
MPMs were seeded at a density of 1 × 10⁵ cells/well in a 12-well plate containing sterile glass coverslips. Then the plates were cultured for 24 h and culture medium was replaced with Opti-MEM® I Reduced Serum Medium (Life Technologies, 31985070) followed by cells were transfected with the pLV-mitoDsRed plasmid (a gift from Prof. Pantelis Tsoulfas; Addgene plasmid # 44386) [59] using Lipofectamine® 2000 Reagent (Invitrogen, 12566014) according to the manufacturer's protocol. For successful transfection the cells were cultured for 6–8 h and culture medium was replaced with DMEM and exposed to HIV TAT (7 nM) for 48 h. Followed by immunocytochemistry was performed for SIRT3 protein. Briefly, media was removed and cells were washed with phosphate buffered saline (PBS; Hyclone Laboratories, SH3025801), fixed in 4% paraformaldehyde, permeabilized with PBS containing 0.1% Triton-X 100, 0.1% BSA and blocked in 1.5% goat serum in PBS for 1 h. Subsequently, incubated with SIRT3 (1:250) primary antibody for overnight in blocking buffer at 4 °C. Secondary Alexa Fluor 488 goat anti-rabbit IgG (Invitrogen, A-11008; 1:500) was added for 2 h, followed by mounting with ProLong Gold Antifade Reagent with DAPI. For every step the cells were washed with PBS for three times. Fluorescent images were taken on a Zeiss Observer using a Z1 inverted microscope (Carl Zeiss, Thornwood, NY, USA) and the acquired images were analyzed for co-localization of red and green puncta using the Axio Vs 40 Version 4.8.0.0 software (Carl Zeiss MicroImaging GmbH). All experiments were repeated at least three times.
Immunohistochemistry
The paraffin-embedded brain tissue sections from wild-type (WT) and HIV Tg rats were baked overnight at 55 °C followed by deparaffinized in xylene and rehydrated in a graded series (100%, 95% & 70%) of alcohol. Next, the slides were washed with PBS and incubated in boiled Tris/EDTA buffer (pH 9) for about 20 min for efficient antigen retrieval. Then, the slides were blocked for 2 h at room temperature using 10% goat serum followed by exposed to respective primary antibodies, such as anti-p16 (1:100) or anti-p21 (1:100) and microglial marker anti-Iba at 4 °C for overnight. Secondary Alexa Fluor 488 goat anti-rabbit IgG (Invitrogen, A-11008; 1:500) or Alexa Fluor 594 goat anti-mouse (Invitrogen, A-11032; 1:500) was added for 2 h, followed by mounting with ProLong Gold Antifade Reagent with DAPI. Fluorescent images were taken on a Zeiss Observer using a Z1 inverted microscope (Carl Zeiss, Thornwood, NY, USA) and the acquired images were analyzed for co-localization of red and green puncta using the Axio Vs 40 Version 4.8.0.0 software (Carl Zeiss MicroImaging GmbH). All experiments were repeated at least three times.
Dual luciferase reporter assays
The luciferase reporter assay used to validate the 3′-untranslated region (3′-UTR) binding site of SIRT3 with miR-505–3p. Briefly, the HEK293T cells were seeded into 96-well plates and co-transfected with either target plasmids, such as pmirGLO-SIRT3 3′-UTR-miR-505-target or pmirGLO-SIRT3 3′-UTR-miR-505-target-mutant and miR-505 mimic/miR control in a molar ratio 10:1. Oligonucleotides used for preparing pmirGLO-target plasmids are as follows: mouse SIRT3 UTR sense 5′ AAACTAGCGGCCG CTAGTGTGAGTGTTGACAAAT 3′, mouse SIRT3 UTR antisense 5′ CTAGATTTGTCA ACACTCACACTAGCGGCCGCTAGTTT 3′, Mouse SIRT3 UTR mismatch sense 5′ AAACTAGCGGCCGCTAGTGTGAGCACGAGTGAAT 3′ Mouse SIRT3 UTR mismatch antisense, 5′ CTAGATTCACTCGTGCTCACACTAGCGGCCGCTAGTTT 3′. The luciferase activity was determined 24 h post transfection, and the reporter assay was performed according to the manufacturer's protocol (Promega; E1910). Renilla luciferase activity was normalized to firefly luciferase and expressed as a percentage of the control.
Statistical analysis
The values are expressed as mean ± SEM. The statistical significance between all the groups was assessed by Kruskal-Wallis non-parametric test or Student t-test for between 2 groups using GraphPad Prism software version 6.01 (GraphPad Software, Inc.). If ANOVA yielded significant results, post hoc testing was performed for inter-group comparisons (between two groups) using Dunn's multiple comparison test. Values were considered statistically significant when P < 0.05.
Results
HIV TAT-mediated induction of SASPs in MPMs
Herein we first sought to explore the induction of SASPs in mPMs exposed to HIV TAT protein. Cells were exposed to varying concentrations of HIV TAT (1.7, 3.5, 7, 14 nM) as well as heat inactivated HIV TAT for 24 h and, cell lysates assessed for the expression of two well-known senescence markers - p16, a cyclin-dependent kinase inhibitor 2A (also referred to as p16ink4a) as well as cyclin-dependent kinase inhibitor p21. As shown in Fig. 1A and B, the expression of both the p16 and p21 were dose-dependently upregulated in mPMs exposed to HIV TAT for 24 h, with the levels significantly (P < 0.05) increased in cells exposed to HIV TAT concentrations of 7 and 14 nM. As expected, there was no significant change in p16 or p21 proteins in mPMs exposed to heat inactivated HIV TAT compared to control cells. Thus, 7 nM of HIV TAT was chosen for all the ensuing experiments. We next sought to assess HIV TAT-mediated induction of SASPs in mPMs. For this mPMs were exposed to 7 nM HIV TAT for varying time points (0, 3, 6, 12, 24 and 48 h) and lysates assessed for the expression of p16 and p21. As shown in Fig. 1C and D, expression of both p16 and p21 were time-dependently upregulated in mPMs exposed to HIV TAT, with significant increase at 24 and 48 h time points compared to cells not exposed to HIV TAT. Based on these findings, the next set of experiments were done using exposure of mPMs to HIV TAT (7 nM for 48 h).
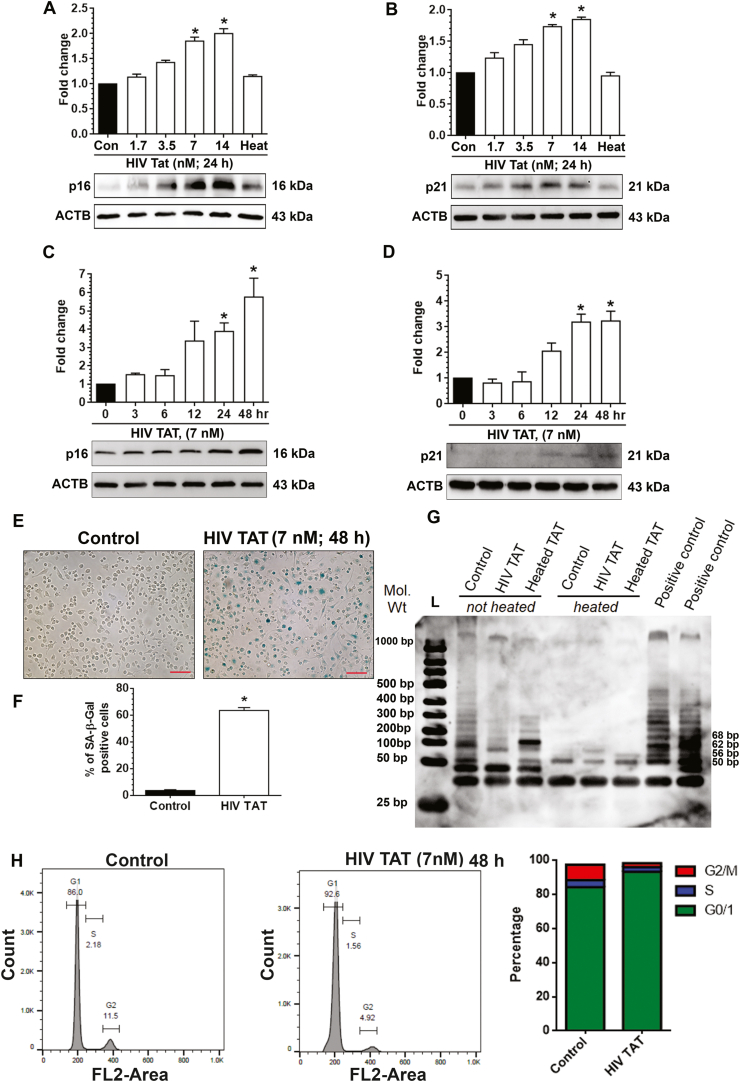
HIV TAT induces senescence in mouse primary microgliacells (mPMs). (A–B) HIV TAT dose-dependently upregulated the protein levels of senescence markers such as p16 (A) and p21 (B) in mPMs. (C–D) HIV TAT time-dependently upregulated the protein levels of senescence markers such as p16 (C) and p21 (D) in mPMs. ACTB was probed as a protein loading control for all experiments. Non-parametric Kruskal-Wallis One-way ANOVA followed by Dunn's post hoc test was used to determine the statistical significance of multiple groups. (E) Representative images showing the SA-β-gal activity (blue color positive cells) in mPMs. Scale bar: 10 μm. (F) Quantification of SA-β-gal positive mPMs exposed to HIV TAT for 48 h and unexposed control mPMS. (G) Gel image showing telomerase activity in mPMs includes control, HIV TAT (7 nM), heated HIV TAT and positive controls (telomerase containing cell extract and TSP8 primer) using PCR-based TRAP assay. L: ladder. The telomerase signal is visualized as a ladder. Negative controls consisted of heat-inactivated cell extract. The number of PCR cycles was 30. (H) Cell cycle analysis by flowcytometry in mPMs exposed to HIV TAT and unexposed control mPMs. The data are presented as mean ± SEM from six independent experiments. An unpaired Student t-test was used to determine the statistical significance. *, P < 0.05 vs. control. (For interpretation of the references to color in this figure legend, the reader is referred to the Web version of this article.)
We next sought to the assess expression of other senescence markers, such as, SA β-gal activity, telomerase activity, and cell cycle analysis. Cells exposed to HIV TAT (7 nM) for 48 h were stained for SA β-gal activity. As shown in Fig. 1E and F, there was a significantly (P < 0.05) higher percentage of cells exhibiting SA β-gal activity in the presence of HIV TAT compared with the control cells. Additionally, there was also a significant decrease in telomerase activity in mPMs exposed to HIV TAT compared to control cells (Fig. 1G). Exposure of mPMs to heat-inactivated HIV TAT failed to demonstrate the downregulation of telomerase activity (Fig. 1G). We also observed a significant increase in the number of cells arrested in the G0/G1 phase of cell cycle (92.7 ± 1.91; Fig. 1H), in the presence of HIV TAT compared to control cells (86.0 ± 1.99). Furthermore, we also assessed the expression of proinflammatory cytokines released in the supernatant fluids of mPMs exposed to HIV TAT or in control cells, using ELISA. As shown in Supplementary Fig. 1A–C, there was increased expression of proinflammatory cytokines (TNF-α, IL1β, and IL-6) in the supernatants of mPMs exposed to HIV TAT compared to those collected from control cells. Additionally, we also analyzed the expression of matrix metalloproteinase (MMPs) such as MMP-9, and tissue inhibitor of metalloproteinase (TIMP)-3 in mPMs exposed to HIV Tat (7 nM for 48 h). As shown in Supplementary Fig. 1D and 1E, exposure of mPMs to HIV TAT resulted in significant (P > 0.05) increase in the expression of both MMP-9 (Sup. Fig. 1D) and TIMP-3 (Sup. Fig. 1E), compared with control mPMs not exposed to HIV TAT.
HIV TAT mediated induction of microglial SASPs in vivo
We next sought to validate our in vitro findings in the brain lysates from the prefrontal cortices and striatal regions of 15-month-old male HIV Tg rats as well as age-matched wild-type (WT) controls. As shown in Fig. 2A-D, expression of both p16 and p21 was significantly upregulated in the prefrontal cortices (Fig. 2A and B) and striatum (Fig. 2C and D) of HIV Tg rats compared to expression in the same regions of WT controls. These findings were further confirmed by double immunohistochemical co-localization of p16 or p21 with the microglia specific marker Iba1 in prefrontal cortical sections of HIV Tg and WT rats. As shown in Fig. 2E-H the intensity of both p16 (Fig. 2E and F) and p21 (Fig. 2G and H) were were significantly (P < 0.05) increased in Iba1+ microglia (co-localization with p16 or p21) in the prefrontal cortical sections of HIV Tg rats compared with the WT controls. Furthermore, we also determined the expression of mature IL1β in the prefrontal cortices and striatum of HIV Tg and WT rats by western blotting. As shown in Supplementary Fig. 1F and 1G, mature IL1β protein level was significantly (P < 0.05) increased in the prefrontal cortices (Sup. Fig. 1F) and striatal (Sup. Fig. 1G) lysates from HIV Tg rats compared to those from the WT controls.
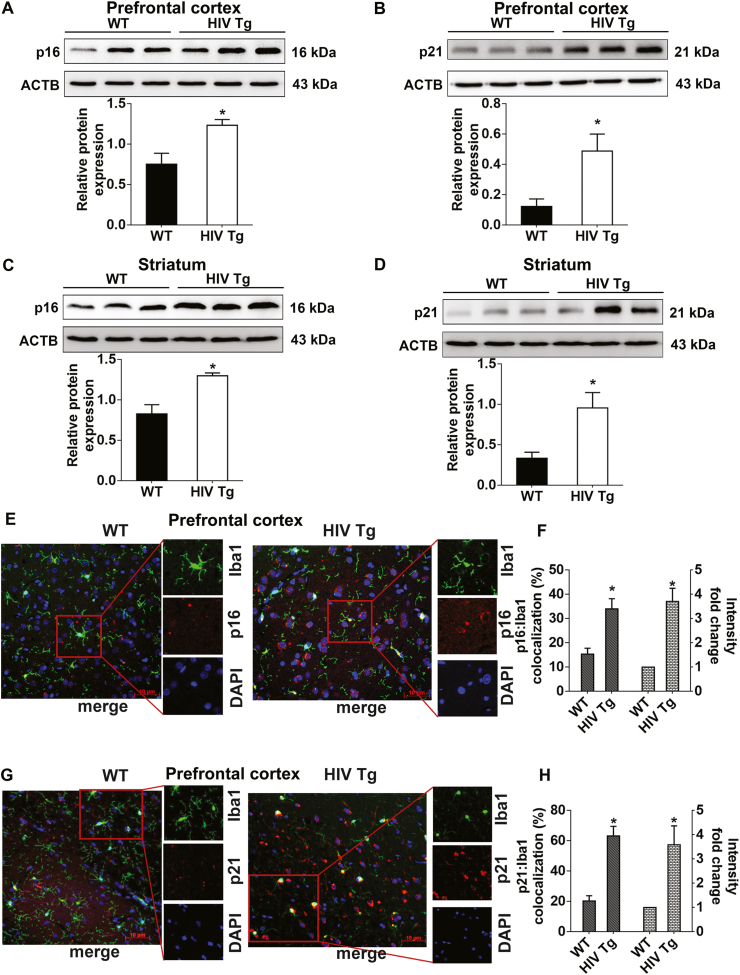
HIV TAT induces senescence in microglial cells in vivo. (A–D) Representative western blots showing the protein expression levels of p16 (A) and p21 (B) in the prefrontal cortex and p16 (C) and p21 (D) in the striatum of wild type and HIV Tg rats (n = 3). ACTB was probed as a protein loading control for all experiments. (E) Immunofluorescence staining for p16 (red), iba1, microglial activation marker (green), and DAPI (blue) from prefrontal cortex area of wild type and HIV Tg rats. (F) Quantification of graph showing the percentage of p16 and Iba1 colocalization and intensity of p16 from prefrontal cortex immunofluorescence image of wild type and HIV Tg rats. (G) Immunofluorescence staining for p21 (red), iba1, microglial activation marker (green), and DAPI (blue) from prefrontal cortex area of wild type and HIV Tg rats. (H) Quantification of graph showing the percentage of p21 and Iba1 colocalization and intensity of p21 from prefrontal cortex immunofluorescence image of wild type and HIV Tg rats. Scale bar: 10 μm. The data are presented as mean ± SEM. An unpaired Student t-test was used to determine the statistical significance. *, P < 0.05 vs. WT. (For interpretation of the references to color in this figure legend, the reader is referred to the Web version of this article.)
HIV TAT-mediated downregulation of antioxidant enzymes in vitro
Since mitochondrial oxidative stress and dysfunction have been shown to regulate the onset and maintenance of cellular senescence in multiple cell types [[60], [61], [62]], we next sought to assess the expression of antioxidants, including mitochondria specific SOD2, CAT, and Gpx and mitochondrial ROS production in mPMs. mPMs were exposed to HIV TAT (7 nM) for 24 and 48 h, subsequently incubated with mitoSOX for 15 min, followed by acquisition of live-cell images for assessing the mitochondrial superoxide anion levels. The mitoSOX dye, a direct indicator of superoxide radical, easily penetrates the mitochondria and upon oxidation by superoxide, leads to emission of red fluorescence [63]. As shown in Fig. 3A, exposure of mPMs to HIV TAT significantly (P < 0.05) increased the red fluorescence (superoxide radical) at both 24 and 48 h compared to control cells. There was, however, no change in the red fluorescent dye in the mPMs exposed to heat-inactivated HIV TAT (Fig. 3A). Next, we determined the time-dependent expression of mitochondrial antioxidant enzymes in mPMs exposed to HIV TAT (7 nM) using western blotting. As shown in Fig. 3B, exposure of mPMs to HIV TAT significantly (P < 0.05) decreased the protein expression level of SOD2 (Fig. 3B) at both 24 and 48 h. We also assessed SOD2 activity in mPMs exposed to HIV TAT and, as shown in Fig. 3C, there was significant downregulation of SOD2 activity in HIV TAT-exposed mPMs compared with the control cells and in cells exposed to heat-inactivated TAT. Furthermore, we also analyzed the expression of other antioxidant enzymes such as CAT and Gpx in mPMs exposed to HIV TAT for varying time points (3, 6, 12, 24 and 48 h). As shown in Fig. 3D, exposure of mPMs to HIV TAT significantly (P < 0.05) decreased the expression of CAT levels, starting from 12 h and this trend was sustained for up to 48 h. In case of Gpx, however, there was an initial upregulation (Fig. 3E) at 3 h which was sustained for up to 12 h, followed by a drop in expression at 24 and 48 h.
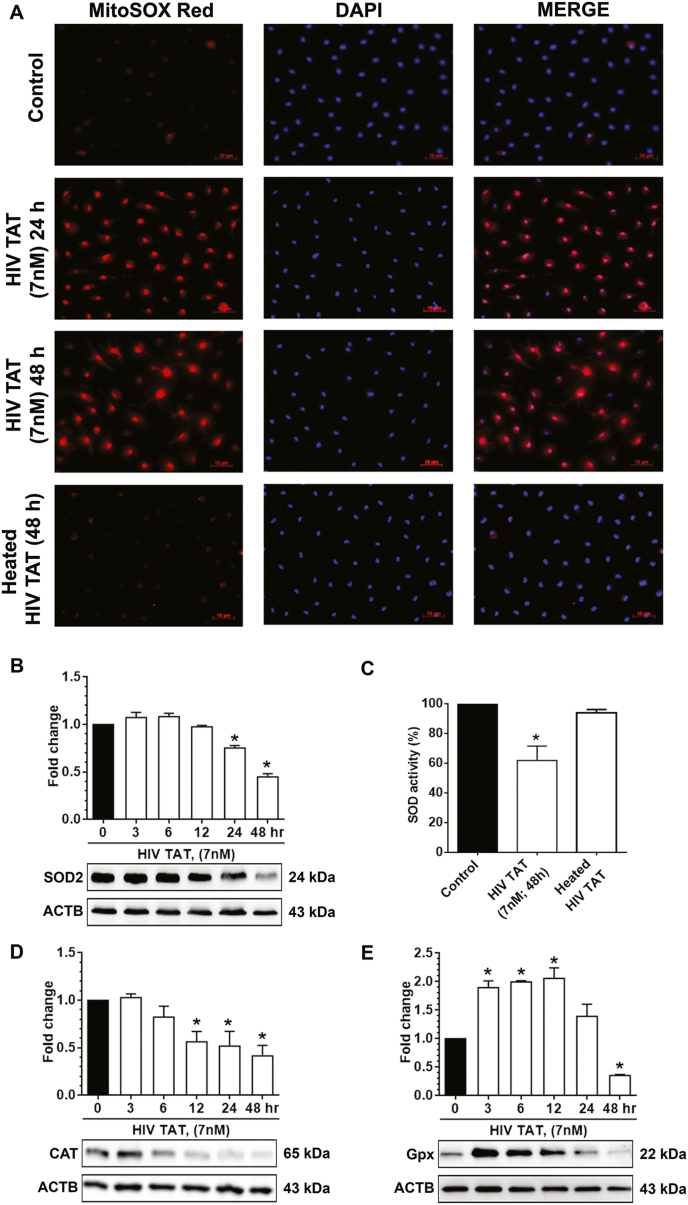
HIV TAT mediated increased mitochondrial ROS and decreased expression of antioxidant enzymes in vitro (A) MitoSox Red fluorescence staining showing the levels of mitochondrial ROS in unexposed control mPMs and mPMs exposed to HIV TAT (7 nM) for 24 and 48 h as well as heated HIV TAT for 48 h. Hoechst (blue) staining used to visualize nucleus. Scale bar: 10 μm. (B) Representative Western blot showing the protein levels of SOD2 in unexposed control mPMs and mPMs exposed to HIV TAT (7 nM) for different time point. (C) Quantification graph showing the activity of SOD2 in unexposed control mPMs and mPMs exposed to HIV TAT (7 nM) and heat inactivated HIV TAT for 48 h. (D, E) Representative western blots showing the protein levels of CAT (D) and Gpx (E) in unexposed control mPMs and mPMs exposed to HIV TAT (7 nM) for different time point. ACTB was probed as a loading control for all experiments. The data are presented as mean ± SEM from six independent experiments. Non-parametric Kruskal-Wallis One-way ANOVA followed by Dunn's post hoc test was used to determine the statistical significance of multiple groups. *, P < 0.05 vs. control. (For interpretation of the references to color in this figure legend, the reader is referred to the Web version of this article.)
HIV TAT-mediated downregulation of antioxidant enzymes in vivo
We next sought to validate the in vitro findings in the prefrontal cortices and striatal regions of 15-month-old HIV Tg rats. The protein expression of SOD2 (Fig. 4A), CAT (Fig. 4B), and Gpx (Fig. 4C) were significantly (P < 0.05) downregulated in the prefrontal cortices of HIV Tg rats compared to WT rats. In the striatum, however, SOD2 (Fig. 4D) expression was significantly (P < 0.05) downregulated, whereas CAT (Fig. 4 E) and Gpx (Fig. 4F) showed a decreasing trend, but the effect did not reach statistical significance.
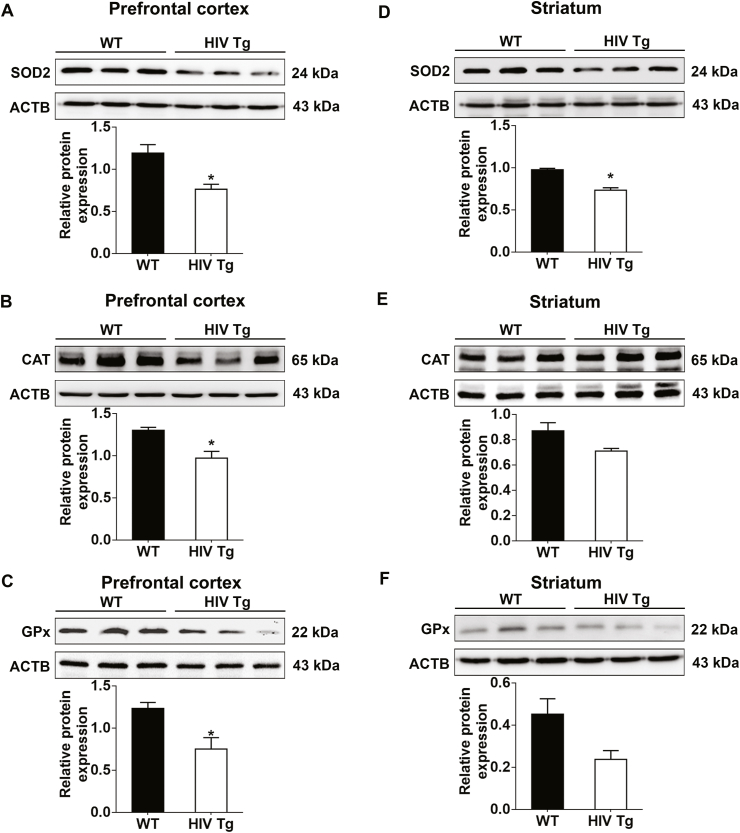
HIV-1 mediated decreased expression of antioxidant enzymes in vivo. (A–C) Representative western blots showing the protein expression levels of SOD2 (A), CAT (B) and Gpx (C) in the prefrontal cortex and SOD2 (D), CAT (E) and Gpx (F) in the striatum of wild type and HIV Tg rats (n = 3). ACTB was probed as a protein loading control for all experiments. The data are presented as mean ± SEM. An unpaired Student t-test was used to determine the statistical significance. *, P < 0.05 vs. WT.
HIV TAT-mediated downregulation of SIRT3 in microglial cells
Having demonstrated HIV TAT-mediated increase in mitochondrial oxidative stress and downregulation of the antioxidant enzymes, we next sought to assess the expression and activity of SIRT3 (a key regulator of the mitochondrial adaptive response to stress) in mPMs exposed to HIV TAT. For this, mPMs were exposed to varying doses (1.7, 3.5, 7, 14 nM) of HIV TAT for 24 h and the cell lysates were assessed for the expression of SIRT3 using western blotting. As shown in Supplementary Fig. 2A, there was dose-dependent downregulation of SIRT3, with significant decrease at 7 and 14 nM of HIV TAT. Cells exposed to heated-inactivated TAT failed to affect SIRT3 expression, and these findings negatively correlated with the senescence markers p16 and p21 (Fig. 1A and B). Next, we performed a time-course experiment wherein mPMs were exposed to HIV TAT (7 nM) for varying times (0, 3, 6, 12, 24, and 48 h) for determining the expression of SIRT3. As shown in Fig. 5A, expression of SIRT3 was time-dependently downregulated with a maximal effect at 24 and 48 h. Since this study is primarily focused on mitochondrial sirtuins, we also assessed the expression of other mitochondrial sirtuins such as SIRT4 and SIRT5. As shown in Fig. 5B and C, there was no decrease in the expression of SIRT4 or SIRT5, thus underscoring the role of SIRT3 in HIV TAT-mediated alteration in mitochondrial antioxidant enzymes and mitochondrial oxidative stress. For further validation, we also isolated the mitochondria from mPMs exposed to HIV TAT (7 nM) for varying times and examined the expression of SIRT3, SIRT4, and SIRT5 proteins by western blotting. Again, only the SIRT3 (Fig. 5D) protein level was found time-dependently decreased with significant effect at 24 and 48 h. There was no difference in the expression of SIRT4 (Fig. 5E) and SIRT5 (Fig. 5F) following exposure of mPMs to HIV TAT. To further validate HIV TAT-mediated downregulation of mitochondrial SIRT3, mPMs exposed to HIV TAT (7 nM for 48 h) were stained for mitochondria (MitoTracker Red) followed by immunocytochemistry for SIRT3. As shown in Fig. 5G, in mPMs exposed to HIV TAT, there were minimal SIRT3 specific green puncta, with reduced co-localization of MitoTracker Red and SIRT3 puncta compared with the control cells (Fig. 5G). Having demonstrated decreased expression of SIRT3, we next sought to determine the expression of SIRT3 activity in HIV TAT-exposed mPMs using a SIRT3 activity assay kit. As expected, and shown in Fig. 5H, SIRT3 activity was significantly (P < 0.05) decreased in mPMs exposed to HIV TAT compared to control cells.
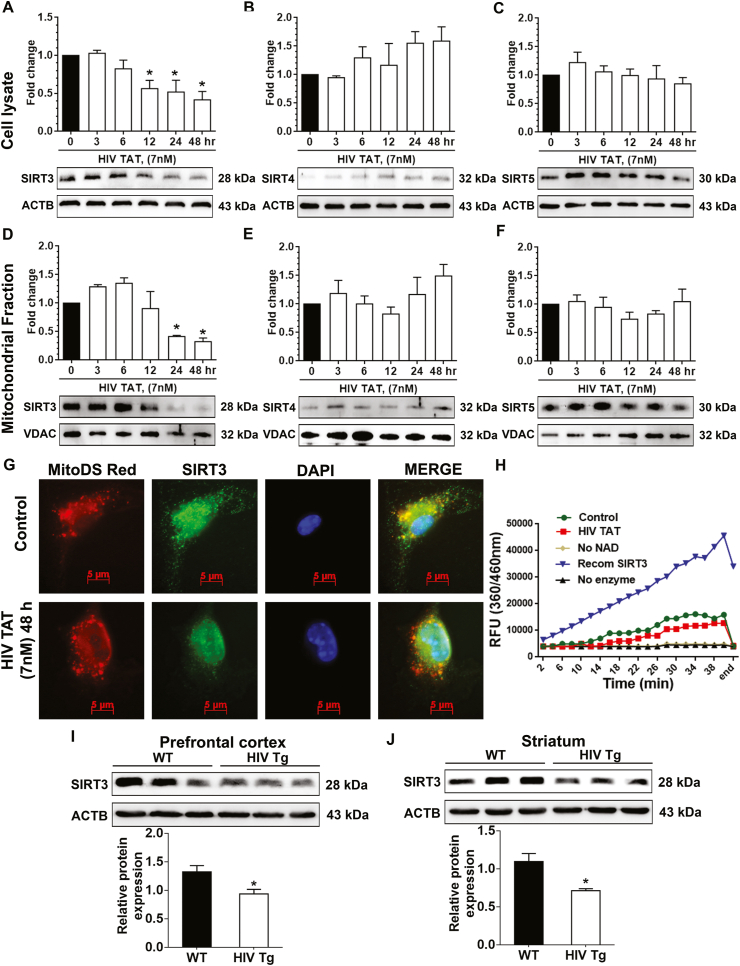
HIV TAT mediated decreased expression of SIRT3 in vitro and in vivo. (A–C) Representative western blots showing the protein expression levels of SIRT3 (A) SIRT4 (B) and SIRT5 (C) in the whole cellular extract of mPMs exposed to HIV TAT (7 nM) for different time points (0,3,6,12,24 and 48 h). ACTB was probed as a protein loading control for all experiments. (D–F) Representative western blots showing the protein expression levels of SIRT3 (D) SIRT4 (E) and SIRT5 (F) in the mitochondrial fraction obtained from mPMs exposed to HIV TAT (7 nM) for different time points (0,3,6,12,24 and 48 h). VDAC was probed as a protein loading control for all experiments. Non-parametric Kruskal-Wallis One-way ANOVA followed by Dunn's post hoc test was used to determine the statistical significance of multiple groups. (G) Representative fluorescence image showing the mitochondria (RED; mitoDsRed plasmid), SIRT3 protein (GREEN; immunofluorescence), and DAPI (blue) in unexposed control mPMs and mPMs exposed to HIV TAT (7 nM) for 48 h. Scale bar: 5 μm. (H) Graphical representation of SIRT3 activity measurement over time in mPMs either unexposed or exposed to HIV TAT for 48 h. Recombinant SIRT3 used as positive control and no enzyme used as negative control. (I–J) Representative western blots showing the protein expression levels of SIRT3 in the prefrontal cortex (I) and in the striatum (J) of WT and HIV Tg rats (n = 3). ACTB was probed as a protein loading control for all experiments. The data are presented as mean ± SEM from six independent experiments. An unpaired Student t-test was used to determine the statistical significance. *, P < 0.05 vs. WT. (For interpretation of the references to color in this figure legend, the reader is referred to the Web version of this article.)
These findings were also confirmed in HIV Tg rats. The expression of SIRT3 was significantly (P < 0.05) downregulated in the prefrontal cortices (Fig. 5I) and striatum (Fig. 5J) of HIV Tg rats compared to WT controls. Similar to cell culture studies, there was no significant change in the expression levels of SIRT4 or SIRT5 in both the prefrontal cortices (Sup. Fig. 2B and D) and striatum (Sup. Fig. 2C and E) of WT or HIV Tg rats.
SIRT3 overexpression inhibited HIV TAT-mediated microglial senescence
Having demonstrated the downregulation of SIRT3 in HIV TAT-exposed mPMs, which, in turn, contributed to mitochondrial oxidative stress and induced senescence, we next sought to explore whether overexpression of full-length SIRT3 in mPMs could abrogate HIV TAT-mediated senescence. For this, first, mPMs were transfected with full-length SIRT3 cloned into a pcDNA3.1 vector modified with C-terminal Flag tag protein. Next, the SIRT3 overexpressed mPMs were exposed to HIV TAT (7nM) for 48 h. As shown in Fig. 6A, the FLAG expression was only found in SIRT3 overexpressed mPMs, suggested thereby that SIRT3 plasmid was successfully transfected into mPMs and translated the protein. Next, the lysates were assessed for the expression of SIRT3, antioxidant enzymes including SOD2, CAT, and Gpx, senescence markers p16, p21 as well as SA β-gal staining. As shown in Fig. 6B and C, HIV TAT-mediated decrease in the SIRT3 protein expression levels (Fig. 6B) and activity (Fig. 6C) were significantly (P < 0.05) inhibited in mPMs transfected with SIRT3 plasmid, which was comparable to mPMs transfected with pcDNA3.1 vector alone. Further, HIV TAT mediated decreased expression of SOD2 (Fig. 6D), CAT (Fig. 6E), and Gpx (Fig. 6F). Intriguingly, in mPMs transfected with the SIRT3 plasmid, HIV TAT failed to induce the senescence phenotype, including inhibition of HIV TAT mediated expression of p16 (Fig. 6G) and p21 (Fig. 6H), and inhibition of HIV TAT mediated upregulation SA β-gal activity (blue color positive cells) (Fig. 6I and J). Furthermore, we also assessed the expression of proinflammatory cytokines in the supernatant fluids collected from cultured mPMs in this experimental setup. As shown, overexpression of SIRT3 in mPMs abrogated HIV TAT-mediated upregulated expression of proinflammatory cytokines, including TNF-α, IL1β, and IL6, in the supernatant fluids (Sup. Fig. 3A-C). Collectively, the results suggested that overexpression of SIRT3 prevented HIV TAT mediated imbalance of mitochondrial oxidative stress and induction of senescence phenotype in mPMs.
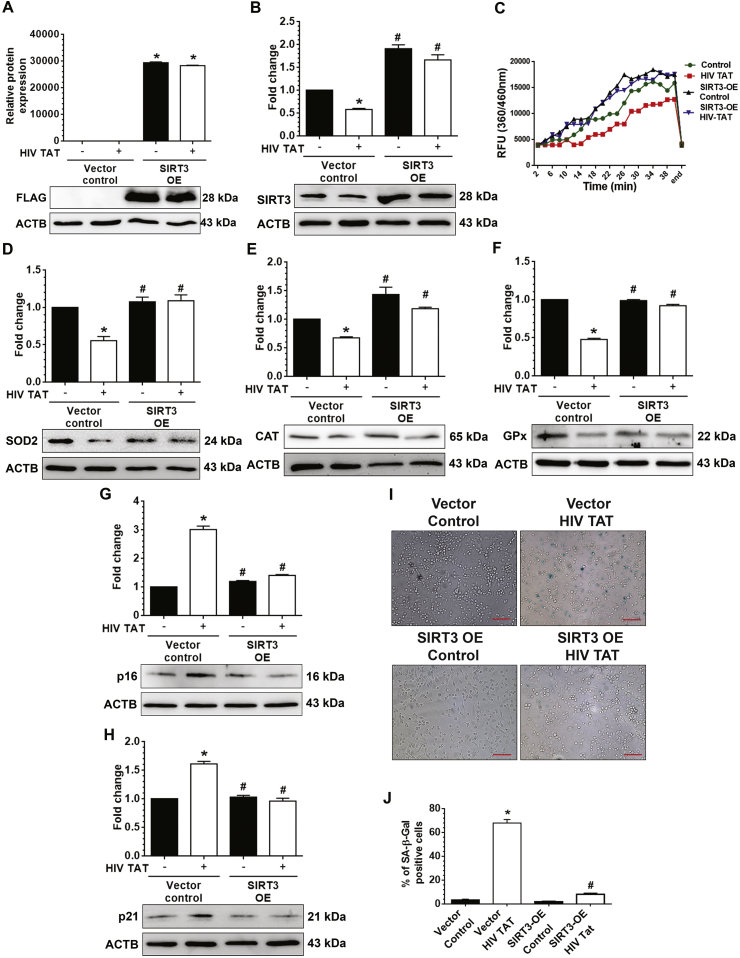
Overexpression of SIRT3 reversed HIV TAT mediated microglial senescence. (A–B) Representative western blots showing the protein levels of FLAG (A) and SIRT3 (B) in mPMs transfected with either mSIRT3-L plasmid or pcDNA3.1 vector control following exposure with HIV TAT (7 nM) for 48 h. (C) Graphical representation showing the activity of SIRT3 in mPMs transfected with either mSIRT3-L plasmid or pcDNA3.1 vector control following exposure with HIV TAT (7 nM) for 48 h. (D–H) Representative western blots showing the protein levels of antioxidant enzymes including SOD2 (D), CAT (E) and Gpx (F) and senescence markers including p16 (G) and p21 (H) in mPMs transfected with either mSIRT3-L plasmid or pcDNA3.1 vector control following exposure with HIV TAT (7 nM) for 48 h. ACTB was probed as a protein loading control for all experiments. (I) Representative images showing the SA-β-gal activity (blue color positive cells) in mPMs transfected with either mSIRT3-L plasmid or pcDNA3.1 vector control following exposure with HIV TAT (7 nM) for 48 h. Scale bar: 10 μm. (J) Quantification of SA-β-gal positive mPMs transfected with either mSIRT3-L plasmid or pcDNA3.1 vector control following exposure with HIV TAT (7 nM) for 48 h. The data are presented as mean ± SEM from six independent experiments. Non-parametric Kruskal-Wallis One-way ANOVA followed by Dunn's post hoc test was used to determine the statistical significance of multiple groups. *, P < 0.05 vs. control; #, P < 0.05 vs. HIV TAT. (For interpretation of the references to color in this figure legend, the reader is referred to the Web version of this article.)
HIV TAT-mediated increased expression of miR-505 is involved in microglial senescence
Having demonstrated that the exposure of microglia to HIV TAT induced cellular senescence via decreased mitochondrial SIRT3 expression and increased mitochondrial stress, we next sought to explore the upstream modulator for SIRT3 downregulation. Based on the TargetScan analysis, SIRT3 is a predicted target of miR-505 and has a highly conserved 3′-UTR binding site for miR-505 that is conserved in all mammals (Fig. 7A). To explore whether miR-505 could directly bind to the 3′-UTR of its target, SIRT3 mRNA, we transfected HEK293T with a SIRT3 3′-UTR or SIRT3 mutant 3′-UTR pmirGLO dual-luciferase reporter construct and miR-505 mimic. As shown in Fig. 7B, co-transfection of HEK293T cells with both miR-505 mimic and SIRT3 3′-UTR-luciferase construct resulted in significant decrease in luciferase activity. In contrast, cells co-transfected with the SIRT3-mutant (unable to bind miR-505 in its 3′ UTR) failed to downregulate luciferase activity, thus suggesting preferential binding of miR-505 with 3′-UTR of SIRT3 (Fig. 7B). We next sought to analyze whether miR-505 was involved in HIV TAT-mediated downregulation of SIRT3 protein. For this, mPMs were exposed to HIV TAT (7 nM) and monitored for the expression of miR-505 up to 48 h. As shown in Fig. 7C, mPMs exposed to HIV TAT exhibited time-dependent upregulation of miR-505 expression. As shown previously in Fig. 4A, time-dependent downregulation of SIRT3 expression was negatively correlated with this upregulation of miR-505 in mPMs exposed to HIV TAT (Fig. 7C).
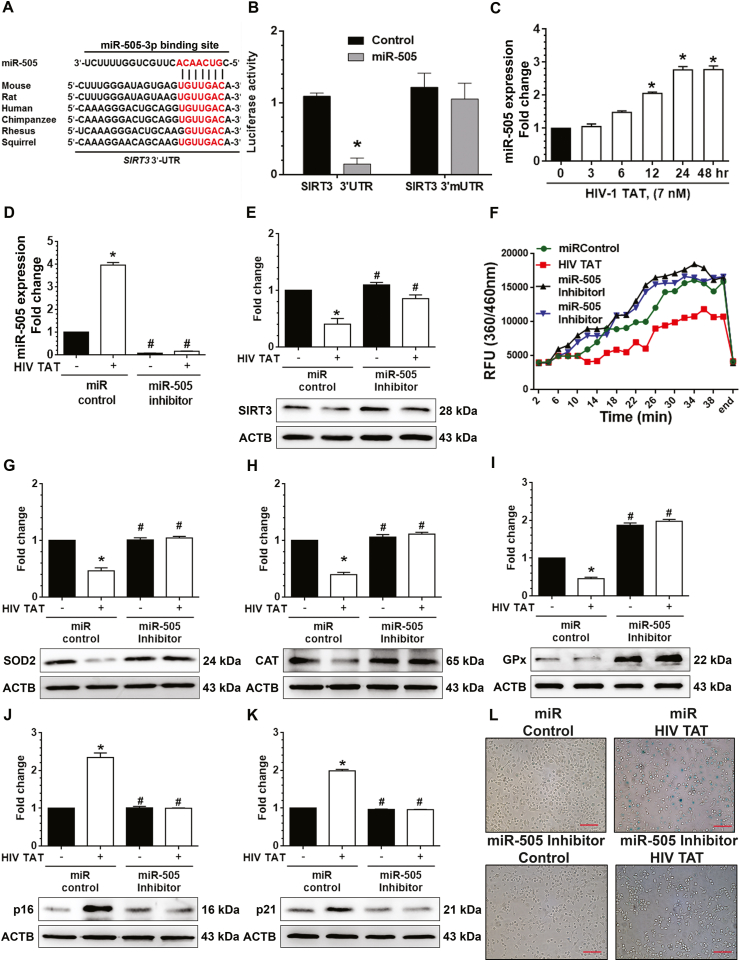
HIV TAT mediated induction senescence in mPMs involves miR505/SIRT3/mitochondrial antioxidant enzymes axis. (A) Putative miRNA505 binding sites in the 3′-UTR of SIRT3 gene. The potential complementary residues are shown in red color. (B) Relative luciferase activity of 3′-UTR and 3′-mUTR (mutant) constructs of SIRT3 co-transfected with miR-505 mimics in HEK293T cells. (C) HIV TAT time-dependently upregulated the expression level of miR505 in mPMs. U6 was used as a housekeeping control. (D) qPCR analysis showing expression levels of miRNA-505 in mPM cells transfected with miRNA control or miRNA-505 inhibitor following exposure to HIV TAT (7 nM) for 48 h. U6 was used as a housekeeping control. (E) Representative western blotting analysis showing protein expression of SIRT3 in mPM cells transfected with miRNA control or miRNA-505 inhibitor following exposure to HIV TAT (7 nM) for 48 h. (F) Graphical representation showing the activity of SIRT3 in mPMs transfected in mPM cells transfected with miRNA control or miRNA-505 inhibitor following exposure to HIV TAT (7 nM) for 48 h. (G–K) Representative western blots showing the protein levels of antioxidant enzymes including SOD2 (G), CAT (H) and Gpx (I) and senescence markers including p16 (J) and p21 (K) in mPM cells transfected with miRNA control or miRNA-505 inhibitor following exposure to HIV TAT (7 nM) for 48 h. ACTB was probed as a protein loading control for all experiments. (L) Representative images showing the SA-β-gal activity (blue color positive cells) in mPM cells transfected with miRNA control or miRNA-505 inhibitor following exposure to HIV TAT (7 nM) for 48 h. Scale bar: 10 μm. The data are presented as mean ± SEM from six independent experiments. Non-parametric Kruskal-Wallis One-way ANOVA followed by Dunn's post hoc test was used to determine the statistical significance of multiple groups. *, P < 0.05 vs. control; #, P < 0.05 vs. HIV TAT. (For interpretation of the references to color in this figure legend, the reader is referred to the Web version of this article.)
Next, we wanted to demonstrate the role of miR-505 in HIV TAT-mediated SIRT3 expression, mitochondrial antioxidant enzymes, and senescence markers in mPMs. For this, mPMs were first transfected with either miR-505 inhibitor or miR-control, followed by HIV TAT (7 nM) exposure for 48 h. As shown in Fig. 7D, in mPMs transfected with miR-505 inhibitor, there was significant downregulation of miR-505 expression. Intriguingly, in mPMs transfected with miR-505 inhibitor HIV TAT-mediated downregulated expression and activity of SIRT3 were significantly (P < 0.05) abrogated, but not in cells transfected with miR-control (Fig. 7E and F). Further, in mPMs transfected with miR-505 inhibitor HIV TAT failed to downregulate the expression of antioxidant enzymes SOD2 (Fig. 7G), CAT (Fig. 7H), and Gpx (Fig. 7I) similar to that in miR-control transfected cells. Additionally, transfection of mPMs with miR-505 inhibitor also significantly (P < 0.05) inhibited the HIV TAT-mediated increase in the expression of senescence-associated markers, p16 (Fig. 7J) and p21 (Fig. 7K) as well as numbers of SA β-gal (blue) positive cells (Fig. 7L and Sup. Fig. 4A). Along these lines, HIV TAT mediated release of proinflammatory cytokines (TNF-α, IL1β and IL6) was also blocked in mPMs transfected with the miR-505 inhibitors (Sup. Fig. 4B-D). Reciprocally, we also sought to assess the expression of miR-505 overexpression. For this mPMs were transfected with miR-505 mimic or miR-control and assessed for the expression of antioxidant enzymes as well as the senescence-associated markers p16 and p21. As expected, transfection of mPMs with miR-505 mimic, resulted in increased expression miR-505 (Sup. Fig. 5A) compared with mPMs transfected with miR-control. Additionally, there was also significant (P < 0.05) decrease in the expression of both SIRT3 (Sup. Fig. 5B) and its activity (Sup. Fig. 5C), that was accompanied with decreased expression of the antioxidant enzymes SOD2 (Sup. Fig. 5D), CAT (Sup. Fig. 5E), and Gpx (Sup. Fig. 5F) in cells transfected with the miR-505 mimic compared with the cells transfected with miR-control. Additionally, miR-505 mimic transfected cells also demonstrated increased expression of senescence-associated markers such as p16 (Sup. Fig. 5G) and p21 (Sup. Fig. 5H), as well as SA β-gal staining (Sup. Fig. 5I and J) and release of SASPs (Sup. Fig. 6A-C) compared with mPMs transfected with miR-control. Exposure of miR-505 mimic transfected cells to HIV TAT (7 nM for 48 h) further augmented these effects.
Altered expression of SIRT3, senescence markers, and antioxidant enzymes in the brains of HIV+ve individuals
Having demonstrated that exposure of microglia to HIV TAT downregulates expression of mitochondrial SIRT3, induces mitochondrial oxidative stress, and thereby induces senescence phenotype in microglia, we next sought to validate our findings in brains of HIV +ve individuals (Table 1). For this, we assessed the expression of miR-505, SIRT3, senescence markers p16, p21, as well as the antioxidant enzymes SOD2, CAT, and Gpx in the prefrontal cortices of HIV infected and in HIV infected patients with encephalopathy (HIVE), and their age-matched controls. Intriguingly, mRNA expression of miR-505 (Fig. 8A) was increased with a concomitant decrease in the protein the expression of SIRT3 (Fig. 8B) in the prefrontal cortices of both HIV +ve as well as HIVE patients compared to age-matched controls. Additionally, the protein expression of SOD2 (Fig. 8C), CAT (Fig. 8D), and Gpx (Fig. 8E) were also significantly decreased in HIV patients (HIV +ve and HIVE) compared with age-matched controls. Conversely, the expression of p16 (Fig. 8F), p21 (Fig. 8G), and mature IL1β (Fig. 8H) were also significantly increased in the frontal cortical brain samples of both HIV +ve and HIVE patients compared to age-matched healthy individuals. Furthermore, in HIVE patients, the expression of p16 was higher, while the SOD2 expression was lower compared with HIV +ve individuals.
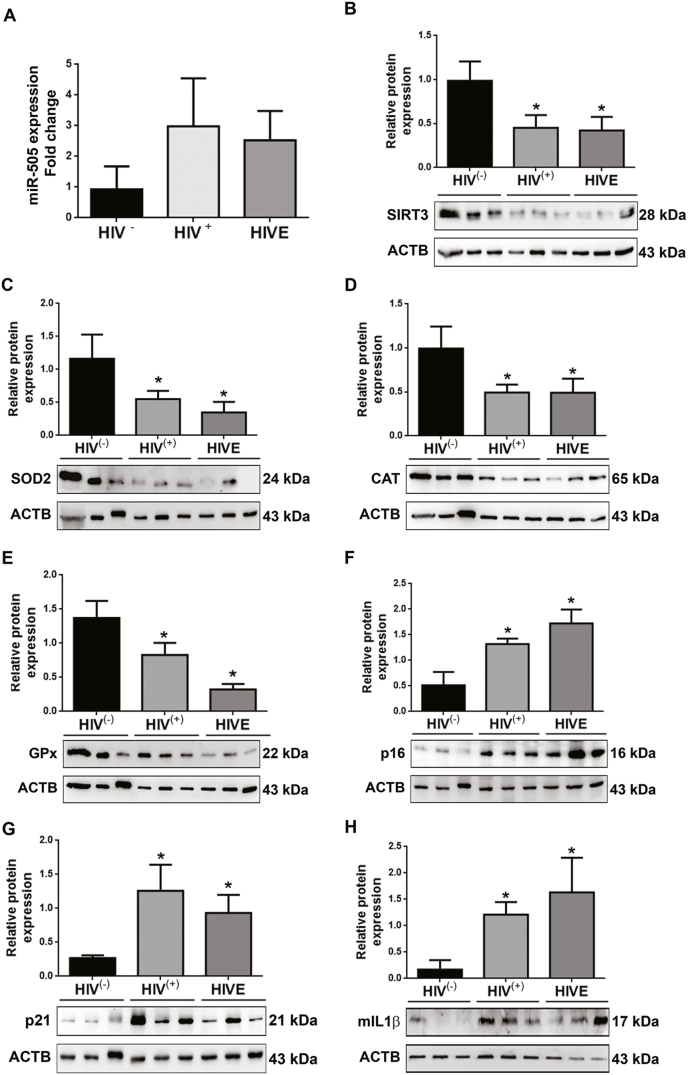
Altered expression of miR-505, SIRT3, senescence markers and antioxidant enzyme in the brains of HIV (+) individuals. (A) qPCR analysis showing expression levels of miRNA-505 in frontal cortex brain samples of HIV infected patients, HIVE and age matched normal people (n = 3). U6 was used as an internal control. (B–H) Representative western blots showing the protein expression levels of SIRT3 (B), antioxidant enzymes including SOD2 (C), CAT (D) and Gpx (E), senescence markers including p16 (F) and p21 (G) and mIL1β (H) in frontal cortex brain samples of HIV infected patients, HIVE and age matched normal people (n = 3). ACTB was probed as a protein loading control for all experiments. The data are presented as mean ± SEM from 3 independent experiments. An unpaired Student t-test was used to determine the statistical significance. *, P < 0.05 vs. HIV- individuals.
Discussion
Epidemiological studies have shown that more than half of the HIV-1 infected individuals on the cART regimen, continue to be affected with varying degrees of cognitive impairment, collectively termed as HAND [2]. Individuals with chronic HIV-1 infection are prone to accelerated aging that is accompanied with severe cognitive impairment, likely due to pronounced age-associated changes in cells (senescence phenotype), including altered DNA methylation, reduced telomere stability, increased immune activation, and neuroinflammation [34,64,65]. Senescence-driven impairment of microglial immune responses and dysfunction have been widely-recognized as key feature underlying the onset and progression of age-associated neurodegenerative diseases [[15], [16], [17], [18],66]. A recent study by Chen et al. [67] demonstrated that HIV-1 infection induces functional changes in the cultured human primary fetal microglia, which develop a senescence-like phenotype, involving mitochondrial reactive oxygen species. To date however, there are no treatment strategies for reversing or halting accelerated aging associated with HAND pathogenesis. Mechanistic approaches, that could reveal the novel molecular targets in cells are thus warranted for future design and development of therapeutic interventions or adjunctive therapies to halt HIV-1-associated neuroinflammation and accelerated aging (inflammaging). Our earlier reports have shown that in mPMs, exposure to HIV TAT significantly induced mitochondrial dysfunction and microglial activation, and this was accompanied by increased expression of proinflammatory mediators, thereby contributing to neuroinflammation [26]. Along these lines, a study by Turchan-Cholewo et al., demonstrated that combinatorial effects of HIV TAT and morphine resulted in early and synergistic increases in cellular ROS production with concomitant increases in total protein oxidation levels and proinflammatory cytokine release [68]. Intriguingly, several studies have shown that the factors such as HIV-1 and/or drugs of abuse [69] and HIV and/or cART [70] could induce senescence-like phenotype in astrocytes, thus contributing to brain aging. The implications of HIV TAT in inducing senescence-like phenotype in microglia, however, remains unexplored. This current study for the first time underscore the detrimental effects of HIV TAT in inducing senescence-like phenotype in microglial cells involving the miR-505/SIRT3 axis.
In the present study, we demonstrated that exposure of HIV TAT induces senescence-like phenotype in mPMs as evidenced by increased expression of senescence-associated cell cycle arrest proteins p16 and p21, increased SA β-gal activity, decreased telomerase enzyme activity, cell cycle arrest, and SASPs. To validate our in vitro findings in in vivo, we resorted to the well-established animal model - HIV Tg rats. This model has been extensively used for investigating the long-term effects of HIV viral proteins, analogous to the presence of residual viral proteins in individuals with HAND that are on cART [26,[71], [72], [73]]. Since these rats also express other viral proteins in addition to HIV TAT, similar to the scenario observed in HIV +ve humans on cART, we reasoned it would be a better model to study the human syndrome. In this study, we demonstrated that the expression of p21 and p16 proteins were significantly increased in the brain lysates of HIV-1 Tg rats compared with the WT controls. Our findings thus suggest that HIV TAT induces the senescence-like phenotype in microglial cells both in vitro and in vivo.
Numerous studies have reported that mitochondrial antioxidant/prooxidant imbalance plays a significant role in the induction of cellular senescence both in vitro and in vivo [44,[74], [75], [76]], thereby leading to disease progression and accelerated aging. Being an active organelle of energy production, mitochondria also produce ROS. Under normal conditions, the mitochondrial antioxidant systems such as SOD2, CAT, and Gpx, quench excessive ROS, thereby reducing the oxidative stress and maintaining the healthy mitochondrial network. The delicate balance between the generation of ROS and the antioxidant system determines mitochondrial health [77]. In the present study, we demonstrated that exposure of mPMs to HIV TAT resulted in the downregulation of mitochondrial antioxidant enzymes - SOD2, CAT, and Gpx - with a concomitant increase in the production of superoxide radicals. We found an initial upregulation of Gpx followed by its downregulation at 48 h. It is likely that the early upregulation of Gpx could be to alleviate the initial accumulation of peroxide formed from superoxide dismutation and that the subsequent decrease is possibly due to overwhelmed ROS generation [78]. These results suggest that HIV TAT mediates mitochondrial oxidative stress in microglial cells.
In addition to downregulating the expression levels of SOD2, CAT, and GPx, HIV TAT has also been shown to alter the levels of cellular as well as mitochondrial redox mediators. HIV TAT is also reported to decrease the rate of extracellular acidification such as basal respiration, ATP production, maximal respiratory capacity, spare capacity, proton leak and non-mitochondrial respiration in mouse primary microglial cells as well as in mitochondria isolated from HIV-1 Tg rats [26]. Similar observations have been reported in other CNS cells including neurons [42,[79], [80], [81], [82], [83]] and cardiomyocytes [84]. Additionally, HIV TAT has also been shown to reduce the ratio of GSH/GSSG, an outcome of decreased expression of intracellular and mitochondrial antioxidants, with a concomitant increase in the expression of malondialdehyde levels [85] in neurons [86,87], B cells [88], and brain endothelial cells [89]. While there is paucity of information linking glutamate toxicity with microglial senescence, a recent study by Limbad et al. showed the involvement of astrocyte senescence and glutamate toxicity in human primary cortical neurons [90]. This study demonstrated downregulation of genes encoding glutamate and potassium transporters in primary human astrocytes made senescent by X-irradiation. Furthermore, this downregulation led to neuronal cell death in co-culture assays. Unbiased RNA sequencing of transcripts expressed by non-senescent versus senescent astrocytes validated downregulation of the glutamate homeostasis during senescence.
ROS production and detoxification rates are known to be regulated by the mitochondria specific sirtuin, SIRT3, a mitochondrial NAD+-dependent deacetylase. SIRT3 plays a pivotal role in regulating mitochondrial oxidative stress and functions by deacetylating the enzymes involved in the antioxidant pathway, mitochondrial biogenesis, energy metabolism, and respiration [91]. Several studies have reported that decreased SIRT3 expression positively correlates with mitochondrial dysfunction and plays a significant role in the progression of cellular senescence and premature aging [[91], [92], [93], [94]]. In keeping with these studies our current study demonstrated that exposure of mPMs to HIV TAT caused significant downregulation of mitochondrial SIRT3 expression and activity, leading to pronounced mitochondrial oxidative stress, which, in turn, contributes to neuroinflammation and onset of senescence. Downregulation of SIRT3 was also validated ex vivo in the prefrontal cortices and striatum of HIV Tg rats and the prefrontal cortices of HIV-1 infected individuals. It is thus plausible that research strategies aimed at aborgating HIV TAT-mediated downregulation of SIRT3 could likely, slow down cellular senescence and be beneficial in halting accelerated aging.
Several studies have reported that overexpression of full-length SIRT3 protected various cells from mitochondrial oxidative stress while also preserving mitochondrial integrity and function [92,93,[95], [96], [97], [98]]. A study by Denu et al. [99], documented that overexpression of SIRT3 protected mesenchymal stem cells from aging-related senescence and enhanced differentiation ability via reduction of oxidative stress. In addition, in the co-culture model of neuronal stem cells and microglia, overexpression of SIRT3 in neural stem cells prevented them from microglia activation-induced oxidative stress injury and mitochondria-mediated apoptosis. Our results also demonstrated that overexpression of full-length SIRT3 plasmid significantly inhibited HIV TAT-mediated downregulation of SIRT3 and mitochondrial antioxidant enzymes. In addition, it also prevented increased mitochondrial superoxide formation, increased expression of p16 and p21, SA β-gal activity, and proinflammatory cytokines release in microglial cells, suggesting that SIRT3 overexpression prevented the microglial senescence. The current study is focused on mitochondrial SIRTs, such as SIRT3, SIRT4 and SIRT5, but not SIRT1 and SIRT2. It must be noted however, that involvement of other SIRTS such as SIRT1 and SIRT2 has been implicated in microglial activation/inflammation, specifically in the context of LPS, brain injury, post-stroke conditions, and neurodegenerative diseases [[100], [101], [102], [103], [104], [105], [106], [107], [108], [109], [110], [111], [112], [113], [114], [115]]. Downregulated SIRT1 expression has also been reported in microglia and myeloid cells from the brains of SIV-infected macaques [116]; in human primary astrocytes exposed to HIV TAT [117] and in HIV-infected primary human brain capillary pericytes [118].
Numerous studies implicate dysregulation of miRNAs as a pivotal regulator of a variety of cellular functions, including cell growth, differentiation, and senescence, and are linked to various age-associated neurological disorders [[119], [120], [121]]. A recent study by Qi et al. [122] has demonstrated increased expression of miR-505 in the plasma of HIV-infected patients, which negatively correlated with the CD4 counts. Herein, for the first time we report that SIRT3 has a novel 3′-UTR binding site for miR-505. Our study also confirmed that exposure of mPMs to HIV TAT time-dependently increased the expression of miR-505, thereby suggesting that miR-505 binds with the SIRT3 mRNA and negatively regulates its expression. We also employed gene manipulation approaches to modulate miR-505 expression, thereby further validated the regulatory role of miR-505 in SIRT3-dependent mitochondrial oxidative stress and microglial senescence.
In conclusion, exposure of mPMs to HIV TAT upregulated the expression of miR-505, which in turn, negatively regulated the expression of SIRT3, thereby decreasing the expression of mitochondrial antioxidant enzymes. This, in turn, resulted in increased production of mitochondrial superoxide, leading ultimately to mitochondrial oxidative stress and the induction of senescence-like phenotype in microglia. The senescent microglia releasing myraid of SASP mediators could, overtime lead to neurocognitive impairment and accelerated aging associated with HIV-1 infection. Future studies aimed at developing potential drugs or identifying nutrients capable of increasing SIRT3 expression and activity could be envisioned as promising therapeutic strategies for ameliorating HIV-1 associated oxidative stress, neuroinflammation, neurodegeneration, cognitive disorders, and accelerated aging.
Funding
This work was supported by the
Declaration of competing interest
No potential conflicts of interest were disclosed.
References
1
2
3
4
5
6
7
8
9
10
11
12
13
14
15
16
17
18
19
20
21
22
23
24
25
26
27
28
29
30
31
32
33
34
35
36
37
38
39
40
41
42
43
44
45
46
47
48
49
50
51
52
53
54
55
56
57
58
59
60
61
62
63
64
65
66
67
68
69
70
71
72
73
74
75
76
77
78
79
80
81
82
83
84
85
86
87
88
89
90
91
92
93
94
95
96
97
98
99
100
101
102
103
104
105
106
107
108
109
110
111
112
113
114
115
116
117
118
119
120
121
122
Acknowledgments
We are grateful to Dr. Guoku Hu, Dr. Raghubendra Dagur, Dr. Ke Liao and Mr. Shannon Callen for their useful discussions and technical assistance.