
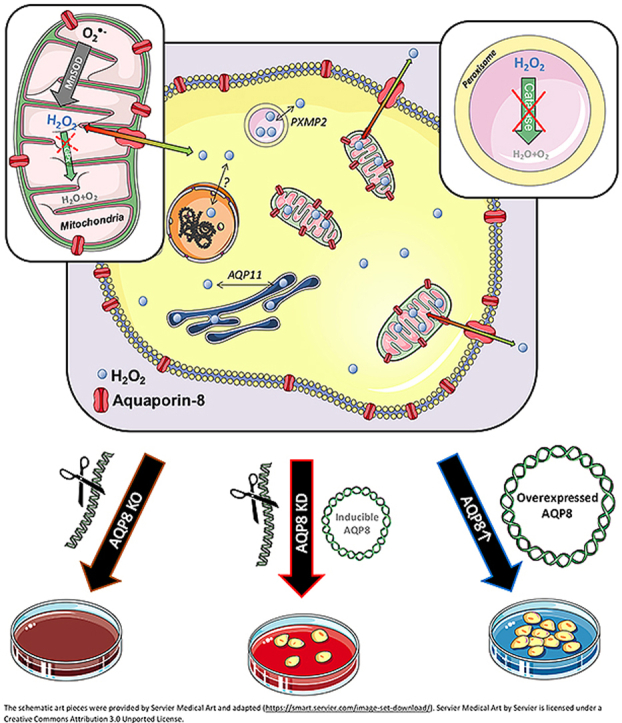
Peroxiporins are distinct aquaporins (AQP) which, beside water, also facilitate the bidirectional transport of hydrogen peroxide (H2O2) across cellular membranes. H2O2 serves as the major reactive oxygen species that mediates essential cell signaling events. In pancreatic β-cells, H2O2 has been associated with the regulation of cell growth but in excess it leads to failure of insulin secretion, making it important for diabetes mellitus (DM) pathogenesis. In the present study, the role of aquaporin-8 (AQP8) as a peroxiporin was investigated in RINm5F cells. The role of AQP8 was studied in an insulin-producing cell model, on the basis of stable AQP8 overexpression (AQP8↑) and CRISPR/Cas9-mediated AQP8 knockdown (KD). A complete AQP8 knock-out was found to result in cell death, however we demonstrate that mild lentiviral re-expression through a Tet-On-regulated genetically modified AQP8 leads to cell survival, enabling functional characterization. Proliferation and insulin content were found to be increased in AQP8↑ cells underlining the importance of AQP8 in the regulation of H2O2 homeostasis in pancreatic β-cells. Colocalization analyses of V5-tagged AQP8 proteins based on confocal microscopic imaging revealed its membrane targeting to both the mitochondria and the plasma membrane, but not to the ER, the Golgi apparatus, insulin vesicles, or peroxisomes. By using the fluorescence H2O2 specific biosensor HyPer together with endogenous generation of H2O2 using d-amino acid oxidase, live cell imaging revealed enhanced H2O2 flux to the same subcellular regions in AQP8 overexpressing cells pointing to its importance in the development of type-1 DM. Moreover, the novel ultrasensitive H2O2 sensor HyPer7.2 clearly unveiled AQP8 as a H2O2 transporter in RINm5F cells. In summary, these studies establish that AQP8 is an important H2O2 pore in insulin-producing RINm5F cells involved in the transport of H2O2 through the mitochondria and cell membrane and may help to explain the H2O2 transport and toxicity in pancreatic β-cells.
The schematic pieces were provided by Smart Medical Art and adapted (https://smart.servier.com/image-set-download/). Servier Medical Art by Servier is licensed under a Creative Commons Attribution 3.0 Unported License.

•
AQP8 KO is lethal for insulin-producing RINm5F cells.
•The peroxiporin AQP8 is localized in the plasma and mitochondrial membrane channeling H2O2 in RINm5F cells.
•Tet-On regulated low AQP8 re-expression and APQ8 overexpression are feasible models to study H2O2 transport in β-cells.
•Overexpression of AQP8 increases cell proliferation and cellular insulin content.
Over the last few decades a body of evidence demonstrated that hydrogen peroxide (H2O2) is the most abundant, robust and long-living reactive oxygen species (ROS) in living cells [1]. Dependent upon concentration, H2O2 can serve as a blessing or a curse, either serving as a signaling molecule (~1–10 nM) or as a toxin (>100 nM) [2,3]. In β-cells of pancreatic islets, H2O2 is a major ROS that leads to failure of insulin production and contributes to cell death, ultimately manifesting itself as diabetes mellitus (DM) [4]. The intracellular environment of glucose-sensitive insulin-producing β-cells is highly oxidative in order to facilitate signaling pathways for insulin secretion and regulate glucose homeostasis [5].
Pathogenically, H2O2 is produced in high amounts as a by-product during disulfide bond formation in the endoplasmic reticulum (ER) of β-cells during insulin biosynthesis [6]. In type 1 diabetes mellitus (T1DM) proinflammatory cytokines can destroy insulin-producing β-cells by intramitochondrial superoxide radical (O2•-) generation in the respiratory chain [4], which subsequently can be dismutated by the manganese superoxide dismutase (MnSOD) into H2O2 [7]. After proinflammatory cytokine attack, the oxidative stress caused by H2O2 accumulation results in an altered mitochondrial morphology and Ca2+ release that leads to impaired insulin secretion [8]. In contrast, type 2 diabetes mellitus (T2DM) is often accompanied by elevated plasma concentrations of long-chain free fatty acids leading to an increased generation of H2O2 in the peroxisomal β-oxidation [9]. Hence, signature of T1DM is the high rate of H2O2 production after cytokine exposure in mitochondria in combination with a low expression of glutathion peroxidases (GPx), whereas in T2DM the peroxisomes exhibit almost no catalase expression when compared to other tissues or cells [10,11]. In addition to the disease-specific pathology, β-cells in general are inherently poorly equipped with antioxidative enzymes that inactivate H2O2 and protect cells from oxidative stress [4]. Since β-cells do not provide an adequat antioxidative protection mechanism to reduce deleterious H2O2 concentrations, its clearance through membrane transportation is crucially important, particularly out of the mitochondria and the peroxisomes.
Intracellular membranes differ in their permeability for H2O2 as a consequence of varying expression levels of peroxiporins, a recently classified subgroup of aquaporins (AQPs) [12]. In mammals, the aquaporin isomeres AQP0-12 are differentially expressed among distinct cell types, with some exemptions like AQP10 that have not yet been identified in the rat transcriptome [13]. These membrane channel proteins facilitate a passive transport of polarized molecules, such as water, along a concentration gradient inter- and intracellularly separated by membranes. Distinct AQP isoforms enable the permeability of other small molecules such as glycerol, ammonia, urea, H2O2 or gases like carbon dioxide and thus, were accordingly categorized [12]. For example, AQP3 [14,15] and AQP9 [15,16] are members of the family of aquaglyceroporins, AQP8 is grouped as an aquaporin/aquaammoniaporin [17], and AQP11 belongs to the subgroup of superaquaporins [18]. Likewise, these four isoforms (AQP3, -8, -9 and -11) have been also reported to facilitate the transport of H2O2 and thus have been categorized in the group of peroxiporins [15,[19], [20], [21]]. Notably, the H2O2 permeability for AQP5 is still debated [19,22].
In preliminary experiments, we observed that a complete knock-out (KO) of the isoform AQP8 was lethal to insulin-producing RINm5F cells, highlighting its necessary role in β-cells. We believed that further study of AQP8 would help us understand the H2O2 permeability of membranes and allow for better characterization of the exceptionally poorly protected pancreatic β-cell against oxidative stress [5]. We hypothesized that AQP8 would reduce H2O2 from the compartment of its origin by allowing transport through the surrounding membrane enabling a fast ROS equilibrium and eventual detoxification. The organelle specific AQP8 protein localization provides information about this capability of the β-cell to transport H2O2 to a compartment with higher antioxidative protections and a higher dilution by a larger compartment. The mitochondrial volume in β-cells reveals only 4% of the whole cell (vs. 20% in hepatocytes) [23,24], hence an efflux into the cytosol would also dilute the H2O2 concentration by a factor of 25. Especially when H2O2 is not sufficiently detoxified and hydroxyl radicals (•OH) are produced via the Fenton reaction [25] instead, it would lead to a damage in the low proteced β-cell [5]. However, low expression of GPx1 in the cytosol [26,27] and the mitochondria [26,27], also a low expression of peroxiredoxin 4 (Prx4) in the ER [4,28] and especially a high expression of GPx4 located in (sub-)cellular membranes [29] could provide protection to detoxify H2O2. In this study we therefore analyzed the localization of AQP8 in distinct organelles and the efflux rate of H2O2 via AQP8. To enable localization, we used differentially targeted d-amino acid oxidase (DAAO) constructs as a tool to generate H2O2 within distinct cellular localizations allowing us to study intracellular membrane transfer rates of H2O2. In AQP8 overexpression and knockdown experiments, we identified this peroxiporin as a H2O2 transporter in RINm5F cells and suggests a pivotal role of AQP8 in insulin-producing β-cells. RINm5F cell lines with different AQP8 expression levels thus providing suitable models to study the role of AQP8 under (patho-)physiological conditions and improving the understanding of the manifestation of T1DM and T2DM.
The rat insulinoma-derived cell line RINm5F (RRID: CVCL_0501; ATCC CRL-11605, Manassas, VA, USA) was cultured according to Ref. [30]. The rat insulinoma-derived cell line INS-1E (RRID:CVCL_0351) [31] was cultured in RPMI 1640 medium (Roswell Park Memorial Institute) supplemented with 10 mM glucose, 10% (v/v) fetal calf serum, 10 mM HEPES, 1 mM pyruvate, 1 mM l-glutamine and 50 μM 2–mercaptoethanol. Rat pancreatic islets were isolated from 250 to 300 g adult male Lewis rats by collagenase digestion, separated by Ficoll gradient, handpicked under a stereo microscope and cultivated according to Ref. [9]. All culture media were supplemented with penicillin (100 U/ml) and streptomycin (0.1 mg/ml) and cells were cultured in a humidified atmosphere at 37 °C and 5% CO2. Experiments were performed in cell culture medium or Krebs-Ringer solution (KR) as indicated composed of (in mM) 115 NaCl, 10 HEPES, 4.7 KCl, 2.5 CaCl2, 1.2 KH2PO4, 1.2 MgSO4, 20 NaHCO3, 5 d-glucose and 0.1% albumin or in a physiological salt solution indicated composed of (in mM) 138 NaCl, 10 HEPES, 5 KCl, 1 MgCl2, 2 CaCl2 and 5 d-glucose, both adjusted to pH 7.4 with NaOH.
RNA was isolated using the NucleoSpin RNA Plus kit (Macherey-Nagel, Düren, Germany) and reverse transcription was performed to synthesize cDNA. For the RT-qPCR, 10 ng cDNA was used in the final solution of 10 μL, including the GoTaq qPCR master mix (Promega, Fitchburg, WI, USA) and primers for each aquaporin gene (Supplementary Table 1). The primers were designed using the gene database of NCBI (Bethesda, MD, USA). For absolute DNA quantitation, standards from 102 to 108 copies per sample were used for each isoform (Supplementary Fig. 1). The standards and each sample were determined in technical triplicates and each sample was normalized to the mean cycle threshold (CT) from three tested stable reference genes.
To generate high-resolution images of the AQP8 protein and identify its subcellular localizations, a V5 tag was fused to the C-terminus of the AQP8 cDNA and overexpressed in RINm5F cells using lentiviral transduction. Cells were seeded on glass cover slips overnight, fixed with 2% PFA for 20 min and blocked with 1% BSA in PBS/0.1% TritonX for 1 h. To visualize AQP8, the V5 tag was stained by the primary V5 antibody (1:400) (E10/V4RR, Invitrogen, Carlsbad, CA, USA) in 0.1% BSA in PBS/0.1% TritonX using a Cy3-labelled secondary antibody (1:200) (Dianova, Hamburg, Germany) in 0.1% BSA in PBS/0.1% TritonX. To determine colocalization, the cells were simultaneously antibody-stained either with Con A (Concanavalin A) conjugated with Alexa Flour 488 (C11252, Thermo Fisher Scientific) for 1 h at RT after fixation and before permeabilization for the plasma membrane. The cells that were stained with Con A were also pre-incubated with either 100 μM H2O2 or with 100 μM Bt2cAMP (N6,2′-O-Dibutyryladenosine 3′,5′-cyclic monophosphate sodium salt, D0627, Sigma-Aldrich, St. Louis, MO, USA) for 15 min before fixation. All other immunostainings were performed after the permeabilization and blocking procedure with either the COX IV (cytochrome c oxidase subunit 4) antibody (1:1,000) (#4844; Cell Signaling Technology) for the mitochondria, or with ABCD3 (1:200) ((F1):sc-514728, Santa Cruz Biotechnology, Dallas, Tx, USA) for the peroxisomes, with ERO1LB (1:100) (11261-2-AP, Thermo Fisher Scientific) for the ER (Endoplasmic reticulum), Giantin (1:1000) (PRB-114C, Covance, Princeton, NJ, USA) for the Golgi apparatus, or with Insulin (1:100) (ab7842, abcam, CA, UK). As secondary antibodies for the organelle specific staining, Alexa Flour 488 (1:200) (Dianova) were used. After antibody staining, the cells were stained with 300 nmol DAPI (4′,6-diamidino-2-phenylindole) in PBS for 5 min and embedded in ProLong Glass Antifade Mountant (Thermo Fisher Scientific). Imaging was performed using the Leica SP8 confocal laser scanning microscope (Leica Microsystems, Wetzlar, Germany) equipped with the Leica HCX PL APO 63x/1.40-0.60 oil objective (Leica Microsystems). Excitation was done via diode lasers at 552 nm for the visualization of Cy3, 488 nm for Alexa Flour 488, and 405 nm for DAPI. We used the Leica Application Suite X (LASX) software, version 3.5.7.23225 (Leica Microsystems) to adjust and capture the images also using z-stack imaging of 0.2 μm distances and 8-11 slices. To quantify colocalization, we used JACoP (just another Colocalization Plugin) [32] from Fiji to quantify the Pearson's correlation coefficient of 3D images.
AQP8 cDNA from rat colon RNA origin (accession #: BC081812.1) was amplified by PCR (forward primer: rAQP8-fw – ATTAGAATTCATGTCTGGGGAGCAGACG; reverse primer: rAQP8-rv – CTTCTAGATCACCTCGACTTTAGAATCAGGC) into the EcoRI/XbaI sites of the lentiviral transfer plasmid pLVX-IRES-Neo (Takara Bio Europe, Saint-Germain-en-Laye, France) and sequenced. Lentiviruses were prepared according to Ref. [33]. Stable AQP8 overexpressing cells (AQP8↑) were selected with G418 (4 μg/ml). The recognition site of the sgRNA was designed using the CCTop (CRISPR/Cas9 target online predictor) online tool [34] within the second (sgRNA AQP8) exon (Chr. 1: 193,425,116–193,425,138). The DNA coding for the sgRNA (CGTAGGTCCATACTACACATCGG) was cloned into the lentiviral vector LentiCRISPRv2-mCherry (kind gift from Agata Smogorzewska, Addgene, Watertown, MA, USA; plasmid # 99154; http://n2t.net/addgene:99154; RRID: Addgene_99154) using BsmBI digest followed by the original LentiCRISPRv2 cloning protocol (https://media.addgene.org/data/plasmids/52/52961/52961-attachment_B3xTwla0bkYD.pdf). RINm5F cells were transduced with LentiCRISPRv2-mCherry-sgAQP8 lentivirus with a MOI of 0.2. As the knock-out of APQ8 induced cell death to RINm5F cells in several attempts, a Tet-On system for regulated AQP8 knockdown (AQP8 KD) was established. Silent mutations were introduced into the AQP8 cDNA of the CRISPR/Cas9 recognition site named exogenous AQP8 (AQP8exo). This AQP8exo cDNA was codon optimized for expression in rat cells using the GenScript Codon Usage Frequency Table(chart) Tool (GenScript, Piscataway, NJ, USA) and synthesized by GeneArt Gene Synthesis (Thermo Fisher Scientific) in a way that CRISPR/Cas9-sgAQP8 cannot cut the AQP8exo gene (Fig. 1, Supplementary Table 2). This AQP8exo cDNA was subcloned into the restriction sites BamHI/EcoRI of the Tet-On regulated pLVX-TRE3G vector system (TakaraBio, Kusatsu, Japan) and transduced via lentiviruses into RINm5F Tet3G cells that express the Tet-On 3G transactivator. The Tet-On system was regulated via doxycycline and thus the AQP8exo gene was controllable until the level of leakiness of the system. Tested clones were sequenced (GATC Service by Eurofins Genomics, Ebersberg, Germany) and analyzed by the software ContigExpress (Invitrogen) to identify mutations. DNA sequences were further analyzed by the online tool TIDE (Tracking of Indels by Decomposition, Netherlands Cancer Institute, Amsterdam, Netherlands) to distinguish between homo- and heterozygosity. Respective control cells for the AQP8 overexpression were RINm5F cells termed ‘mock’ were infected with an empty pLVX-Neo vector providing the neomycin resistance. Respective control cells for the AQP8 KD were stably lentiviral infected with the Tet-On system, cultivated without doxycycline and without CRISPR/Cas9 infection and will be referred to as ‘mockTet’.
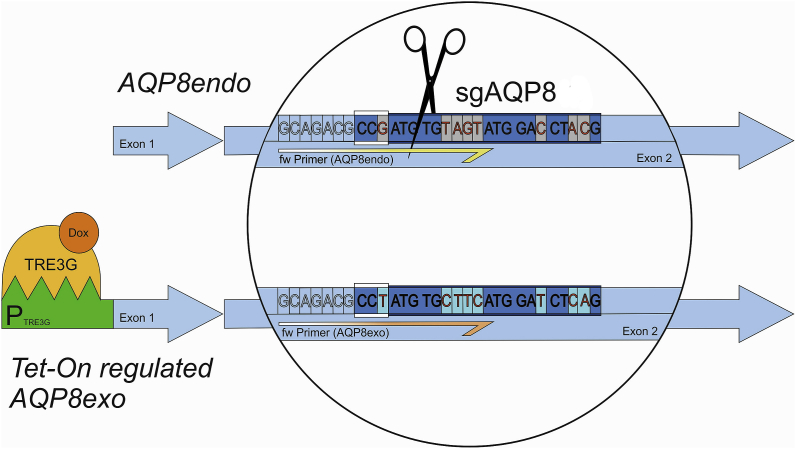
Schematic illustration of AQP8 KD and Tet-On system. The sgRNA sgAQP8 for the endogenous AQP8 gene (AQP8 endo) was designed for CRISPR/Cas9 to target and cut the second exon in this AQP8 gene of insulin-producing RINm5F cells. The recognition motif for CRISPR/Cas9 is shown as a coding sequence in dark blue, with the PAM sequence highlighted by white lines above and below the codon sequence (CCG). Cas9 is symbolized as scissors, showing that it cuts 3 base pairs behind the PAM sequence. In the sgRNA of the AQP8endo sequence, 8 bases in the exogenous AQP8 (AQP8exo) gene were altered. These modified bases are written in red with a gray background in the AQP8endo gene and on a turquoise background in the AQP8exo gene. The silent mutations cause the sgRNA of sgAQP8 not to target the AQP8exo gene, but only the AQP8endo gene. In the lower left corner, the Tet-On regulation of AQP8endo is shown. The promoter PTRE3G (green) is regulated by the TRE3G protein (light orange), which can activate the promoter only upon binding to doxycycline (Dox, dark orange). Specific primers are shown as half arrows in yellow for the AQP8endo gene and in orange for the AQP8exo gene. (For interpretation of the references to color in this figure legend, the reader is referred to the Web version of this article.)
To determine AQP8 protein expression levels in AQP8 overexpressing and KD cells, membrane fractions were isolated as the protein expression is too low for whole cell sample detection. Fresh cells were used for mitochondrial isolation according to Frezza et al., 2007 [35] with some modifications. All steps were performed on ice. In brief, around 1 x 10⁶ cells were homogenized in IBc (buffer for cell and mouse liver mitochondria isolation) with a glass-Teflon potter (80–100 strokes; 100 μL of this lysate fraction was used as loading sample) and centrifuged at 600 g for 15 min at 4 °C to remove nuclear remnants and cell debris. The supernatant was again centrifuged at 9,000 g for 20 min at 4 °C to collect mitochondria in the pellet as loading sample. The protein amount was measured using a Bradford-protein assay. 80 μg of the lysate and of the mitochondrial fractions were loaded into a 12.5% SDS-gel and blotted onto a methanol-activated PVDF-membrane. Subsequently the membrane was blocked by 1% milk for 1 h at room temperature and antibody staining was performed overnight using an AQP8 antibody (1:2500) (Cat# AQP81-A, alpha diagnostic, San Antonio, TX, USA) in 1% milk/PBS/0.1% Tween20. As reference gene COX IV (cytochrome c oxidase subunit 4) antibody (1:1,000) (#4844; Cell Signaling Technology) in 5% milk/TBS/0.1% Tween20 was used. For the protein detection of the AQP8 staining, the ECL substrate WESTAR ANTARES (Cyanagen, Bologna BO, Italien) was incubated for 2 min and to detect the reference genes the Pierce ECL Western Blotting reagents (GE Healthcare, Schenectady, NY, USA) was used for 1 min.
The Cell Proliferation ELISA (colorimetric) kit (Roche Applied Science, Penzberg, Germany) was used to quantify total number cells after 24, 48, 72 and 96 h cultivation. Mock, AQP8↑, mockTet, and AQP8 KD cells were seeded on 96-well plates and, for each clone, 5,000 cells (n = 6) were averaged for each well in a single experiment. Afterwards the assay was carried out according to the manufacturer's manual.
For the measurement of cellular insulin content, 1 x 10⁶ cells were lysed by sonication. Insulin content was determined radioimmunologically against a rat insulin standard. PEG6000 was used to precipitate the antibody-bound insulin. The insulin values were normalized to the DNA content of the cells measured by PicoGreen (Thermo Fisher Scientific).
Stable cell lines expressing HyPer in different cell organelles such as the mitochondria, the peroxisome and a membrane-tagged HyPer construct at the cytosolic face of the ER membrane were generated using lentiviral transduction [36]. For approaches with HyPer located in the cytosol, the NES (nuclear export signal) was employed and with HyPer located in the nucleus, the NLS (nucleus localization signal) was used. For all HyPer variants including the HyPer-7 constructs, 1.5 – 2 x 10⁵ cells were seeded on glass cover slips in 6-well dishes and transfected 24 h–48 h before the experiments using Lipofectamine3000 reagent (Thermo Fisher Scientific) according to the manufacturer's manual. The perifusion experiments with HyPer variants were performed according to Ref. [36] using a IX81 fluorescence microscope (Olympus, Tokyo, Japan). During HyPer-7 experiments, cells were perifused with physiological buffer solution in addition to different concentrations of H2O2 using a PC30 perfusion chamber (Next generation fluorescence imaging, Graz, Austria). For imaging ratiometric H2O2 signals within the cytosol were acquired using the highly sensitive probe: HyPer7.2-NES [37]. This probe was alternately excited at 420/40 nm and 490/15 nm with bandpass excitation filters and the emissions were collected in 3 s intervals using a 535/30 band-pass emission filter. For acquisition control the CellSens Software or Metafluor Software (Molecular Devices, San Jose, CA, USA) was used and obtained over time fluorescence intensities were analyzed (after background subtraction) by using the GraphPad Prism 5 software (San Diego, CA, USA). After recording the HyPer ratio, the curves were analyzed using a custom code in MATLAB R2017a to fit the curves and calculate the first derivative and inflection point and thus the maximal slope of each curve (Supplementary Fig. 5). The advantage of this method is that the inflection point is calculated mathematically accurate and standardized. This helps us to quantify and interpret the permeability of the different cell clones. The inflection point represents the maximum increase of the HyPer ratio over time, which allows us to draw conclusions about the transport capacity at different AQP8 expressions.
For transient overexpression, the coding sequence of AQP8exo was amplified in a PCR reaction using a Q5 High-Fidelity 2X Master Mix (NEB, Ipswich, MA, USA) with primers 5′-AAAGCTAGCATGTCTGGGGAGCAGACGCC-3’ (forward) and 5′-CGCGAATTCCCTCGACTTTAGAATCAGGC-3’ (reverse). The PCR fragment was restricted with NheI and EcoRI endonucleases and cloned in N-terminal fusion with mCherry in a pcDNA3.1 vector. The resulting plasmid, encoding AQP8-mCherry was co-transfected with HyPer7.2-NES and red-emitting AQP8 positive cells were measured in H2O2 imaging experiments with HyPer-NES expressing cells as control.
Data are expressed as means ± SEM, means ± S.D. or as means ± CV%. Statistical analyses were performed by GraphPad PRISM 5 (San Diego, CA, USA) using one-way or two-way ANOVA followed by Bonferroni and two-tailed unpaired Student's t-test.
Despite previous studies providing a relatively good overview of the expression of AQP isoforms in different tissues and cells (reviewed in Ref. [38]) including the pancreas, there currently exists no qPCR-based gene expression analysis of islets of Langerhans or pancreatic β-cell lines. We measured the transcript abundances of the twelve known aquaporin isoforms (AQP0 – 12; AQP10 is not identified in rats) in primary rat pancreatic islets (containing approx. 80% β-cells), in the rat β-cell lines RINm5F and in INS-1E cells. The absolute gene quantification of all aquaporin (AQP) isoforms was determined by RT-qPCR and normalized against three different reference genes using respective primers (Supplementary Table 1) and standards for each AQP isoform (Supplementary Fig. 1). Pancreatic islets and RINm5F cells mostly exhibited similar expression patterns, however, AQP1 and AQP12 expression was not detectable in RINm5F nor INS-1E cells (Fig. 2 A – C). In contrast to pancreatic islets and RINm5F cells, the expression of AQP isoforms 7 and 9 was absent in INS-1E cells. Overall, RINm5F cells from the β-cell lines exhibited the most similar AQP expression profile when compared to pancreatic β-cells and were chosen as a representative model for further experiments. The peroxiporins AQP3 and AQP9 were marginally expressed in the pancreatic β-cell lines (Fig. 2), and there is controversy as to whether isoform AQP5 also serves as H2O2 transporters [19,22]. Nevertheless, peroxiporin AQP11 is highly expressed in RINm5F cells, we chose AQP8 (Fig. 2, black columns) as the focus of further study as AQP8 has already be shown to be expressed in mitochondria of primary rat hepatocytes [39]. Furthermore, cytokine-mediated ROS formation in the mitochondria of pancreatic β-cells plays an important role in the pathogenesis of T1DM [4]. Relatively, AQP8 is highly expressed in islets but there is little understanding of its function in terms of DM and therefore we examine its role as a peroxiporin in insulin-producing cells.
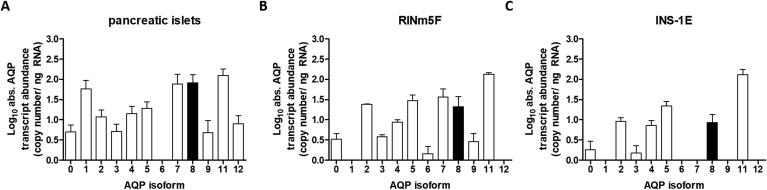
Profiling of absolute AQP transcript abundance. The transcript abundance of aquaporin isoforms was quantified using RT-qPCR. A: primary pancreatic islets of Langerhans from 6 different rats; B: RINm5F cells (n = 4) and C: INS-1E cells (n = 6). Marked in black are the expression levels for AQP8 chosen for further study. Standards for each isoform ranged from 102 to 108 molecules normalized to three different reference genes. Shown are means ± SEM.
Subcellular localization of AQP8 has recently been found to be exclusively within the mitochondrial membrane of murine 3T3-L1 adipocytes [40]. Conversely, another study showed its localization in the plasma and intracellular microsomal membranes of rat hepatocytes [41]. To reconcile this discrepancy, we performed a colocalization analysis within RINm5F cells with AQP8-V5 tag expression. We found that the intracellular AQP8 targeting was contained to plasma and mitochondrial membranes, but neither within the peroxisomal, ER, Golgi apparatus membranes nor inside the insulin vesicles (Fig. 3). Using the Pearson's correlation coefficient, colocalization could be verified at the plasma membrane, especially after H2O2 and Bt2cAMP pre-incubation as well as at mitochondria (Fig. 3).
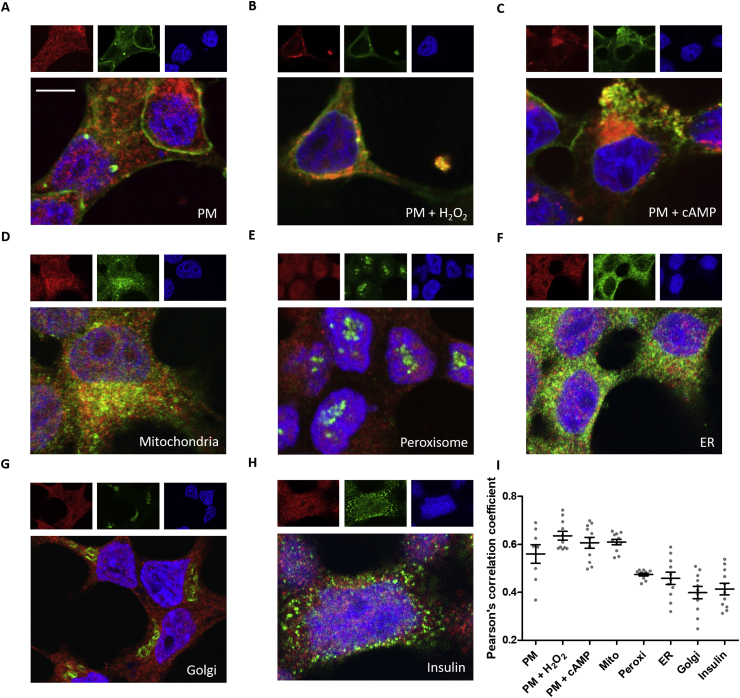
Representative images of confocal laser scanning microscopy and 3D colocalization analysis of AQP8 in different subcellular compartments in RINm5F cells.
RINm5F mock cells expressing an AQP8-V5 tag fusion protein were stained with the V5 antibody (red) followed by counterstaining subcellular and membrane specific localizations (green) and DAPI (blue) before embedding. A-C: The plasma membrane (PM) was stained with Con A conjugated with Alexa Flour 488 before permeabilization in control cells and those that were pre-incubated with 100 μM H2O2 or with 100 μM Bt2cAMP for 15 min. D-H: All other subcellular compartments were stained with a specific antibody. I: Pearson's correlation coefficients of the green and red staining were determined by 3D analysis for each z-stack (8-11 slices) using the JACoP plugin of Fiji. Each dot of the scatter plot represents one single slice including different amount of cells: A: 15, B: 16, C: 6, D: 13, E: 16, F: 25, G: 12, H: 21 also displaying the mean ± SEM. (scale bar: 5 μm). (For interpretation of the references to color in this figure legend, the reader is referred to the Web version of this article.)
To investigate the role of AQP8 in insulin-producing RINm5F cells, we implemented both an overexpression (AQP8↑) and a knockdown (AQP8 KD) model system. For a stable constitutive overexpression, RINm5F cells were lentivirally transduced with the AQP8 cDNA and selected through G418. The approach to knock-out (KO) AQP8 was carried out by the CRISPR/Cas9 technique since downregulation using siRNA could not be verified whereas for other aquaporins (AQP1, -5, -7 and -11), siRNA downregulation has been successful (data not shown). Since multiple trials over a year with both, either CRISPR/Cas9-mediated, or a siRNA-mediated KO with different sgRNAs and siRNAs, never lead to a viable complete knock-out of the peroxiporin AQP8, we realized that RINm5F AQP8 KO β-cells were not surviving during the selection process.
To circumvent this problem, silent mutations were introduced into the AQP8 cDNA and expressed in RINm5F cells. We termed this doxycycline-regulated (Tet-On system) exogenous AQP8 cDNA ‘AQP8exo’. The silent mutations of the AQP8exo variant ensured that only the endogenous AQP8 (AQP8endo) expression was inhibited by subsequent CRISPR/Cas9-mediated knock-out (Fig. 1 and Supplementary Table 2A). The leakiness of the Tet-On promoter/regulator system resulted in an AQP8exo expression level that corresponded to 43% of the AQP8endo expression. Thus, an AQP8 knockdown of about 60% could be achieved in the absence of doxycycline in the culture media. This technique enabled survival of endogenous AQP8 knock-out cells (Supplementary Table 2B). To exclude off-target effects, potential genes were sequenced after about a year of cultivation. Remarkably these genes contained at least 4 base pair mismatches in comparison to the AQP8-specific sgRNA, and thus mispriming of the AQP8 sgRNA was highly improbable. Nevertheless, 200 to 250 bp regions of genomic DNA flanking the potential sgRNA binding sites of the genes were amplified by PCR from AQP8 KD cells as well as from mock Tet-On control cells (mockTet) and analyzed by sequencing. No Off-target effects were detected (Supplementary Table 3). For validation of the Tet-On system, specific primer pairs for the detection of AQP8exo and AQP8endo were designed within the recognition site of CRISPR/Cas9 enabling a differentiation of the target gene on the mRNA expression level (Supplementary Fig. 2A). Tet-On regulation of the AQP8exo gene expression was optimized by application of different doxycycline concentrations (Supplementary Fig. 2B) and the resulting stable knockdown of AQP8 (AQP8 KD) cells were monitored by sequencing (Supplementary Table 2B).
Whereas the AQP8 KD showed similar expression to AQP8exo compared to its mockTet, the AQP8endo expression was below detection limit in AQP8 KD. In contrast, AQP8↑ cells showed a significantly higher AQP8endo gene expression (p ≤ 0.001) compared to its mock control cells, and the AQP8exo expression was also below expression limit (Fig. 4A). The Western blot analysis of lysate and mitochondria samples revealed only detection of AQP8 in AQP8↑ cells, but neither in both mock controls nor in AQP8 KD cells, most likely due to limits in antibody sensitivity (Fig. 4B). Similar to previous findings, we observed double bands for the AQP8 protein indicating an N-glycosylated and non-glycosylated form of this protein [[41], [42], [43]]. The isolation of the mitochondrial fractions reveals a clear AQP8 protein expression in this cell compartment.
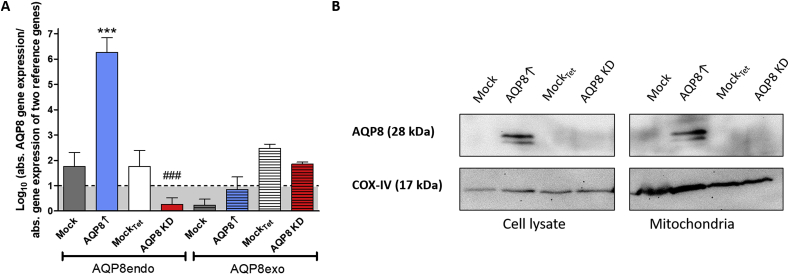
Generation of stable AQP8 overexpression and AQP8 KD cell line. A: AQP8endo and AQP8exo genes were absolutely quantified by RT-qPCR and normalized over three reference genes. Absolute transcript abundance of AQP8endo and AQP8exo in AQP8 overexpressing RINm5F cells and AQP8 KD cells was determined. The data below the dashed line and shaded in grey represents measurements below the detection level (log10 values < 1 corresponds to a CT value of 37.5 for AQP8endo and 34.5 for AQP8exo). Shown are means ± SEM of 4 experiments. ***p ≤ 0.001 compared to mock; ###p ≤ 0.001 compared to mockTet; unpaired two-tailed t-test. B: Representative Western blots of cell lysates and mitochondrial fraction of AQP8↑ and AQP8 KD vs mock control RINm5F cells are depicted (upper blot). COX-VI was used as a loading control and mitochondrial marker.
AQP8 has been shown to amplify cell growth factor signaling in various cell types [[44], [45], [46], [47]]. Accordingly, we found that RINm5F cells with AQP8 overexpression exhibited a significantly faster cell growth (p ≤ 0.001) compared to their mock control after 96 h of monitoring and AQP8 KD proliferated significantly slower (p ≤ 0.001) compared to mockTet controls at all three days of monitoring the proliferation rate (Fig. 5A). Moreover, it has previously been shown that H2O2 also accompanies glucose stimulated insulin secretion [48,49]. The insulin contents within the four AQP8 RINm5F expression systems were determined by radioimmunoassay and interestingly AQP8↑ showed significantly higher (p ≤ 0.01) insulin content compared to mock controls (Fig. 5B). Furthermore, the cell size and volume were found to be slightly larger for AQP8↑ cells compared to all other cell lines (Supplementary Fig. 3) [64]. To investigate the potential role of AQP8 in detoxification of H2O2, cell viability was determined under incubation with various extracellular H2O2 concentrations ranging from 10 to 60 μM for 2 h. These experiments revealed similar H2O2 toxicity in AQP8↑ and AQP8 KD cells when compared to their corresponding mock control cells (Supplementary Fig. 4) [65].
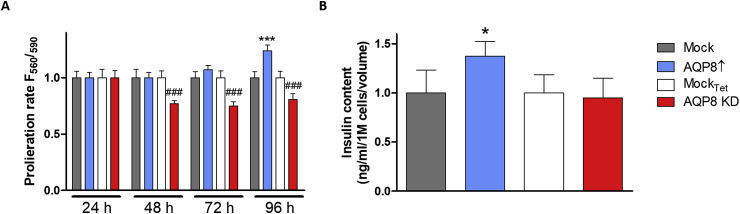
Cell proliferation and insulin content in insulin-producing RINm5F AQP8 overexpressing and AQP8 KD cells. A: Total number of proliferating RINm5F AQP8 overexpressing and AQP8 KD cells were quantified and compared with respective mock controls. Shown are means ± CV% of 3 independent experiments. ***p ≤ 0.001 compared to mockTet; ###p ≤ 0.001 compared to mockTet;. B: Insulin content within the different AQP8 expressing RINm5F cell models. *p ≤ 0.05 compared to mock; ANOVA followed by Bonferroni, mean ± CV%, n = 5–6.
Given that H2O2 plays an important role in the pathogenesis of type 1 diabetes mellitus [4,8], we monitored the flux of H2O2 over time in AQP8↑ cells. AQP8↑ cells and their corresponding mock controls, were co-expressed with HyPer, a genetically encoded H2O2 selective fluorescence sensor protein, in different cellular localizations. Each HyPer-variant targets one of six different intracellular sites (untargeted, cytosol, nucleus, peroxisome, mitochondria, and the cytosolic face of the ER membrane). Cells were perifused with 20 μM H2O2. Images of cells expressing HyPer in different localizations are depicted in groups with their HyPer-ratio-over-time-curves (Fig. 6A–C and E-G) for each HyPer variant. To mathematically characterize the curve (Supplementary Fig. 5), single cell responses were normalized and averaged for each experiment to subsequently fit the data and calculate the maximal slope (Fig. 6J, K and L). Untargeted HyPer-slope results are approx. 1.7-fold faster (p ≤ 0.05) in AQP8↑ cells compared to mock control cells. HyPer was located only in the cytosol whereas the untargeted HyPer variant showed a faster increase in AQP8↑ compared to their mock controls (approx. 2.2-fold faster; p ≤ 0.01). On the other hand, the nuclear site showed similar curve features, indicating that the combination of both cytosolic and nuclear site quenches the larger cytosolic effect in the untargeted HyPer response. In peroxisomes, the AQP8↑ cells showed 5.1-fold faster (p ≤ 0.001) H2O2 responses, whereas in mitochondria a 1.5-fold faster (p ≤ 0.05) response was recorded, and at the cytosolic face of the ER membrane the slope of AQP8↑ cells was approx. 4.9-fold higher (p ≤ 0.001) when compared to the mock control (Fig. 6J and K). In experiments with DAAO overexpression, application of 20 mM d-Alanine in perifusion ensured robust endogenously derived H2O2 from distinct intracellular locales enabling the determination of the transfer rate to the cytosol. While the cytosolic HyPer-ratio curves of AQP8↑ cells compared to their mock control cells showed similar characteristics in case of the peroxisomal and ER H2O2 production (Fig. 6G, I and L), the H2O2 flux generated in the mitochondria showed a clear AQP8 expression dependence. HyPer-ratio-over-time-curve in terms of the slope (approx. 2.4-fold faster; p ≤ 0.01) and also when considering the time of the first HyPer response (Fig. 6H and L).
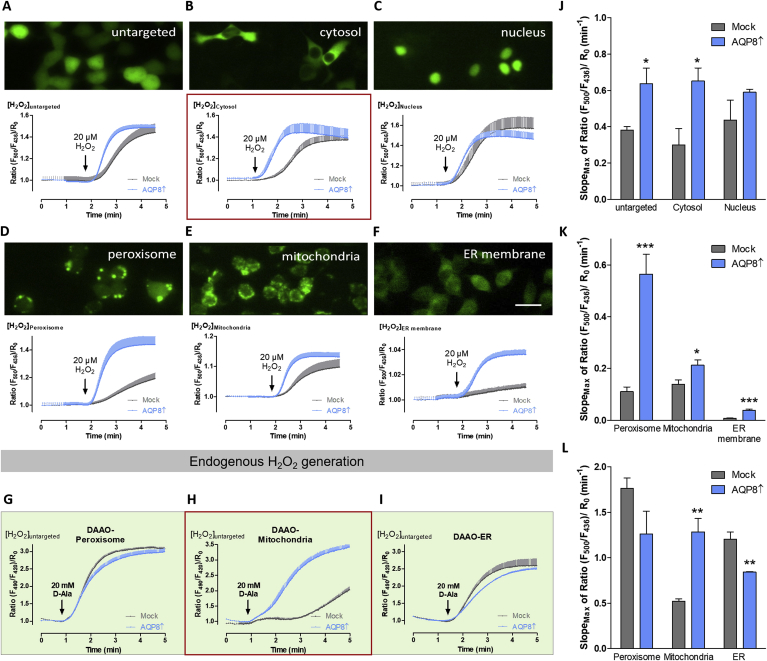
HyPer response in different cell compartments of RINm5F AQP8 overexpressing cells. A-F: Images of RINm5F mock cells and AQP8↑ expressing ratiometric H2O2 sensitive HyPer in different cell localizations visualized at 400 x magnification (scale bar: 20 μm) are shown. Ratiometric HyPer response is displayed located in different cell compartments in RINm5F cells with AQP8↑ (blue) and the respective mock control (grey) after perifusion of 20 μM exogenous H2O2; mean ± SEM, n = number of independent experiments/total cell number for n = 4/44 (Mock; A), n = 4/69 (AQP8↑; A), n = 3/19 (Mock; B), n = 3/6 (AQP8↑; B), n = 5/19 (Mock; C), n = 6/12 (AQP8↑; C), n = 3/113 (Mock; D), n = 3/71 (AQP8↑; D), n = 3/31 (Mock; E), n = 3/41 (AQP8↑; E), n = 3/15 (Mock; F), n = 3/37 (AQP8↑; F). G–I: HyPer-ratio-over-time-curves of DAAO expressing cells in different organelles upon perifusion of 20 mM d-Alanine (D-Ala); mean ± SEM, n = 5/99 (Mock; G), n = 6/124 (AQP8↑; G), n = 3/22 (Mock; H), n = 3/32 (AQP8↑; H), n = 3/79 (Mock; I), n = 3/102 (AQP8↑; I). J–L: Maximal slopes of HyPer ratio in different cell localizations are shown. *p ≤ 0.05 compared to mock; **p ≤ 0.01 compared to mock; ***p ≤ 0.001 compared to mock; unpaired two-tailed Student's t-test, mean ± SEM, n = 3–6. (For interpretation of the references to color in this figure legend, the reader is referred to the Web version of this article.)
To elucidate the potential function of AQP8 as a peroxiporin in insulin-producing RINm5F cells, HyPer-7.2 was expressed in the cytosol (NES = nuclear export signal) in AQP8↑ cells and AQP8 KD cells. In HyPer experiments (using the first generation of the fluorescence sensor), differences between AQP8 KD compared to mocktet cells could not be identified; however, when using the more sensitive HyPer-7.2 H2O2 probe, the role of AQP8 in KD cells became apparent. To study the minimal and maximal limits in cells with different AQP8 levels, stepwise increasing H2O2 concentrations ranging from 0.3 to 100 μM were applied over time and the HyPer ratio was monitored as a measure of AQP8 dependent H2O2 transfer across the plasma membrane (Fig. 7A). Hence, the normalized HyPer-7.2 ratios were significantly different at increasing H2O2 concentrations. The HyPer-7.2 response was significantly higher in AQP8↑ (p ≤ 0.001 at 3 and 10 μM) and significantly lower in AQP8 KD cells (p ≤ 0.001 at 10 μM) when compared to their corresponding mock controls (Fig. 7A). Since basal ratio and maximal HyPer-7.2 response was similar among the four cell types, the maximum in response to 100 μM was defined as 100% and the logarithmic concentration curves revealed a clear AQP8-dependent difference in H2O2 response (Fig. 7B). Accordingly, the half-maximal effective concentration (EC50) was significantly lower (p ≤ 0.05) for AQP8↑ and significantly higher (p ≤ 0.05) in AQP8 KD cells when compared to both mock controls (Fig. 7C). In addition, AQP8 was transiently co-expressed with HyPer7.2-NES in mockTet cells and AQP8exo in AQP8 KD cells in order to confirm enhanced H2O2 permeability in AQP8 rescue experiments. Surprisingly, in comparison to the stable AQP8↑, the transient acute AQP8 overexpression resulted in a higher H2O2 conductance as the HyPer-NES ratio was already saturated upon application of 3 μM extracellular H2O2 (Fig. 7D). After 3 μM and 10 μM of H2O2 perifusion, the transiently AQP8 overexpressed mockTet and AQP8 KD variants showed significantly (p ≤ 0.001) higher maximal HyPer-7.2 ratios when compared to their controls without transient AQP8 overexpression. At 100 μM H2O2, the HyPer-7.2 responses were saturated in all considered cell variants. Moreover, the significantly higher concentration (p ≤ 0.001 at 10 μM) that is needed for the AQP8 KD to achieve its half-maximal effective concentration (EC50) (Fig. 7C), again has been verified as the AQP8 KD showed a significantly lower maximal ratio (p ≤ 0.01) compared to its mockTet control upon 10 μM H2O2 application (Fig. 7D).
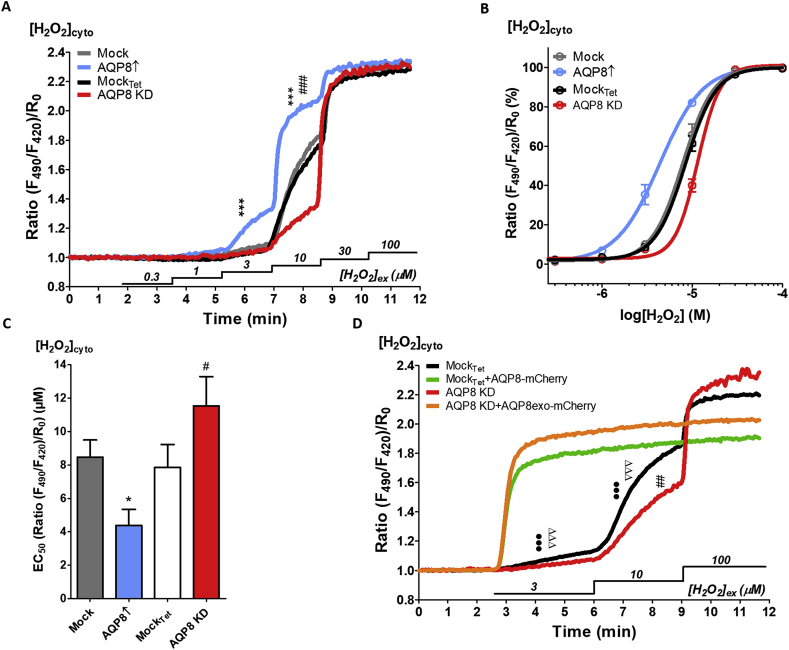
HyPer7.2 response in insulin-producing RINm5F cells expressing different levels of AQP8 and AQP8 KD rescue by AQP8-mCherry fusion protein. A: Representative curves of fluorescence-ratios of cytosolic HyPer7.2 expressing cells to stepwise increase of exogenous H2O2 concentrations. ***p ≤ 0.001 compared to mock; ###p ≤ 0.001 compared to mockTet; ANOVA followed by Bonferroni post-hoc test at indicated H2O2 levels, mean ± SEM (n = 3). B: Concentration response curves in differentially expressing AQP8 RINm5F cells responding to H2O2 concentrations in a range from 0 to 100 μM. The maximal HyPer7.2-NES ratio signal was defined as 100%, mean ± SEM (n = 3). C: The EC50 values represent the concentration of H2O2 necessary for the sensor to show half-maximal response, data observed in B. Shown are mean ± S.D.; *p ≤ 0.05 compared to mock and #p ≤ 0.05 compared to mockTet; ANOVA followed by Bonferroni, n = 3 experiments of n = 77 cells (mock), n = 79 cells (AQP8↑), n = 86 cells (mockTet) and n = 50 cells (AQP8 KD). D: Average curves of H2O2 imaging in RINm5F Tet-On control (black curve) or AQP8 KD (red curve) cells with respective overexpression of AQP8-mCherry (MockTet + AQP8mCherry, green curve; AQP8 KD + AQP8exo-mCherry, orange curve). Cells were imaged 40–48 h post transfection using HyPer-7.2-NES upon subsequent applications of 3, 10 and 100 μM H2O2. Shown are means ± S.D. of mockTet cells (n = 37/4), mockTet with AQP8-mCherry overexpression (34/4); AQP8 KD (25/3) and of AQP8 KD cells overexpressing AQP8exo-mCherry (37/3). ##p ≤ 0.01 AQP8 KD compared to mockTet; •••p ≤ 0.001 AQP8-mCherry overexpression compared to mockTet and ΔΔΔp≤0.001 AQP8exo-mCherry overexpression compared to AQP8 KD at distinct H2O2 levels; ANOVA followed by Bonferroni. (For interpretation of the references to color in this figure legend, the reader is referred to the Web version of this article.)
Hydrogen peroxide is an important biological reactive oxygen species, which can serve as a signaling molecule at low concentrations (1–10 nM) and can damage cells and tissues at higher concentrations (>100 nM) [2,3]. Pancreatic β-cells are characterized by an intrinsic sensitivity towards oxidative stress owing to a relative lack of antioxidative defense equipment [5] when compared to other tissues and cells [10,11]. In particular, an imbalance between a high capacity for H2O2 generation and a low capacity for H2O2 inactivation is the main driving force of oxidative stress sensitivity [4] that subsequently leads to β-cell death in T1DM and T2DM.
In both eustress and disstress [2], i.e., when H2O2 functions as a signaling molecule or for its detoxification respectively, the role of H2O2 membrane permeability might be important for reducing the toxic concentration to a physiological state. The transport of H2O2 within the cell, between subcellular compartments and across membrane boundaries, is necessary for localization at the site of action or detoxification. In this study, we focused on the peroxiporin AQP8, that belongs to a subgroup of aquaporins and are characterized by their capacity to transport H2O2 across membranes.
We first measured the gene expression profiles of all known aquaporin isoforms using absolute RT-qPCR in rat cells for the first time. In HeLa cells, the peroxiporins AQP3, AQP8 and AQP9 [42] have been shown to be localized in the plasma membrane, whereas AQP11 has been found in the ER membrane [50]. In primary rat liver cells, AQP8 has been observed to play an important role in the water homeostasis in the mitochondria as it is located in the inner mitochondrial membrane in these cells [39]. In insulin-producing cells, the role of peroxiporins has not been studied yet. Thus, we decided to characterize AQP8 for a detailed analysis of the hydrogen peroxide membrane transport in insulin-producing cells. Since the expression profile of the β-cell line RINm5F showed the highest conformity with the profile of isolated pancreatic islets of Langerhans, this cell line was chosen as a model to analyze the effects of an AQP8 overexpression or knockdown in pancreatic β-cells.
We found that AQP8 expression is essential for the viability of RINm5F cells. Several tries to knock-out AQP8 by CRISPR/Cas9 technique resulted in the death of the genetically modified cells after approx. ten days (data not shown). The attempt to reduce AQP8 expression by siRNA also failed for three different siRNAs (data not shown). To overcome the problem of lethality after AQP8 knock-out, we first inserted silent mutations into the AQP8 cDNA in the region complementary to the sgRNA of the CRISPR/Cas9 system and expressed this cDNA in the RINm5F cells under the control of a doxycycline-regulated promoter. With this technique we were able to knock out specifically the endogenous wild-type AQP8 gene by CRISPR/Cas9 without effecting the doxycline-regulated recombinat AQP8 expression. Due to the leakiness of the Tet promoter, the AQP8 expression reached a level of about 43% of the wild-type AQP8 expression, without the addition of doxycycline. This expression level was sufficient to stabilize the cells in culture. In general, the combination of a Tet-On-regulated expression of a silent mutated gene of interest with a subsequent CRISPR/Cas9-mediated gene knock-out of the wild-type gene is an interesting method, if classical approaches like siRNA-mediated downregulation and/or a complete knock-out are not feasible.
Due to the poor binding of the AQP8 antibodies that we tested and a relatively low protein expression, the intracellular AQP8 localization could not be visualized directly by a constitutive AQP8 expression nor in our cells that overexpress AQP8. The expression of AQP8 as a fusion protein with the V5 tag enabled us to enlighten the subcellular AQP8 distribution. In RINm5F cells, confocal immunofluorescence images showed a localization of AQP8 in the plasma membrane, and the mitochondrial membrane, but neither in the peroxisomal, nor the insulin vesicle, the Golgi apparatus, nor the ER membrane. In accodance to the images, 3D analyses revealed colocalizaiton of AQP8 and the plasma membrane and the mitochondria. These results verify the findings of other cell types like B cells for the plasma membrane [47] or rat hepatocytes for mitochondrial membranes [39]. Additionally, we could observe an enrichment of AQP8 for the plasma membrane after stimulation with a cAMP derivitave similar to the findings in hepatocytes [41]. Interestlingly, we could also find an AQP8 enrichment in the plasma membrane after H2O2 incubation, that might facilitate the H2O2 in-or efflux. Hence, one could hypothesize that AQP8 is integrated into the plasma membrane on demand if the H2O2 concentration increases.
We showed that an AQP8 overexpression in RINm5F cells results in increased HyPer responses in the cytosol and also in the mitochondria, in the peroxisome and at the ER membrane in perifusion experiments with exogenous H2O2. The importance of the peroxiporin AQP8 for the plasma membrane in insulin-producing cells is clear when looking at the HyPer measurements; the HyPer-NES response increased over time in AQP8↑ cells. In HyPer-7.2 experiments the AQP8-dependent H2O2 transport was shown clearly in both AQP8↑ as well as in AQP8 KD cells. We found that the HyPer response is dependent on the AQP8 expression level; a lower AQP8 expression requires an increased H2O2 concentration for the HyPer sensor to react (Fig. 7C, 4.35 μM H2O2 for AQP8↑ cells vs. 11.5 μM H2O2 for AQP8 KD cells). The dose-response data reported in Fig. 7 reinforces and extends previous findings as in plants, aquaporin homologs show transport of metalloids in a concentration-dependent manner [51] and in HeLa cells the H2O2 transport capacity of the plasma membrane was shown to function in an AQP8-dependency [43,45,52]. This finding is in line with the immunofluorenscence analysis of RINm5F cells incubated with H2O2 where we observed an increase of AQP8 in the plasma membrane in comparison to untreated cells.
For the AQP8 relevance in mitochondria, this peroxiporin was already shown to play a role in liver isolates of rat [39]. As we investigated the mitochondrial H2O2 permeability, we also found that there is a faster HyPer-mito response over time in AQP8↑ cells when compared to mock control cells indicating a higher permeability through the mitochondrial membrane in an AQP8-dependent manner. This could be clearly displayed with exogenously perifused as well as endogenouly DAAO-generated H2O2 in mitochondria by HyPer experiments. Appropriately, AQP8 was also seen to colocalize in mitochondria in the fluorescence images and it could be detected in the mitochondrial fraction of the Western blot, also confirming previously published data for HeLa cells [42,43]. Furthermore, we analyzed all aquaporin C-termini using the multiple alignment tool PSI/TM-Coffee [53], that we visualized using ESPript - https://espript.ibcp.fr [54]. There are several import machineries for mitochonrial proteins described [55]. For AQP8, we found that the C-terminus is ending with an α-helix comprising amino acids with a positive net charge as possible mitochondrial targeting signal. This helical topology at the C-terminus in combination with a noticeable positive charge is unique for the peroxiporin AQP8 compared to all other aquaporins (Supplementary Table 4). Even though, the typical mitochondrial peptide signal is classically descriped to be located at the N-terminus, we assume that the mitochondrial targeting for AQP8 could be located at the C-terminus. All these findings stronly suggest that AQP8 is localized in the inner or/and outer mitochondrial membrane in insulin-producing β-cells. Consequently, our results indicate that AQP8 is an important peroxiporin for both channeling H2O2 as a signaling molecule and in removing toxic concentrations of H2O2 from the mitochondria in insulin-producing cells, particularly in T1DM.
Given that the HyPer perifusing experiments display different results for the peroxisomes and the ER membrane depending on whether H2O2 was added from the outside or is generated from the inside, it is important to realize that exogenous H2O2 always has to pass the plasma membrane to reach other organelles with their own membranes. Hence, a H2O2 permeability in an AQP8-dependent manner can only be clearly revealed if H2O2 passes just one membrane before it reaches the HyPer sensor. The concentration gradient between the cytosol and the peroxisome drives the H2O2 transport into the peroxisomes [56]. Our confocal microscopy images and the HyPer experiments with DAAO-endogenously generated H2O2 confirms that AQP8 seems to play no role in the peroxisomal membrane. It is postulated that unspecific transporters such as PXMP2 facilitate a passive H2O2 transport into the peroxisomes [57]. These findings are supportive for the theory of the peroxisome functioning as a deep sink for H2O2 and thus a high H2O2 transport capacity [2].
At the cytosolic face of the ER membrane the HyPer experiments show a generally weak HyPer response indicating a basal oxidation of the HyPer protein. This could be explained by the high H2O2 generation in the ER during insulin biosynthesis that oxidizes HyPer by leaving the ER lumen. Generally, the maximal Hyper ratio after H2O2 perifusion depends on the basal oxidation status of the HyPer protein that correlates with the oxidation level of the observed compartment [58]. AQP8 overexpression shows a faster HyPer response compared to mock cells at the cytosolic face of the ER membrane indicating a faster H2O2 influx through the plasma membrane. In line with our previous findings, the AQP8 dependency in the ER vanishes when H2O2 is generated endogenously by the catalytic oxidation of d-alanine inside those organelles. Thus, our findings – immunofluorescence confocal imaging and HyPer-perifusion experiments – reveal that AQP8 does not play an important role for the H2O2 transport at the ER membrane in insulin-producing RINm5F cells.
The HyPer response in the nucleus is also not AQP8 dependent as the AQP8↑ cells show similar HyPer ratios and slopes in mock cells accordingly. While the effects of all other considered compartments could also be explained by the increased H2O2 permeability of the plasma membrane in AQP8↑ cells, this effect is not transferred to the nucleus. Our HyPer-NLS experiments show that the AQP8 overexpression does not affect the HyPer signal in the nucleus. H2O2 should be able to diffuse freely through the nuclear pore complex that allows molecules up to 40 kDa to pass through [59,60]. However, we probably cannot measure HyPer signals because of the highly reductive milieu in the nucleus, that is responsible for the immediate degradation of H2O2 here. This reduction is mediated by glutathione and thioredoxin-1, among other reductants, to protect the DNA against oxidative stress [61].
The effect of AQP8 downregulation appears to differ depending on the cell type. In adipose and hepatic cell lines a knockdown of AQP8 was found to induce severe ROS-mediated mitochondrial dysfunction most likely caused due to insufficient mitochondrial H2O2 release [40,62], whereas in leukemia cells AQP8 driven H2O2 transport is accompanied by cell growth, adhesion and migration [44,45]. Since proliferation in AQP8 KD RINm5F cells was found to be significantly reduced, the present work suggests that AQP8 serves as a fundamental H2O2 transmitter in pancreatic β-cells mediating essential ROS regulated biological pathways. Our data supports the hypothesis of an AQP8 facilitated intracellular H2O2 transport; we show that it both promotes downstream protein kinase circuited proliferation, and, in severe oxidative stress situations, excessive H2O2 cannot be extruded by AQP8 leading to cell growth arrest and ROS induced cell death [45]. In T1DM such apoptotic pathways are predominantly caused by the inflammatory effects of cytokines within β-cells [4,8,63]. We hypothesize that AQP8 facilitates the transport of H2O2 from its intracellular site of production such as in the mitochondria after cytokine attack in T1DM. As a result, fewer hydroxyl radicals (•OH) could be generated via the Fenton reaction [25] inside the mitochondria leading to a later, or at least reduced, mitochondrial dysfunction. The toxicity of H2O2 (distress) via mitochondrial •OH formation could be reduced in pancreatic β-cells as H2O2 could be diluted in the cytosol or even transferred from β-cells to cells with better equipped antioxidative enzymes. Thus, again less •OH could be generated in the Fenton reaction in the mitochondria and protects the cells in terms of T1DM.
The increased quantitative H2O2 transport of the AQP8↑ also facilitated a kinetically faster H2O2 transfer, particularly to those intracellular regions with confirmed AQP8 membrane localization. Our results suggest that facilitated H2O2 signaling in AQP8 overexpressing β-cells may lead to augmented insulin content (eustress). Further studies are necessary to prove a link between AQP8-mediated H2O2 signaling and insulin production. In summary, the generation of differentially expressing AQP8 RINm5F cells displays a suitable model system to further study the consequences of AQP8 modulating H2O2 signaling.
Our results highlight the fundamental role of AQP8 in RINm5F cells, particularly in the plasma and the mitochondrial membrane. Thus, the verified AQP8 derived H2O2 transport function may serve as an essential contributor for β-cell physiology as well as pathophysiology.
OO is co-founder of Zellmechanik Dresden GmbH distributing Real-Time Deformability Cytometry. The other authors report no conflict of interest.
CK, MWW, JK, TP, TM and ME participated in the conception of the experimental designs. CK, MWW and JK conducted all experiments together with TP and YK and OO. CK, JK and MWW analyzed and interpreted the results together with TM and ME. CK, MWW and ME wrote the manuscript and TM and JK critically revised the content. All authors approved the final version of the paper.
The authors declare the following financial interests/personal relationships which may be considered as potential competing interests: Oliver Otto is co-founder of Zellmechanik Dresden GmbH distributing Real-Time Deformability Cytometry. The other authors declare no conflict of interest.
1
2
4
6
8
9
10
11
12
13
14
15
16
17
18
19
20
21
22
23
24
25
26
27
28
29
30
31
32
33
34
35
36
37
38
39
40
41
42
43
44
45
46
47
48
49
50
51
52
53
54
55
56
57
58
59
60
61
62
63
64
We are grateful to Martin Wirth, Anke Possler, and Britta Leß for their skillful technical assistance; Philipp Krüger for writing the Matlab code to evaluate HyPer measurements; Robert Peach as well as Henrik Pinholt for proofreading, and Anja Münster-Kühnel and Elina Kats for their technical support for the revision of manuscript. This study was funded by the
 AQP8 is a crucial H2O2 transporter in insulin-producing RINm5F cells
 Facebook
 Twitter
 Linkedin
 Whatsapp
