 Apolipoprotein E deficiency induces a progressive increase in tissue iron contents with age in mice
Redox Biology

Co-1st Authors.

- Altmetric
Association of both iron/hepcidin and apolipoprotein E (ApoE) with development of Alzheimer disease (AD) and atherosclerosis led us to hypothesize that ApoE might be required for body iron homeostasis. Here, we demonstrated that ApoE knock-out (KO) induced a progressive accumulation of iron with age in the liver and spleen of mice. Subsequent investigations showed that the increased iron in the liver and spleen was due to phosphorylated extracellular regulated protein kinases (pERK) mediated up-regulation of transferrin receptor 1 (TfR1), and nuclear factor erythroid 2-related factor-2 (Nrf2)-dependent down-regulation of ferroportin 1. Furthermore, replenishment of ApoE could partially reverse the iron-related phenotype in ApoE KO mice. The findings imply that ApoE may be essential for body iron homeostasis and also suggest that clinical late-onset diseases with unexplained iron abnormality may partly be related to deficiency or reduced expression of ApoE.


•
Apolipoprotein E deficiency induces a progressive increase in tissue iron contents with age in mice.
•ApoE−/− induced a progressive accumulation of iron with age in the liver and spleen of mice.
•The increased iron was due to upregulation of TfR1 and downregulation of Fpn1.
•Replenishment of ApoE could partially reverse the iron-related phenotype in ApoE KO mice.
•ApoE may be essential for body iron homeostasis.
Abbreviations
| Aβ | β-amyloid |
| AD | Alzheimer disease |
| ApoE | Apolipoprotein E |
| ApoE−/− | Apolipoprotein E knock-out mice |
| BMP6 | Bone morphogenetic protein 6 |
| CSF | Cerebrospinal fluid |
| DFO | Desferrioxamine; |
| DMT1 | Divalent metal transporter 1 |
| ELISA | Enzyme-linked immunosorbent assay |
| EPO | Erythropoietin; ErkExtracellular regulated protein kinases |
| FAC | Ferric ammonium citrate |
| Fpn1 | Ferroportin 1 |
| FTH | Ferritin heavy chain |
| FTL | Ferritin light chain |
| GFAAS | A graphite furnace atomic absorption spectrophotometer |
| HFE | Hemochromatosis |
| IL-6 | Interleukin-6 |
| IRP1 | Iron regulatory protein 1 |
| IRP2 | Iron regulatory protein 2 |
| IRPs | Iron regulatory proteins |
| MCI | Mild cognitive impairment |
| Nrf2 | Nuclear factor erythroid 2-related factor-2 |
| PBS | Phosphate buffered saline |
| pERK | Phosphorylated extracellular regulated protein kinases |
| STAT3 | Signal transducer and activator of transcription 3 |
| TfR1 | Transferrin receptor 1 |
| TLR-4 | Toll-like receptor |
| WT | Wild-type |
Introduction
Apolipoprotein E (ApoE) is a 34 kDa glycoprotein containing 299 amino acids, and mediates hepatic and extrahepatic uptake of plasma lipoproteins and cholesterol efflux from lipid-laden macrophages [1]. In humans, there are three structurally different ApoE isoforms, named ApoE2, ApoE3, and ApoE4, which are the products of the ε2, ε3 and ε4 alleles [2]. Peripherally, the majority of ApoE in plasma is derived from hepatocytes. In the brain, ApoE is produced mainly by astrocytes, and astrocyte-derived ApoE is pivotal for cerebral cholesterol metabolism and clearance of β-amyloid (Aβ), a major pathological hallmark of Alzheimer disease (AD) [3].
A number of clinical and experimental studies have shown that ApoE or ApoE deficient (ApoE−/-) and iron both were associated the development of AD [4,5] and atherosclerosis [[6], [7], [8]]. Studies in vitro have demonstrated that iron has a role in regulating ApoE expression and secretion in different types of cells [9,10]. In addition, toll-like receptor (TLR-4) and inflammatory factors including interleukin-6 (IL-6) has been found to play an important role in the regulation of hepcidin (a principal regulator of iron metabolism) expression, thus affecting systemic iron homeostasis [[11], [12], [13]], while ApoE has been demonstrated to be closely linked with both pro-inflammatory and anti-inflammatory cytokines [14,15], being able to inhibit TLR-4-mediated macrophage or glial activation and to suppress IL-6 and other inflammatory factors in vitro and in vivo [[16], [17], [18]].
These findings led us to hypothesize that ApoE might be required for body iron homeostasis. To test this possibility, we first investigated a number of iron-related parameters, including ferritin in the serum and iron contents and ferritin light chain (FTL) expression in the liver and spleen of homozygous (ApoE−/-) knockout and wild-type (WT, ApoE+/+) mice. We then dissected the changes in the expression of key contributors to cell and tissue iron balance, major cell-iron importer transferrin receptor 1 (TfR1) and iron exporter ferroportin 1 (Fpn1), and subsequently the key molecules involved in the control of TfR1 and Fpn1 expression, including iron regulatory proteins (IRPs), hepcidin and nuclear factor erythroid 2–related factor-2 (Nrf2), as well as the molecules regulating hepcidin, such as BMP6 (bone morphogenetic protein 6), IL-6, phosphorylated extracellular regulated protein kinase (pErk) and erythropoietin (EPO) in the liver and spleen. To find out whether the impact of ApoE deficiency on iron homeostasis is associated with the changes in iron absorption in the intestine, we then examined divalent metal transporter 1 (DMT1) and Fpn1 expression in the intestine of ApoE KO and WT mice. To confirm the essential role of ApoE in iron homeostasis, we finally performed rescue experiments by replenishing ApoE in mutant mice. Our findings imply that ApoE may be essential for body iron homeostasis.
Materials and methods
Materials
Unless otherwise stated, all chemicals were obtained from the Sigma Chemical., St. Louis, MO, USA. Mouse anti-human TfR1, Alexa Fluor 488 goat anti-rabbit IgG, TRIzol reagent, RPMI-1640 medium and fetal bovine serum were purchased from Invitrogen Life Technologies, Carlsbad, CA, USA; rabbit polyclonal anti-mouse Fpn1 from Novus Biologicals, Littleton, CO, USA; rabbit polyclonal anti-FTL and anti-DMT1 from Proteintech, Chicago, IL, USA; rabbit anti-IRP1, rabbit anti-IRP2, rabbit anti-ApoE, F4/80 antibody and rabbit anti-Nrf2 antibody from Abcam, Cambridge, MA, USA; mouse anti-total p44/42-mitogen-activated protein kinases (MAPK) and rabbit anti-phosphorylated p44/42 MAPK (Thr202/Tyr204) polyclonal antibodies from Cell Signaling Technology Inc., Beverly, MA, USA; Goat anti-IRDye 800 CW secondary antibody from LI-COR Biosciences, Lincoln, Nebraska, USA. AevertAid First Strand cDNA Synthesis Kit and BCA protein assay kits were purchased from Thermo Scientific, Waltham, MA, USA; Faststart Universal SYBR Green Master and LightCycler96 from Roche, Nutley, NJ, USA; and protein RIPA lysis buffer from the Beyotime Institute of Biotechnology, Haimen, JS, China. All solutions were prepared fresh, prior to each assay.
Animals and treatments
ApoE-deficient (ApoE−/-) and wild-type (WT, age and gender matched) C57-BL/6 mice were purchased from Hua Fu Kang Biotechnology Co., Ltd (Beijing, China) and verified by RT-PCR (Fig. S1). A total of 85 male rats (n = 28 in WT and n = 40 + 17 in ApoE−/-) were used in this study. Rats were respectively killed at 1-, 2-. 4- and 10-months (All n = 7 in WT and n = 10 in ApoE−/-) for all designed measurements. Another 17 ApoE−/- mice at 10-months old were treated with Ad-Blank (n = 7) or Ad-ApoE (n = 10) for rescue experiments (Fig. S2). The mice were housed under specific pathogen-free conditions at 22±2 °C with a relative humidity of 60–65% and maintained under a 12-h light/12-h dark cycle with ad libitum access to food and water as previously described [19]. All animal care and experimental protocols were performed according to the Animal Management Rules of the Ministry of Health of China, and approved by the Animal Ethics Committees of Nantong University (NDFC31271132) and Chinese University of Hong Kong (GRF14111815).
Sampling of blood and tissues
Mice were fasted for 24-h and then heparinized, anesthetized with 1% pentobarbital sodium (40 mg/kg bw, i.p.), decapitated, and perfused with PBS. Fasted blood samples were collected and the liver and spleen were removed, weighed, and stored in a freezing chamber at −70 °C for subsequent measurements [20].
Ferritin and hepcidin in the serum and iron contents in the liver, spleen and brain
The concentrations of ferritin and hepcidin in serum were determined using ELISA kits [21]. Total iron concentrations in the spleen and liver were determined using a graphite furnace atomic absorption spectrophotometer (GFAAS) [22].
DAB-enhanced Perls staining
Paraformaldehyde-fixed paraffin-embedded tissues were sectioned into 20 μm sections and stored at room temperature. Slides were the blocked for nonspecific binding using protein block, and endogenous peroxidase activity was quenched [23]. For DAB-enhanced Perls staining, slides were immersed for 1-h in 1% potassium ferricyanide in 0.1-M HCl buffer and then stained with DAB. All slides were counterstained with hematoxylin and then visualized using a Nikon Eclipse TE2000-Umicroscope (Nikon, UK).
Isolation of total RNA and quantitative real-time PCR
Total RNA extraction and cDNA preparation were performed using TRIZOL reagent and the AevertAid First Strand cDNA synthesis kit respectively. Quantitative real-time PCR was carried out using FastStart Universal SYBR Green Master and LightCycler96. The specific pairs of primers used for PCR were listed in Table S1. Relative gene expression was calculated by the 2−ΔΔCT method [24].
Western blot analysis
Tissues were homogenized as described previously [25]. Aliquots of the extract containing about 30 μg of protein were loaded and run on a single track of 10% SDS–PAGE under reducing conditions. The blots were blocked and then incubated with primary antibodies: anti-TfR1 (1:1000), anti-DMT1 (1:1000), anti-mouse Fpn1 (1:1000), anti-FTL (1:1000), anti-IRP1 (1:1000), anti-IRP2 (1:1000), anti-Erk1/2 (1:2000), anti-pErk1/2 (1:500), and anti-Nrf2 (1:500) overnight at 4 °C, and then with anti-IRDye 800 CW secondary antibody (1:5000) for 2-h at 37 °C. The intensities of the specific bands were detected and analyzed with the Odyssey infrared imaging system (Li-Cor).
Immunohistochemistry staining
Hydrogen peroxide was used to quench endogenous peroxidase activity [26]. Sections were immunohistochemically stained with anti-TfR1 (1:200), anti-DMT1 (1:150), anti-Fpn1 (1:150), anti-Nrf2 (1:200), anti-BMP6 (1:150) and counterstained with hematoxylin. Signal was detected using a DAB substrate following the manufacturer's recommendations. The immunostaining images were scanned randomly under a confocal fluorescence microscope and light microscope (Olympus, Tokyo, Japan) by a single investigator who was blind to sample identity.
Immunofluorescence staining
Immunofluorescence staining was carried out as described [27]. In brief, tissues or cells were immersed in cryo-embedding medium and then sectioned into 10-mm thick slices using a cryotome (Leica Microsystems, Germany). Slices were blocked with 3% bovine serum albumin for 2-h and incubated overnight at 4 °C with primary antibodies: anti-hepcidin-25 (1:100) and anti-p-ERK (1:100), and then with Alex Fluor 488 or 594-conjugated secondary antibodies for 1-h at room temperature and then with Hoechest 33342 (5 mg/ml) for 15-min at 37 °C. Negative controls received an identical treatment except for the primary antibody and showed no positive signal.
The rescue effect of overexpression of ApoE in ApoE−/− mice
To assess the rescue effect of over-expression of ApoE in ApoE−/- mice, 10 μL Ad-ApoE or Ad-blank was intravenously administered to ApoE−/- mice. Liver and spleen were obtained 1 week after the treatments, and the expression of ApoE and FTL proteins and iron contents were measured.
Statistical analysis
Statistical analyses were performed using Graphpad Prism 5 (GraphPad software, La Jolla, CA). Data were presented as mean ± SEM. The differences between the means were all determined by one or two-way analyses of variance (ANOVA). A probability value of p < 0.05 was taken to be statistically significant.
Results
ApoE deficiency resulted in a progressive increase in body iron contents with age in mice
To find out whether ApoE is required for iron homeostasis as speculated, we firstly examined the effects of ApoE KO on tissue iron status by measuring iron contents and FTL expression in the liver and spleen of ApoE−/- and WT mice at different ages. FTL was checked because FTL facilitates the storage of iron into the ferritin core [28], being more closely associated with cellular iron storage [29] and also because FTL is the predominant form of ferritin in the liver and spleen [30]. Iron levels in both liver (Fig. 1A) and spleen (Fig. 1B) were significantly higher in ApoE KO mice than in WT mice at 2-, 4- and 10-months, displaying a progressive increase in iron contents with age in these two organs. DAB-enhanced Perls’ iron staining of the liver (Fig. 1C) and spleen (Fig. 1D) of ApoE KO and WT mice presented similar results. Iron content in the liver (Fig. 1A) and spleen (Fig. 1B) was also higher in ApoE KO mice than in WT mice at 1-month, although the difference was not significant. Western blot analysis showed that ApoE KO also resulted in a progressive increase in FTL expression with age in both the liver (Fig. 1E and G) and spleen (Fig. 1F and H) of mice, starting at 1-month. In addition, we checked serum ferritin because it serves as a serum marker of total body iron stores or as an important clinical marker of iron status [31]. Enzyme-linked immunosorbent assay showed that serum ferritin (Fig. 1I) in ApoE KO at 4- and 10-months was significantly higher than that in WT mice. The above findings collectively indicated that ApoE deficiency could result in a progressive increase in body iron contents with age in mice.
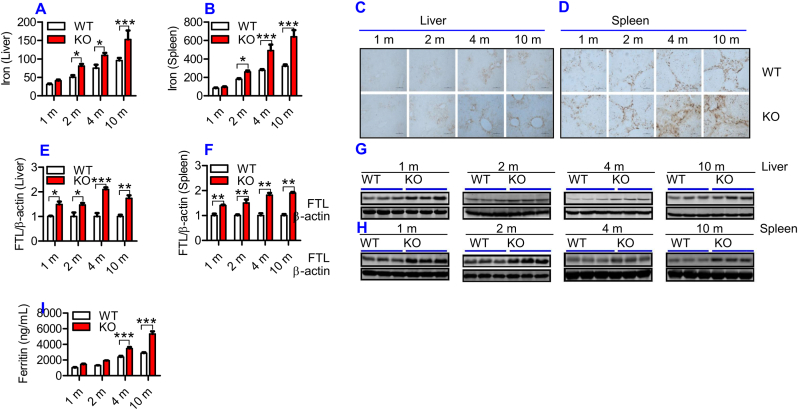
ApoE deficiency resulted in a progressive increase in body iron levels with age in mice.
Iron content and/or FTL expression in the blood, liver and spleen of ApoE KO (KO) and wild-type (WT) mice at different ages (1, 2, 4 and 10 m = 1,2, 4, and 10 months) were determined as described in “Methods".
A - D: Total iron contents in the liver (A and C) and spleen (B and D) were measured by a GFAAS (A and B) and DAB-enhanced Perls’ iron staining (C and D; Scale bar = 50 μm); E − H: Western blot analysis of FTL expression in the liver (E and G) and spleen (F and H); I: Serum ferritin.
All n = 7 in WT; n = 10 in KO. Data were the mean ± SEM. *p < 0.05, **p < 0.01, ***p < 0.001 vs. WT mice.
ApoE deficiency led to a significant increase in TfR1 and a reduction in Fpn1 expression
To understand why iron content in the liver and spleen increased progressively with age in ApoE KO mice, we examined the effects of ApoE KO on expression of TfR1 and Fpn1 proteins. These two transporters were examined because cell or tissue iron levels mainly depend upon expression of TfR1 (a key protein for cell-iron uptake) [32], and Fpn1 (the only-known cell-iron exporter) [33]. In the liver, TfR1 expression (Fig. 2A and B) was found to be higher at 2-, 4- and 10-months, and Fpn1 (Fig. 2A and C) lower at all time points in ApoE KO when compared to WT mice. In the spleen, TfR1 expression (Fig. 2F and G) was significantly higher and Fpn1 expression (Fig. 2F and H) lower in ApoE KO when compared to WT mice at all ages. Consistent results were also obtained from immunohistochemical examination of TfR1 and Fpn1 protein expression in the liver (Fig. 2K) and spleen (Fig. 2L). These findings imply that the increased cell-iron uptake caused by up-regulation of TfR1 and the reduced cell-iron export caused by down-regulation of Fpn1, resulting from ApoE deficiency, may be one of major causes of how ApoE deficiency induces a progressive increase in body iron contents with age.
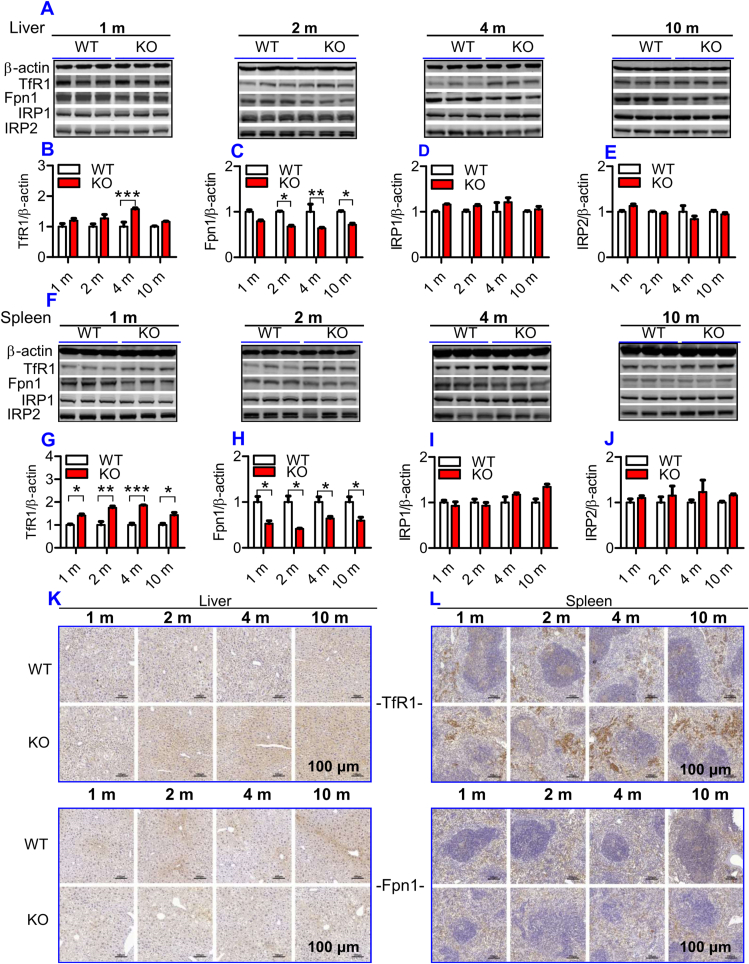
ApoE deficiency led to a significant increase in TfR1 and a reduction in Fpn1 expression, but had no effect on IRP1 and IRP2 expression in the liver and spleen of mice. The expression of TfR1, Fpn1, IRP1 and IRP2 in the liver and spleen of ApoE KO and WT mice at different ages (1, 2, 4 and 10 m = 1,2, 4, and 10 months) were measured as described in “Methods".
A - J: Western blot analysis of TfR1, Fpn1, IRP1 and IRP2 expression in the liver (A - E) and spleen (F-J); K and L: Immunohistochemical examination of TfR1 and Fpn1 protein expression in the liver (K) and spleen (L) (Scale bar = 100 μm).
All n = 7 in WT; n = 10 in KO. Data were the mean ± SEM. *p < 0.05, **p < 0.01, ***p < 0.001 vs. WT mice.
ApoE deficiency significantly attenuated serum hepcidin, hepcidin mRNA and protein expression, but has no effect on IRP1 and IRP2 content in the liver and spleen of mice
To find out how ApoE deficiency affects TfR1 and Fpn1 expression, we subsequently investigated the effects of ApoE deficiency on IRPs and hepcidin expression in mice because TfR1 and Fpn1 expression is regulated cellular by IRPs and systemically by hepcidin [34]. Western blot analysis demonstrated that there were no significant differences in the expression of IRP1 (Fig. 2A and D; 2F& 2I) and IRP2 (Fig. 2A and E; 2F & 2J) in both the liver (Fig. 2A, D & 2E) and spleen (Fig. 2F, I & 2J) between ApoE KO and WT mice at all ages, implying that the ApoE KO-induced changes in TfR1 and Fpn1 expression might not be associated with IRPs under our experimental conditions.
Hepcidin in the serum (Fig. 3A) and hepcidin mRNA expression in the liver (Fig. 3B) and spleen (Fig. 3C) were found to be lower in ApoE KO than in WT mice at all time-points, although significant differences were found only at 4- and 10-months. Immunofluorescence examination showed that expression of the hepcidin peptide was also lower in the liver (Fig. 3D) and spleen (Fig. 3E) of ApoE KO than in WT mice at 10-months. Theoretically, the reduced expression of Fpn1 should be accompanied by increased hepcidin levels, however, this hormone was down-regulated rather than increased by ApoE KO as we had expected. This might imply that hepcidin does not play a predominant role in the control of Fpn1 expression in ApoE KO mice.
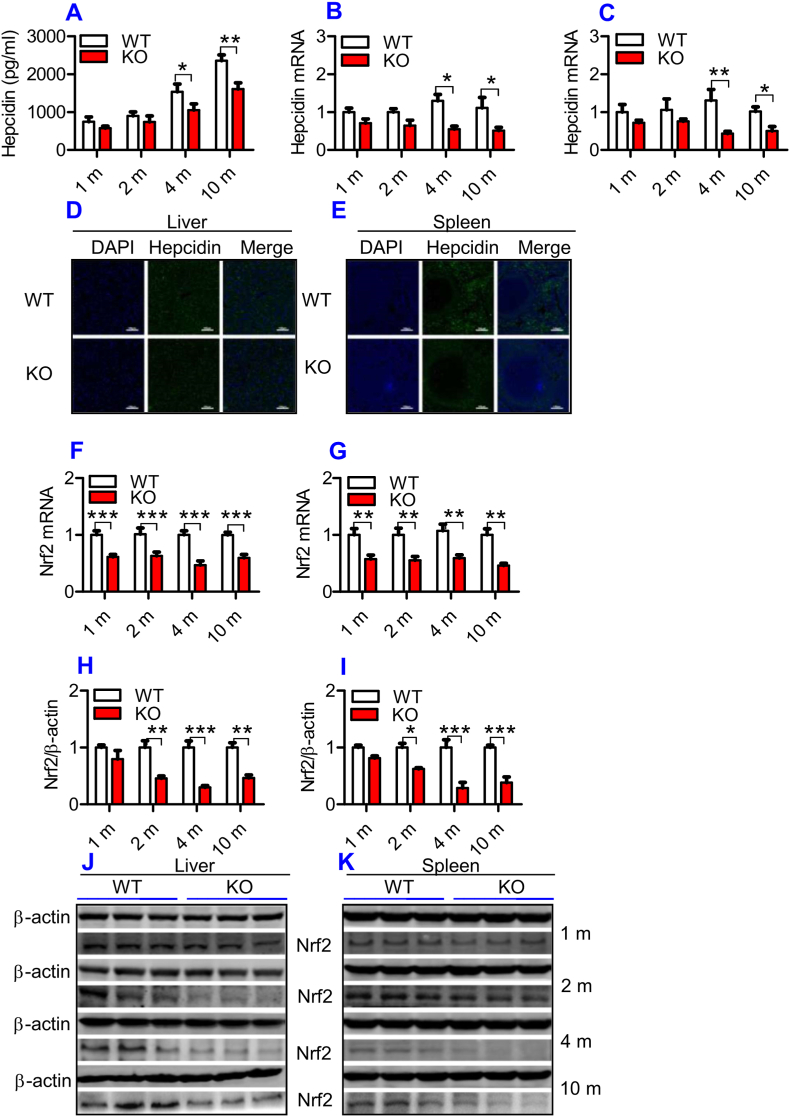
ApoE deficiency induced a significant reduction in serum hepcidin, hepcidin mRNA, Nrf2 mRNA and protein expression in the liver and spleen of mice.
The hepcidin concentration in the serum, expression of hepcidin and Nrf2 in the liver and spleen of ApoE KO (KO) wild-type and (WT) mice at different ages (1, 2, 4 and 10 m = 1,2, 4, and 10 months) were determined as described in “Methods".
A: Serum hepcidin;
B and C: RT-PCR analysis of hepcidin mRNA in the liver (B) and spleen (C); D and E: Immunofluorescence examination of hepcidin protein in liver (D) and spleen (E) of 10-months old mice (Scale bar = 100 μm); F and G: RT-PCR analysis of Nrf2 mRNA in the liver (F) and spleen (G); H–K: Western blot analysis of Nrf2 in the liver (H and J) and spleen (I and K).
All n = 7 in WT; n = 10 in KO. Data were the mean ± SEM. *p < 0.05, **p < 0.01, ***p < 0.001 vs. WT mice.
ApoE deficiency significantly reduced the expression of Nrf2 mRNA and protein in the liver and spleen
To further explore the mechanisms by which ApoE KO led to a down-regulation of Fpn1, we investigated Nrf2 expression in the liver and spleen because Nrf2 is known to affect Fpn1 expression and cell iron release [35]. Expression of Nrf2 mRNA in the liver (Fig. 3F) and spleen (Fig. 3G) was significantly lower in ApoE KO than in WT mice at all ages. A significant reduction in Nrf2 protein in the liver (Fig. 3H and J) and spleen (Fig. 3I and K) of ApoE KO mice was found at 2-, 4- and 10-months, as compared with WT mice. At 1-month, Nrf2 protein expression in the liver and spleen of ApoE mice was also lower than that of WT mice, although the difference was not significant. The reduced expression of Nrf2 may be one of the causes for the suppressed level of Fpn1 in ApoE KO mice.
ApoE deficiency inhibited Erk phosphorylation, but had no effect on BMP6, EPO and IL-6 expression in the liver and spleen of mice
Hepcidin is a principal regulator of systemic iron homeostasis. The TfR2/HFE/Erk1/2, BMP/SMAD and IL-6/STAT3 signaling pathways [36] are major pathways regulating hepcidin expression, and EPO has recently been demonstrated to be involved in the regulation of hepcidin expression [37]. In addition, ApoE has been demonstrated to activate pErk1/2 in vitro [38] and in vivo [39]. Therefore, we next investigated the expression of pErk1/2, BMP6, IL-6 and EPO in the liver and spleen of mice. The phosphorylation of Erk1/2 (Fig. 4A – 4D) was significantly lower in the liver (Fig. 4A and C) and spleen (Fig. 4B and D) of ApoE KO mice when compared to WT mice at all-time-points, while expression of BMP6 mRNA (Fig. 4E and F) and protein (Fig. 4G) and EPO mRNA (Fig. 4H and I) in the liver (Fig. 4E, G & 4H) and spleen (Fig. 4F, G & 4I), and IL-6 mRNA in the liver (Fig. 4J) of ApoE KO mice was not significantly different from that of WT mice. Except for ages of 4- and 10-months, IL-6 mRNA levels in the spleen (Fig. 4K) of ApoE KO mice at 1- and 2-months were also the same as those found in WT mice. This indicated that the reduced contents of hepcidin may be partly due to the down-regulation of Erk1/2 phosphorylation induced by ApoE deficiency rather than other molecules we investigated.
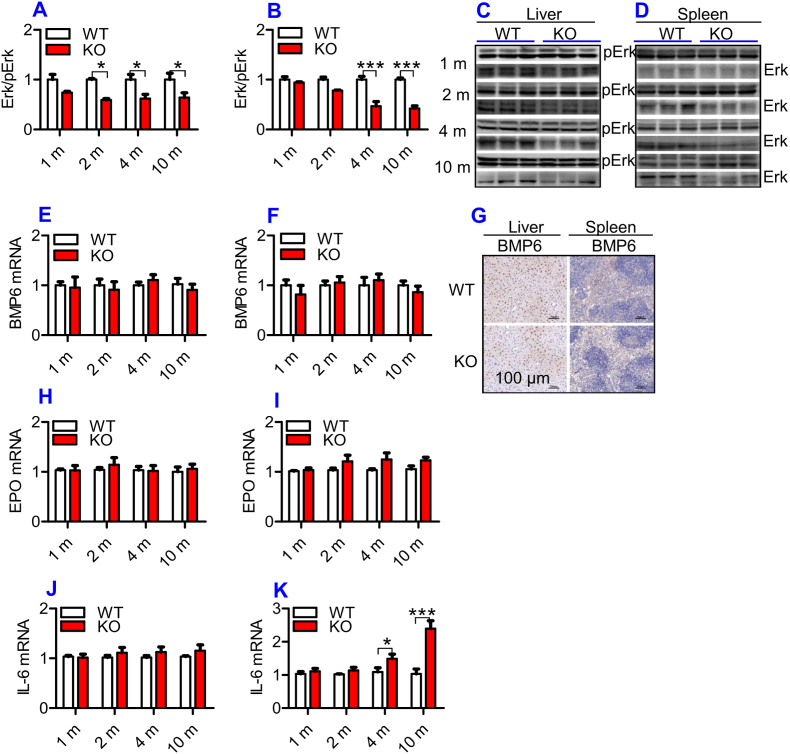
ApoE deficiency induced a significant reduction in Erk phosphorylation, but had no effect on expression of BMP6 mRNA and protein and EPO mRNA in the liver and spleen and IL-6 mRNA in the liver of mice.
The expression of BMP6 mRNA and protein and EPO and IL-6 mRNA, Erk phosphorylation in the liver and spleen of ApoE KO (KO) wild-type and (WT) mice at different ages (1, 2, 4 and 10 m = 1,2, 4, and 10 months) were determined as described in “Methods".
A - D: Western blot analysis of Erk phosphorylation (Erk/pErk) in the liver (A and C) and spleen (B and D);
E, F and G: RT-PCR analysis of BMP6 mRNA (E and F) and immunohistochemical examination of BMP6 protein (G) and in the liver (E and G) and spleen (F and G) (Scale bar = 100 μm);
H–K: RT-PCR analysis of EPO (H and I) and IL-6 (J and K) mRNA in the liver (H and J) and spleen (I and K);
All n = 7 in WT; n = 10 in KO. Data were the mean ± SEM. *p < 0.05, **p < 0.01, ***p < 0.001 vs. WT mice.
ApoE deficiency significantly increased DMT1 protein and reduced Fpn1 protein expression in the intestine of mice
To find out whether the progressive increase in iron content with age in the liver and spleen is associated with the changes in iron absorption in the intestine of ApoE KO mice, we then examined the expression of DMT1 and Fpn1 proteins in the intestine of ApoE KO and WT mice. Western blot analysis showed that expression of DMT1 protein (Fig. 5A and B) was significantly higher and Fpn1 protein (Fig. 5A and C) lower in the intestine of ApoE KO mice than in WT mice at all ages examined. The tendency of DMT1 to increase and Fpn1 to decrease progressed with age. The expression of DMT1 protein (Fig. 5D) and mRNA (Fig. 5F) was also higher and Fpn1 protein (Fig. 5E) and mRNA (Fig. 5G) lower in the intestine of ApoE KO mice than in WT mice at 10-months old. The increased expression in DMT1 in the intestine would be able to increase apical no-heme-iron uptake or transport of no-heme-iron across the apical membrane, but it does not mean that ApoE KO could increase enterocyte iron absorption because basolateral Fpn1 is reduced in ApoE KO mice. However, if Fpn1-mediated iron transport is not a rate-limiting step of enterocyte iron absorption or if the amount of basolateral Fpn1 is still enough, although reduced, to handle all iron transport across basolateral membrane of the intestine, the increased DMT1 expression is likely to increase enterocyte iron absorption. This possibility needs to be further investigated.
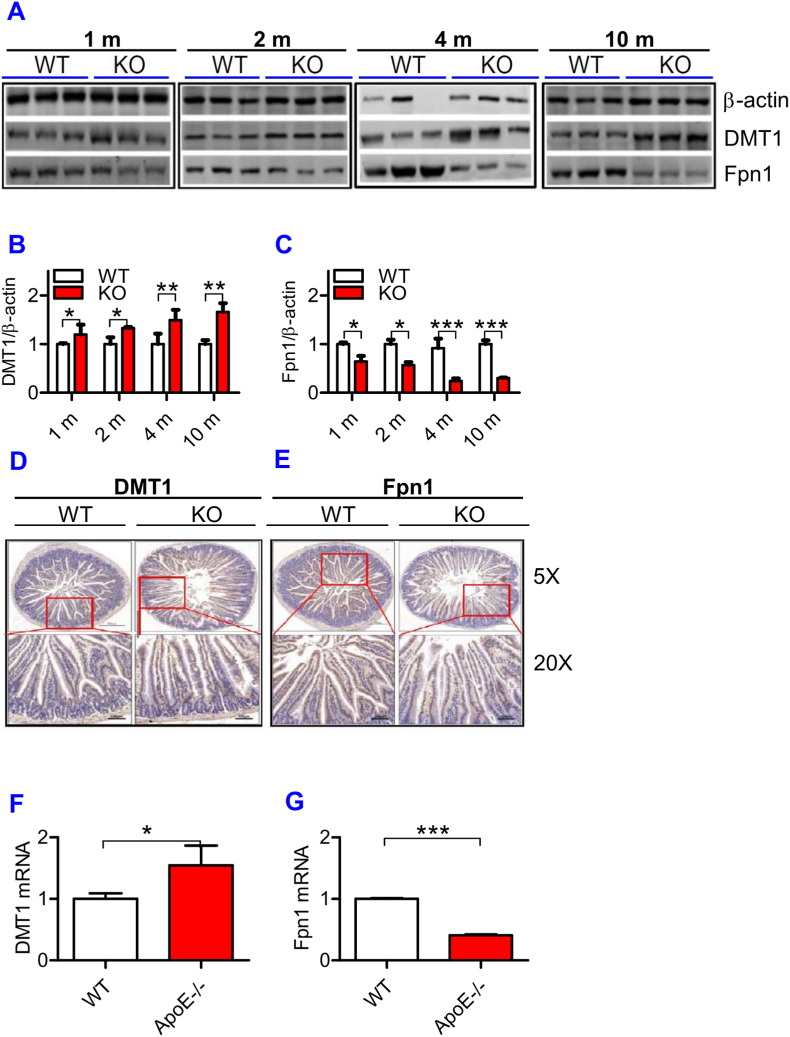
ApoE deficiency up-regulated expression of DMT1 and down-regulated Fpn1 mRNA and protein in the small intestine.
The expression of DMT1 (A and B) and Fpn1 (A and C) protein at different ages (1, 2, 4 and 10 m = 1,2, 4, and 10 months) and DMT1 and Fpn1 protein (D: DMT1; E: Fpn1) and mRNA (F: DMT1; G: Fpn1) at 10-months old were measured in the small intestine of ApoE KO (KO) and wild-type (WT) mice by immunohistochemical analysis (D and E) or RT-PCR (F and G) as described in “Methods".
All n = 7 in WT; n = 10 in KO. Data were the mean ± SEM. *p < 0.05, **p < 0.01, ***p < 0.001 vs. WT mice.
Replenishment of ApoE partially reversed the iron-related phenotype in ApoE KO mice
Finally, we examined the effects of ApoE over-expression on iron content, and ApoE and FTL protein expression in the liver and spleen of ApoE KO mice. ApoE KO mice (10-months old) were treated with 10 μL of Ad-ApoE or Ad-blank by tail intravenous injection, and 7 days later the relevant measurements were performed. The expression of ApoE in the liver (Fig. 6C) and spleen (Fig. 6D) was found to be significantly increased, and simultaneously the expression of FTL (Fig. 6E and F) and iron contents (Fig. 6A and B) in the liver (Fig. 6A and E) and spleen (Fig. 6B and F) decreased in ApoE KO mice treated with Ad-ApoE as compared with those treated with Ad-blank. The data demonstrated that Ad-ApoE could increase ApoE expression and partially reverse the iron-related phenotype induced by ApoE deficiency.
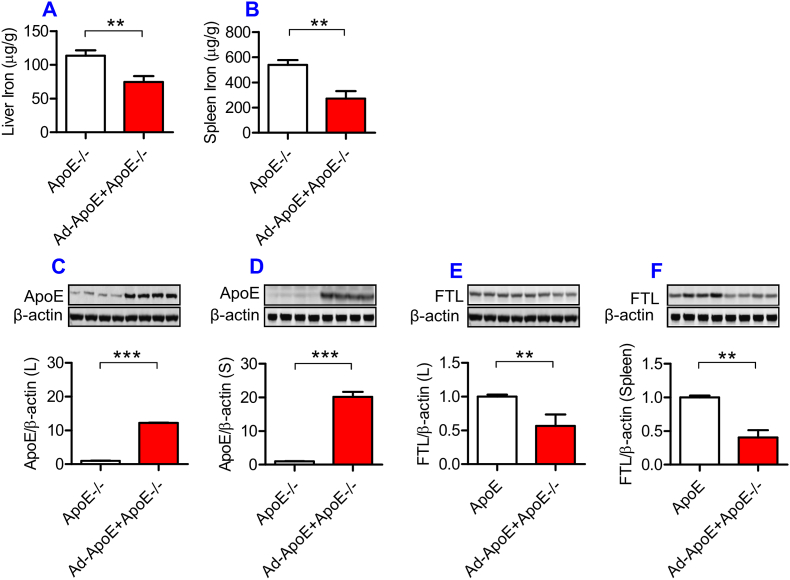
Partial replenishment of ApoE partly reversed the iron related phenotype in ApoE−/− mice.
ApoE KO mice (10-months old) were treated with Ad-ApoE or Ad-Blank and then ApoE and FTL protein expression and iron contents in the liver and spleen were measured as described in “Methods”. A and B: a GFAAS measurement of total iron contents in the liver (A) and spleen (B) of Ad-ApoE-treated ApoE KO mice at 10-months old; C to F: Western blot analysis of ApoE (C and D) and FTL (E and F) protein in the liver (C and E) and spleen (D and F) of Ad-ApoE-treated ApoE KO mice at 10-months old. Data were the mean ± SEM (n = 7 in ApoE−/− + Ad-Blank and n = 10 in ApoE−/− + Ad-ApoE). **p < 0.01, ***p < 0.001 vs. ApoE−/- + Ad-Blank in vivo.
Discussion
By measuring tissue iron contents and FTL expression in ApoE−/- and WT mice at different ages, we demonstrated that the complete absence of ApoE (ApoE−/-) can induce a progressive increase in ferritin concentration in the serum, in iron content and FTL expression in the liver and spleen. Treatment with Ad-ApoE significantly increased ApoE protein expression as well as reduced iron content and FTL expression in the liver and spleen of ApoE−/- mice, showing that replenishment of the absent ApoE can reverse the iron-related phenotype in ApoE−/- mice. In addition, all samples were collected in ‘normal’ conditions rather than stressful situations (e.g. ischemia, oxidative) in the present study. Therefore, these findings suggested that ApoE may be essential for physiological iron metabolism.
The regulation and management of iron contents at the cellular level is primarily via two proteins in most cells throughout the body, TfR1 and Fpn1 [32,33,40]. By controlling their expression, the cell can determine the amount of iron acquired and released. In most types of cells, iron balance depends on the normal expression of these two in-and-out transporters. The significant increase in TfR1 and the reduction in Fpn1 expression found in the liver and spleen of ApoE−/- mice could lead to an increase in iron uptake and a reduction in iron release from the cells of these two organs, and ultimately induce an over-accumulation in cell and then tissue iron. Therefore, the up-regulation of TfR1 and down-regulation of Fpn1 induced by ApoE deficiency may be one of the key mechanisms by which ApoE KO induces a progressive increase in iron content of the liver and spleen with age in mice (Fig. 7).
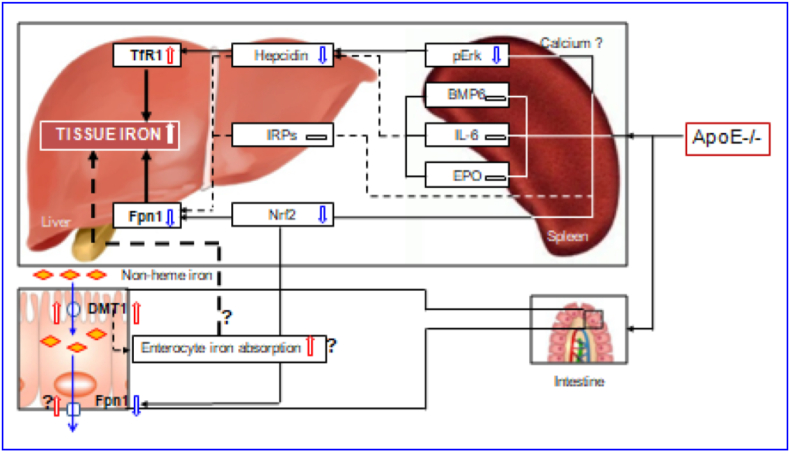
A hypothetical scheme for the progressive accumulation of iron with age in the liver and spleen in apolipoprotein E knock-out mice.
However, an important question that needs to be answered is how ApoE deficiency affects TfR1 and Fpn1 expression. Accumulated findings show that TfR1 and Fpn1 expression is mainly controlled by IRPs [41], hepcidin [34,42,43] and Nrf2 [35]. We demonstrated that ApoE KO has no effect on IRP1 and IRP2 expressions in both the liver and spleen of mice at all ages we investigated. Also, we found that ApoE KO induces a significant reduction, rather than an increase, in the expression of hepcidin mRNA and protein in the liver and spleen of mice. These unexpected findings may imply that IRPs and hepcidin does not play a predominant role in ApoE KO-induced changes in TfR1 and Fpn1 expression under our experimental conditions. In the case of Nrf2, ApoE KO has been shown to be able to significantly reduce expression of Nrf2 mRNA and protein in the liver and spleen of mice. This finding is consistent with what we found in cystathionine β-synthase KO (CBS−/-) mice [44] and implies that ApoE KO-induced down-regulation of Fpn1 might be mediated by the reduced Nrf2 expression (Fig. 7). In addition, hepcidin has recently been demonstrated to have an inhibiting role on TfR1 expression in different types of cells [42,43,45], and it is therefore likely that the up-regulation of TfR1 induced by ApoE deficiency may be partly due to the down-regulation of hepcidin.
ApoE itself has been reported to have a promoting role on Erk phosphorylation by affecting calcium homeostasis [38]. Our preliminary studies in vitro found that U0126 (pErk1/2 specific inhibitor) significantly inhibit ApoE3 induced up-regulation of pErk1/2 protein as well as hepcidin mRNA expression, while TfR2 silencing has no effects in primary hepatocytes and macrophages, implying that ApoE3 has a significantly positive role in regulating hepcidin expression via pErk1/2. Therefore, the reduced Erk phosphorylation may be one of the major causes for the down-regulated expression of hepcidin mRNA in the liver and spleen of ApoE KO mice in vivo. In addition to ApoE, the level of pErk1/2 is also controlled by iron contents. The increased iron could increase pErk1/2 expression via TfR2/HFE signaling [46]. However, pErk1/2 (and hepcidin mRNA) expression was found to be significantly reduced in ApoE KO mice. This may imply that ApoE deficiency, rather than iron-related signals or pathways, plays a predominant role in the control of pErk1/2 (and hepcidin mRNA) expression under our experimental conditions. Further studies are under way in our laboratories.
In summary, we demonstrated for the first time that ApoE knock-out can induce a progressive accumulation of iron with age in the liver and spleen of mice. The increased iron in the liver and spleen may be due to pERK mediated up-regulation of TfR1, and Nrf2-dependent down-regulation of Fpn1. The findings collectively indicate that ApoE may be essential for body iron homeostasis, providing new insights into better understanding the mechanisms involved in body iron homeostasis. ApoE might have a negative regulatory effect on tissue iron content under physiological conditions, and removing this negative effect by targeted deletion of the ApoE gene could lead to an increase in tissue iron, as found in the present study. Also, the data might help to clarify whether iron plays a role in the development of atherogenesis which is still a controversial and unsolved issue and imply that clinical late-onset or progressive diseases with unexplained iron abnormality may partly be related to the deficiency or reduced expression of ApoE.
Declaration of competing interest
The authors declare that they have no known competing financial interests or personal relationships that could have appeared to influence the work reported in this paper.
References
1
2
3
4
5
6
7
8
9
10
11
12
13
14
15
16
17
18
19
20
21
22
23
24
25
26
27
28
29
31
32
33
34
35
36
37
38
39
40
41
42
43
44
45
46
Author contributions
Y.K. and Z.M.Q. conceived, organized and supervised the study; J.M., Y.B., M.Y.L., H.M.M., M.Q.S., W.L., Y.L., J.J.W., and Y.X.B. carried out the animal and cell-experiments and collected data; J.M., C.Q and contributed to the analysis of data and generated figures; C.Q., Y.K. and Z.M.Q. prepared, wrote and revised the manuscript.
Data availability
All data generated or analyzed during this study are included either in this article or in the supplementary information files.
Acknowledgements
The studies in our laboratories were supported by the