 Progression from Monoclonal gammopathy of undetermined significance of the immunoglobulin M class (IgM-MGUS) to Waldenstrom Macroglobulinemia is associated with an alteration in lipid metabolism
Redox Biology

Current address: Department of Chemistry and Biochemistry, The University of Oklahoma, Norman, OK, USA.

- Altmetric
The molecular events that modulate the progression of monoclonal gammopathy of undetermined significance of the immunoglobulin M class (IgM-MGUS) to Waldenstrom Macroglobulinemia (WM) are mostly unknown. We implemented comparative proteomics and metabolomics analyses on patient serum samples to identify differentially expressed molecules crucial to the progression from IgM-MGUS to WM. Our data identified altered lipid metabolism as a discriminating factor between MGUS, WM, and matched normal controls. Levels of many fatty acids, including polyunsaturated fatty acids and dicarboxylic acids, were significantly downregulated in WM sera when compared to MGUS. These reductions were associated with diminished 15-LOX and PPAR protein expression and increased 5-LOX and GPX4 expression in WM versus MGUS patients’ samples. Furthermore, WM serum samples showed increased lipid peroxidation compared to MGUS. Treatment with IL-6 or TNFα, upstream regulators of differentially expressed proteins between MGUS and WM, increased lipid absorption and lipid peroxidation in WM cell lines. Knock-down of 15-LOX expression increased WM cell survival, an effect accompanied by increased 5-LOX and GPX4 expression. In summary, our data show that reduced fatty acid and lipid metabolite levels in the serum of the WM patients are associated with increased lipid peroxidation and that downregulation of 15-LOX increases the survival of WM cells. These data are highly significant in identifying the biomarkers of disease progression and designing targeted therapeutic intervention.
Introduction
Monoclonal gammopathy of undetermined significance of the immunoglobulin M class (IgM-MGUS) is defined as a pre-malignant condition that may develop into a lymphoid malignancy such as Waldenstrom Macrglobulinemia (WM), an indolent B-cell lymphoma in which malignant lymphoplasmacytic lymphoma cells (LPL) infiltrate the bone marrow (BM) and secrete monoclonal IgM [[1], [2], [3]]. The risk of individuals with IgM-MGUS developing a lymphoid malignancy is approximately 2–3% per year, which is almost 16-fold higher than the gender- and age-matched control individuals [4]. Patients with IgM-MGUS have less than 10% plasma cells in the BM and <3 g/dL of IgM in the serum, and do not show any evidence of end-organ damage [5]. The prevalent somatic mutations in CXCR4 and MyD88L265Pgenes found in WM have been identified with a higher incidence in clonal LPL cells in IgM-MGUS, implying that these mutations are the first events in the molecular pathogenesis of WM and are not involved in the transformation from IgM-MGUS to WM [5]. A study comparing immunophenotypic and gene expression profiling between IgM-MGUS and WM highlighted the similarity of clonal B-cells between these groups [5,6]. A recent study reported that the progression of IgM-MGUS to WM may be predicted based on the presence of two risk factors; abnormal serum free light-chain ratio and IgM level of ≥1.5 g per deciliter; so that patients with two risk factors are at a higher risk to develop the symptomatic disease in 20 years (55%) than those with one risk factor (41%) or without any risk factors (19%) [7].
To date, no data is available to describe the metabolic changes occurring in the progression of IgM-MGUS to WM. Here, for the first time, we performed comprehensive metabolomics and proteomics analysis to discern the unique or differentially expressed proteins/metabolites in the serum of normal, IgM-MGUS and WM patients with an ultimate goal to identify the critical protein expression patterns and metabolic events orchestrating the progression of IgM-MGUS to WM.
Materials and methods
Patients’ specimens
Peripheral blood serum samples from normal, IgM-MGUS, and WM patients were used after receiving Mayo Clinic Institutional Review Board approval. BM biopsies from WM patients were collected and fractionated to isolate cells from non-cellular components. WM patients involved both untreated and post-treatment patients.
Cell treatment
Two established WM cell lines, BCWM.1 (a gift from Dr. Steven Treon) and MWCL-1 (previously established in our laboratory [8]), were used for in vitro based assays in this study. Cells were starved overnight and then stimulated with recombinant human IL-6 (50 ng/ml) or TNFα (50 ng/ml) (PeproTech) for two days. Cells were then used for subsequent analyses explained in the methods section. In a series of experiments, we used IL-6 or IL-21 (100 ng/ml) in the presence or absence of 10 μg/ml of CJ-13,610, a pharmacological inhibitor of 5-LOX.
Proteomics analysis
Sample preparation for proteomic analysis
Serum samples, from 22 normal controls, 25 individuals with MGUS, and 41 WM patients, were subjected for label-free quantitative proteomic analysis. In order to achieve the maximum number of low abundant serum proteins, the abundant serum proteins were first removed using ProteoSpin serum protein depletion Kit (17,300, Norgen Biotek, Canada) according to the manufacturer protocol. The total proteins were lysed with a lysis buffer (8 M urea, 1 mM sodium orthovanadate, 20 mM HEPES, 2.5 mM sodium pyrophosphate, 1 mM β-glycerophosphate, pH 8.0) for 20 min at 4 °C, followed by sonication at 40% amplification using a microtip sonicator (QSonica, LLC, Model no. Q55) and cleared by centrifugation (14,000×g, 15 min, 15 °C). After detecting protein concentration (Pierce BCA Protein Assay, Thermo Fisher Scientific, IL, USA), a total of 100 μg of protein per sample was used for in-solution trypsin digestion. Tryptic peptides were desalted using C18 Sep-Pak plus cartridges (Waters, Milford, MA) and lyophilized for 48 h. The dried peptides were reconstituted in 0.1 M acetic acid at a concentration of 1 μg/μl, 5 μl was injected for each analysis.
LC-MS/MS analysis
The LC-MS/MS analysis was performed on a fully automated proteomic technology platform [9], which included an Agilent 1200 Series Quaternary HPLC system (Agilent Technologies, Santa Clara, CA) connected to a Q Exactive Plus mass spectrometer (Thermo Fisher Scientific, Waltham, MA). The LC-MS/MS set up was used as described earlier [9]. Briefly, the peptides were separated through a linear reversed-phase 90 min gradient from 0% to 40% buffer B (0.1 M acetic acid in acetonitrile) at a flow rate of 3 μl/min through a 3 μm 20 cm C18 column (OD/ID 360/75, Tip 8 μm, New objectives, Woburn, MA) for a total of 90 min run time. The electrospray voltage of 2.0 kV was applied in a split-flow configuration, and spectra were collected using a top-9 data-dependent method. Survey full-scan MS spectra (m/z 400–1800) were acquired at a resolution of 70,000 with an AGC target value of 3 × 10⁶ ions or a maximum ion injection time of 200 ms. The peptide fragmentation was performed via higher-energy collision dissociation with the energy set at 28 normalized collision energy (NCE). The MS/MS spectra were acquired at a resolution of 17,500, with a targeted value of 2 × 10⁴ ions or maximum integration time of 200 ms. The ion selection abundance threshold was set at 8.0 × 10² with charge state exclusion of unassigned and z = 1, or 6–8 ions and dynamic exclusion time of 30 s.
Database search and label-free quantitative proteomic analysis
Peptide spectrum matching of MS/MS spectra of each file was searched against the human database (UniProt) using the Sequest algorithm within Proteome Discoverer v 2.3 software (Thermo Fisher Scientific, San Jose, CA). The Sequest database search was performed with the following parameters: trypsin enzyme cleavage specificity, 2 possible missed cleavages, 10 ppm mass tolerance for precursor ions, 0.02 Da mass tolerance for fragment ions. Search parameters permitted variable modification of methionine oxidation (+15.9949 Da) and static carbamidomethylation (+57.0215 Da) on cysteine. Peptide assignments from the database search were filtered down to a 1% FDR. The relative label-free quantitative and comparative among the samples were performed using the Minora algorithm and the Proteome Discoverer 2.3 software's adjoining bioinformatics tools. To select proteins that show a statistically significant change in abundance between two groups, a threshold of 1.5-fold change with p-value (0.05) were selected.
Metabolomics analysis
Metabolite analysis in the human BM plasma and serum samples was performed using Capillary Electrophoresis Time-of-Flight Mass Spectrometry (CE-TOFMS) and Liquid Chromatography Time-of-Flight Mass Spectrometry (LC-TOFMS) in positive and negative modes for cationic and anionic metabolites according to Human Metabolome Technologies (HMTs) standard library.
Sample preparation
For CE-TOFMS analysis, 50 μl of the sample was mixed with 450 μl of methanol containing 10 μM internal standards. Then, 500 μl chloroform and 200 μl Milli-Q water were added, and the mixture was centrifuged at 2300 g, 4 °C for 5 min. The water layer (400 μL) was filtrated through a 5 kDa cut-off filter (ULTRAFREE-MC-PLHCC, Human Metabolome Technologies, Yamagata, Japan) to remove macromolecules. The filtrate was then concentrated using centrifugation and resuspended in 50 μL of ultrapure water immediately before the measurement.
For LC-TOFMS analysis, each 100 μL sample was mixed with 300 μL of 1% formic acid in acetonitrile (v/v) containing 3 μM internal standards and centrifuged at 2,300 g, 4 °C for 5 min. Then phospholipids was removed by filtering the supernatant using a column (Hybrid SPE phospholipid 55261-U, Supelco, Bellefonte, PA, USA). The filtrate was desiccated and resuspended in 100 μL of 50% isopropanol in Milli-Q water (v/v) immediately before the measurement.
Data processing and analysis
Peaks detected in CE-TOFMS and LC-TOFMS analysis were extracted using automatic integration software (MasterHands ver. 2.17.1.11 developed at Keio University) in order to obtain the peak information including m/z, migration time (MT) in CE, retention time (RT) in LC, and peak area. The peak area was then converted to relative peak area by the following equation:
Annotation of peaks
Putative metabolites were then assigned from HMT's standard library and Known-Unknown peak library based on m/z and MT or RT.
Quantitative estimation of target metabolites
Absolute quantification was performed for target metabolites. All the metabolite concentrations were calculated by normalizing each metabolite's peak area concerning the area of internal standard and using standard curves obtained by single-point (100 μM) calibrations.
Statistical analysis (PCA, HCA)
Hierarchical cluster analysis (HCA) and principal component analysis (PCA) were conducted using statistical analysis software developed at Human Metabolome Technologies (HMT).
Immunohistochemistry (IHC)
Formalin-Fixed Paraffin-Embedded (FFPE) bone marrow biopsy sections from control, MGUS or WM patients were used for staining with PPARγ, PPARα and PPARβ/δ (LifeSpan BioSciences), GPX4, 5-LO and 15-LO (Abcam). Sections were deparaffinized in xylene, rehydrated in graded ethanol, incubated with H2O2 to block endogenous peroxidase activity and then followed by heat-induced antigen retrieval using either citrate (pH 6.1) (for 15-LOX and PPARα) or EDTA (for PPARϒ, PPARβ/δ, 5-LOX and GPX4). After permeabilization using 0.3% Triton x-100, slides were incubated with primary antibodies (GPX4: 1/500; 5-LOX: 1/100; 15-LOX: 1/150; PPARϒ: 1/300; PPARα: 1/100 and PPARβ/δ: 1/300) for 30 min, rabbit anti-goat linker antibody for 30 min, rabbit probe for 20 min and R-polymer HRP for 20 min, using MACH 3™ rabbit or mouse-probe HRP Polymer Kit (Biocare Medical). Slides were then incubated with chromogen DAB+ (DakoCytomation) and counterstained in Meyer's hematoxylin. All slides were scanned using a digital slide scanner (MoticEasyScan). For the staining with each antibody, five WM and five MGUS BM sections were used.
RNA isolation and RNA-seq analysis
Total miRNA was extracted using the miRNeasy Mini Kit (Qiagen) according to the manufacturer's protocol. Isolated RNAs were used by the Mayo Clinic Genome Analysis Core for Library preparation and RNA-sequencing. Library preparation was done using the Standard TruSeq v2 for mRNA (Illumina, San Diego, CA, USA) and sequencing was carried out on Illumina HiSeq 4000 (Illumina, San Diego, CA, USA). Analysis of the data was done by the Mayo Clinic Bioinformatics Core facility using MAPRSeq (v2.1.1.), a pipeline designed for mRNA-Seq analysis. Log2RPKM (Reads Per Kilobase of the transcript, per Million, mapped reads) was used for comparative analysis.
Lipid peroxidation assay
The level of lipid peroxidation in the patients' serum samples was assessed using the Lipid Peroxidation (MDA) assay kit (Abcam, ab118970) according to the manufacturer's instructions. Briefly, samples were prepared by mixing 40 μL of serum with 1 mL of 42 mM H2SO4 in a microcentrifuge tube, followed by 250 μL of phosphotungstic acid solution. After incubation and centrifugation, the pellet was dissolved in 400 μL of ddH2O by sonication. Then 1.2 mL TBA solution was then added to each vial containing either sample or standard and incubated at 95C for 1 h and immediately cooled for 10 min on ice. Samples and standards were read on a plate reader at OD 532 nm and analyzed per the manufacturer's instructions.
To measure the lipid peroxidation in response to cytokines treatment, cell-based lipid peroxidation assay (Abcam, ab243377) was used. In brief, WM cell lines were treated with either IL-6 or TNFα for two days and then incubated with lipid peroxidation sensor for 30 min, followed by washing and fluorescence detection by flow cytometry.
Fatty acid absorption assay
To detect fatty acids absorption in response to IL-6 and TNFα treatment, WM cell lines were treated with IL-6 and TNFα for two data and then incubated with 1 μM BODIPY FL C16 (Molecular Probes) for 20 min. Cells were then lysed and analyzed for fluorescent intensity by flow cytometry.
Flow cytometry analysis
All flow analyses were performed using BD FACSCANTO II. Antibodies used in this study were rabbit anti-5-LOX (Abcam), Alexa-Flour conjugated goat anti-rabbit HRP (Jackson Immunoresearch laboratories), FITC-conjugate Annexin V and Propidium Iodide (PI) (both from ThermoFischer Scientific). Data were processed by FlowJo software (V10.4).
siRNA transfection
WM cell lines were transfected with 200 nM scrambled or 15-LOX siRNA using Amaxa® Human B Cell Nucleofector® Kit (Lonza) and Nucleofector™ 2b Device (program T-030). Cells were then incubated in complete RPMI media for 48 h. The transfection efficiency was measured by RT-PCR analysis and viable and apoptotic cells were detected by staining with Annexin/PI (Invitrogen) and subsequently flow cytometry analysis.
Real-Time PCR (RT-PCR) analysis
WM cell lines were treated with IL-6 or TNFα. The control cell did not receive any treatment. RNA was extracted from the cells by miRNeasy Mini kit (Qiagen) and cDNA synthesized by SuperScript™ III First-Strand Synthesis kit (ThermoFischer Scientific). RT-PCR analysis was performed using Hot starTaq Master Mix (Qiagen) and predesigned probes and primers for GPX4, 15-LOX, 5-LOX, and RPLP0 (all from Integrated DNA Technologies, IDT). Gene amplification was run on a Bio-Rad CFX96 Real-Time machine, and the relative gene expression, normalized to a housekeeping gene (RPLP0), was calculated using 2-(ΔΔCT) method. Data reported as Mean ± SEM.
Statistical analysis
Non-parametric Mann Whitney t-test analysis was used to compare differences between MGUS and WM samples, and a parametric unpaired t-test was used to determine the significant differences between treated and control untreated samples.
Results
Proteome signature of normal, IgM-MGUS and WM patients’ serum samples
The infiltration of LPL cells into the BM and proliferation and IgM secretion by these cells is associated with an array of molecular events [10] that could alter the protein expression and level of metabolites. To explore the significance of such changes in WM disease progression, we initially employed quantitative label-free proteomic analysis and compared the proteome profile between three groups of normal (n = 22), MGUS (n = 25), and WM (n = 41) serum samples. The LC-MS/MS analysis identified a total of 958 proteins shared between three groups. Besides, several proteins were common between WM and MGUS (n = 56), normal and WM (n = 49) or normal, and MGUS (n = 17). As expected, there were also a few proteins that were unique to either normal (n = 34), MGUS (n = 17), and WM (n = 20).
Principal component analysis (PCA) using total protein abundance data of each sample showed clustering of normal samples together, whereas MGUS and WM were clustered close to another but distinct from normals (Fig. 1B). Similarly, using hierarchical clustering and heat map analysis, we found a higher degree of similarity between MGUS and WM, than between normal and either of MGUS or WM (Fig. 1C), implying that MGUS and WM are related disease entities. Using statistical analysis, we identified differentially expressed proteins that were either significantly increased or decreased in abundance in WM vs. MGUS (n = 144 up; n = 78 down), WM vs. normal (n = 139 up; n = 89 down) and MGUS vs. normal (n = 144 up; n = 141 down) (Figs. 1D and 2A, B, C). The protein accession number and abundance ratio are summarized in. Supplementary Table 1 We generated a heat map of the unique proteins in normal, MGUS, and WM samples (Fig. 2D). Some proteins were found only in WM, including Insulin growth factor binding protein-1 (IGFBP1), Transferrin receptor (TFRC) and Hemicentin 2 (HMCN2). Similarly, a few proteins were only found in normal controls, but not in MGUS or WM, including Histone acetyltransferase type B catalytic subunit (HAT1), DNA helicase (MCM2), Cell division cycle 42 (CDC42), mitochondrial heat shock protein (HSPE1). Interestingly, the proteins belonged to MGUS, were found in either normal or WM samples (Fig. 2D), supporting the notion that the proteomic profile of MGUS patients has features common to both normal controls and WM patients and therefore represents an intermediary stage.

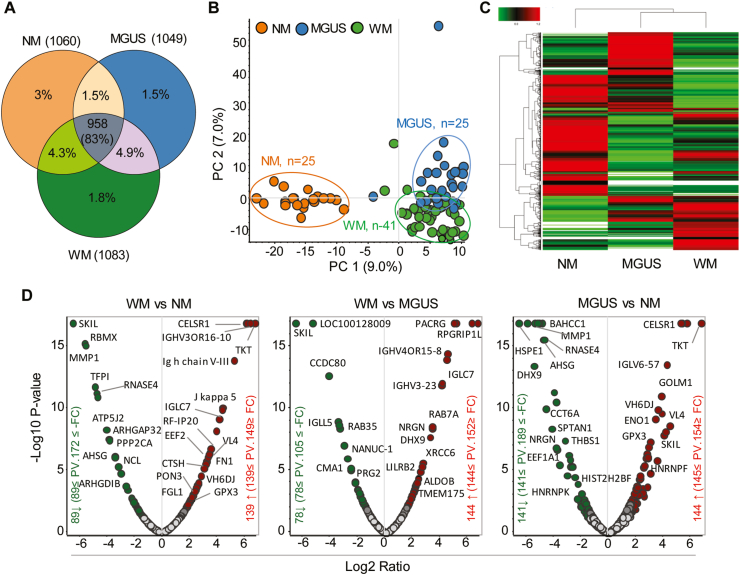
Label-free quantitative proteomic profiling of normal (NM), MGUS and WM serum samples. Serum samples were collected from 25 NM, 25 MGUS, and 41 WM samples, followed by LC-MS/MS analysis. A) Venn diagram shows the total number of unique proteins that are common between various sample groups. B) PCA analysis of the total protein abundance data collected from NM, MGUS, and WM samples. The data indicate close clustering of protein abundance of all NM samples (orange), whereas MGUS (blue) and WM (green) samples show variability, yet distinct from NM samples. C) Hierarchical clustering and heat map analysis of all groups' protein abundance identified in NM, MGUS, and WM samples. D) Volcano plots showing the fold change versus q-value of peak-area of the total 1156 quantified proteins. Red and green circles represent the significant (q < 0.05) up and down-regulated proteins, respectively. Grey circles (q = 0.05) are non-significant. (For interpretation of the references to color in this figure legend, the reader is referred to the Web version of this article.)
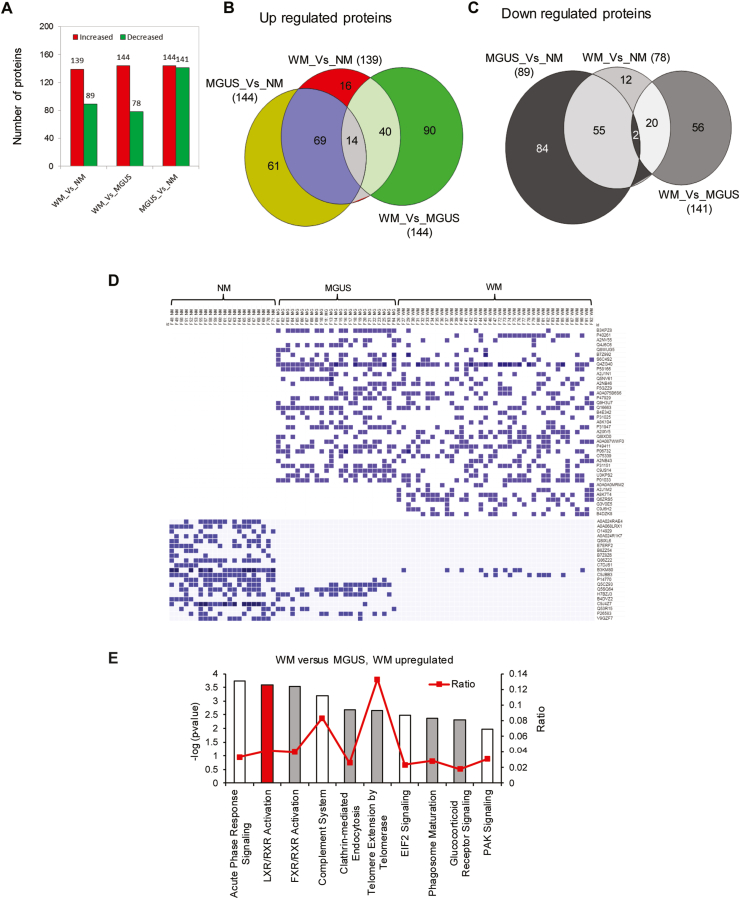
Comparative analysis of significantly increased or decreased proteins. A) Bar graphs represent the number of significantly changed proteins between groups. B & C) Venn diagrams display the relationship of upregulated or downregulated proteins between groups. D) Heat map shows the unique proteins identified in NM, MGUS, and WM serum samples. The identified peptide spectral match number (PSMs) for each protein was used to generate the heat map (https://software.broadinstitute.org/morpheus/). E) Bar graph represents the IPA pathway analysis of the proteins that are significantly higher in WM than MGUS. The bars' color indicates the z-scores (red: z-score≥2; white: z-score = 0 and grey: no activity is available). (For interpretation of the references to color in this figure legend, the reader is referred to the Web version of this article.)
To explore the altered pathways impacted by differentially expressed proteins, we next performed ingenuity pathway analysis (IPA). Comparing WM to MGUS samples identified activation of Liver X Receptor-Retinoid X Receptor (LXR-RXR) signaling as the most differentially activated pathway with a Z-score = 2.236 and –log p-value = 3.582 (Fig. 2E). This prediction was based on the increased expression of upstream molecules, including Apolipoprotein L1 (APOL1), which was 100 times higher in WM than MGUS and would be expected to increase the ligands for LXR-RXR activation [11]. LXRs belong to the nuclear receptors that heterodimerize with other nuclear receptors superfamily, including RXRs, and thereby regulate lipid, cholesterol, and fatty acid metabolism [[11], [12], [13]]. Therefore, the altered activation of LXR/RXR could be an indication that homeostasis of the lipid metabolism is perturbed in WM patients when compared to individuals with MGUS. IPA analysis also predicted the activation of TNFα and IL-6 as upstream regulators in WM based on the altered protein expression profile between MGUS and WM (Supplementary Table- 1).
Interestingly, our data showed that the phospholipase A2, group IIA (PLA2G2A), is significantly higher in WM than in MGUS serum (>2 fold). PLA2G2As hydrolyze the sn-2 ester bond in glycerophospholipids found in the cell membranes and produce fatty acids and lysophospholipids that can function as the second messengers or be further metabolized into the mediators involved in cellular processes such as inflammation and proliferation [14]. Previous studies indicate that expression of PLA2G2A is induced by TNFα [15], suggesting that altered cytokines in the tumor microenvironment contribute to the metabolism of lipids in WM.
Metabolomics analysis comparing the lipid profile of MGUS and WM serum samples
Altered cellular metabolism is associated with the accumulation or consumption of specific metabolites that could serve as disease progression biomarkers. Based on the finding that LXR-RXR and PLA2G2A signaling may alter lipid metabolism in the course of progression from MGUS to WM, we performed comprehensive metabolomics analysis and compared the lipid profile between MGUS and WM serum samples. Our data showed that 67 out of 225 of lipid metabolites were differentially present between MGUS and WM (Fig. 3A). MGUS samples had high levels of inflammatory and fatty acid products including steroids, cyclooxygenases (COX), monounsaturated fatty acids (MUFA), polyunsaturated fatty acids (PUFA), short-chain fatty acids, dicarboxylic acids, prostaglandins, and mitogens, supporting an inflammatory state in MGUS (Fig. 3B) (Supplementary Table- 2). The most robust discrimination between MGUS and WM was the abundance of short-chain dicarboxylic acids in MGUS (Fig. 3D). These are fatty acid oxidation products and carbon fuel for mitochondria, and they can also affect B cell activation [16]. The other strong discriminators between the two groups were vitamin D2, provitamin D3 (7-dehydrocholesterol), 24-dehydrocholesterol, which were decreased in WM patients (Fig. 3C). While most lipid metabolites were down-regulated in WM, specific metabolites, including anandamide (AEA), arachidonic acid derivative acid, Androsterone and 19-Hydroxyandrostenedione were highly expressed in WM compared to MGUS (Fig. 3E). To determine whether the downregulated fatty acid levels could serve as biomarkers of response to therapy, lipid profile of the WM patients with different therapeutic responses were compared. Interestingly, patients with partial or complete response to the treatment, had significantly higher levels of fatty acids than untreated or refractory patients. In contrast, the level of prostaglandin B2 and Trilaurin (C12:0 glycerate) declined in the responsive or remission groups (Fig. 3F).
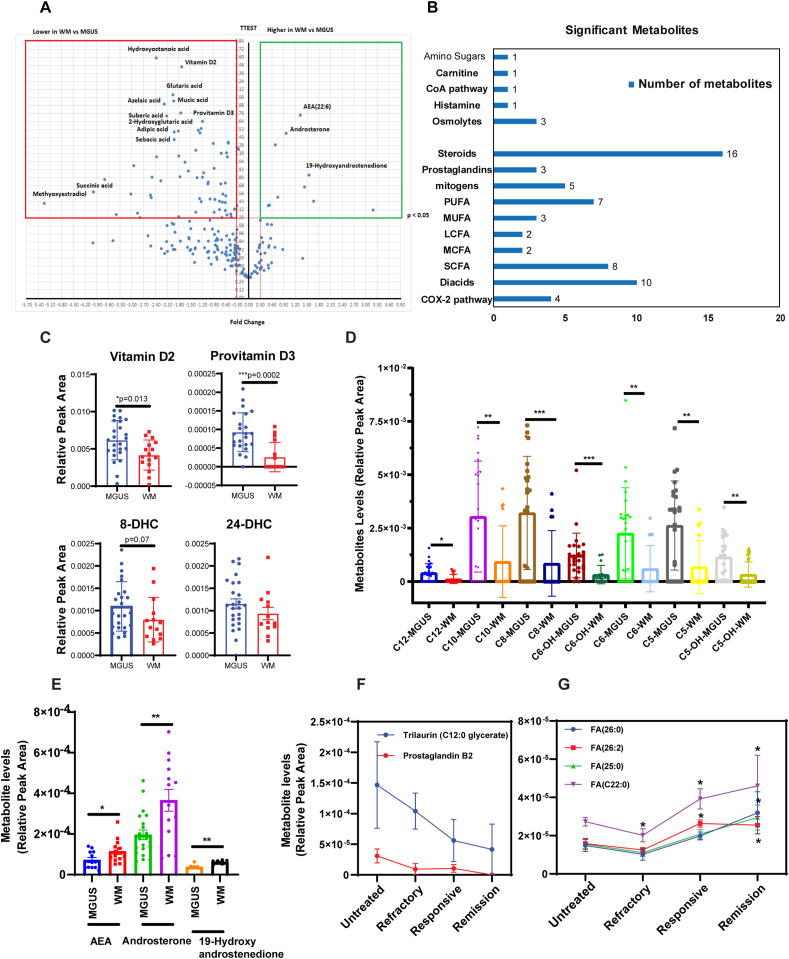
Metabolomics analysis comparing the lipid profile between MGUS and WM serum samples. A) Volcano plot comparing lipid metabolites of MGUS and WM serum samples s. Y-axis: p-value (cut-off of 0.05), X-axis: fold change. B) Bar graphs show the number of metabolites in each group significantly changed between MGUS and WM. C, D & E) Dot plots compare metabolites between MGUS and WM samples. Significant differences are depicted as **p < 0.01 and ***p < 0.001, dehydroxycholesterol (DHC). F & G) Line graphs compare lipid metabolites and fatty acids between WM patients. Significant differences are shown as *p < 0.05.
Differential expression of 5-lipoxygenase and 15-lipoxygenase between MGUS and WM
Lipoxygenases (LOXs), including 5- and 15-LOX, oxidize the polyunsaturated fatty acids, including arachidonic acid and linoleic acid and produce eicosanoids that further be metabolized to leukotrienes or oxidized linoleic acid products mediating inflammatory responses [17,18]. Altered fatty acid levels between MGUS and WM, including the reduced level of linoleic acid and elevated level of an arachidonic acid metabolite in WM (Fig. 3E), together with an increase in protein abundance of serum phospholipase A2, a catalytic enzyme that releases arachidonic acid from membrane phospholipids (Supplementary Table- 1, upregulated proteins in WM versus MGUS), prompted us to examine the expression of both 5- and 15-LOXs in MGUS and WM BM tissue sections (n = 5 for each of WM or MGUS patients).
IHC staining showed increased expression of 15-LOX, and reduced expression of 5-LOX in MGUS compared to WM samples (Figs. 4 and 5A). RNA-seq data also showed a significant reduction of 15-LOX in WM B-cells (Fig. 4B). Because IL-6 and TNFα were found to be activated in the proteomics analysis and possibly responsible for the differential expression of proteins between MGUS and WM, we treated WM cell lines with IL-6 or TNFα and tested the expression of 5-LOX and 15-LOX. Treatment of the cells with IL-6 or TNFα reduced 15-LOX RNA expression in both WM cell lines (Fig. 4C), indicating that elevation of these cytokines is critical factor in diminishing 15-LOX expression during disease progression from MGUS to WM. In contrast to 15-LOX, treatment with IL-6 or TNFα increased 5-LOX expression in both WM cell lines (Fig. 4D), indicating that 5-LOX and 15-LOX might play opposing roles in the biology of MGUS and WM.
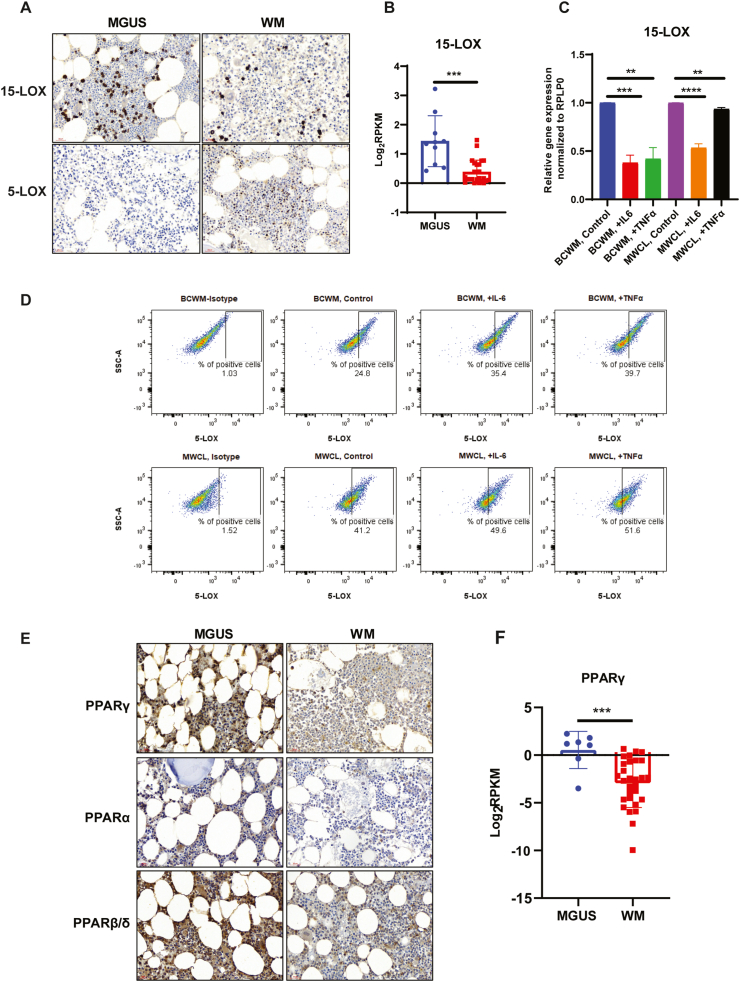
Expression of Lipoxygenases and PPAR family proteins in WM and MGUS samples. A) Representative IHC stainings show 15-LOX and 5×-LOX expression (brown color, 40× magnification) in MGUS and WM BM sections. B) RNA-seq data compares 15-LOX expression in the B-cells from MGUS and WM BM cells. C) RT-PCR analysis comparing the expression of 15-LOX in response to IL-6 or TNFα. Significant values are depicted as **p < 0.01, ***p < 0.001 and ****p < 0.0001. D) Flow cytometry analysis showing 5-LOX expression following treatment with IL-6 or TNFα. E) Representative IHC staining comparing the expression of PPARγ, PPARα and PPARβ/δ (brown color, 40× magnification) in MGUS and WM sections. F) RNA-seq data showing the significant (***p < 0.001) difference in PPARϒ expression between MGUS or WM B-cells. (For interpretation of the references to color in this figure legend, the reader is referred to the Web version of this article.)
Peroxisome Proliferator-Activated Receptor (PPAR) family of the proteins are reduced in WM compared to MGUS samples.
PPARs are nuclear receptor family of transcription factors activated by fatty acids and regulate lipid homeostasis [19]. PPARs have three isoforms, so-called PPARα, PPARβ/δ, and PPARγ, which are involved in fatty acid metabolism, lipid biosynthesis, and fatty acid oxidation [20]. Several natural lipophilic acids, including the enzymatic derivatives of linoleic acid and arachidonic acid metabolism by LOXs, such as eicosanoids, can bind to PPARγ as ligands [21] and prevent the inflammatory signaling [[22], [23], [24]]. To investigate whether the reduction in fatty acid levels, alteration in lipid profile, and increased inflammatory response in WM (Fig. 3) are also associated with an alteration in PPARs protein expression, we compared the expression of PPARs between MGUS and WM. We found that the BM tissues from WM patients had lower expression of PPARγ, PPARβ/δ, and PPARα than the MGUS BM samples (Fig. 4E). RNA-seq data analysis of the sorted B-cells from WM and MGUS patient samples also showed a significant reduction of PPARγ expression in WM than MGUS B-cells (Fig. 4F), confirming the data obtained from IHC analysis.
Increased fatty acid absorption and lipid peroxidation in response to IL-6 and TNFα
The reduced levels of fatty acids in WM patients' serum could be due to a reduced level of specific enzymes, increased absorption of these biomolecules into the malignant cells, and their subsequent utilization towards specific metabolic pathways. To demonstrate whether cytokines in the tumor microenvironment could induce increased absorption of fatty acids, we treated WM cells lines with either IL-6 or TNFα and after 48 h measured the lipid absorption using fluorescently tagged BODIPY® lipid probes. As shown in Fig. 5A, both IL-6 and TNFα increased lipid absorption in both WM cell lines, indicating that cytokines in the tumor microenvironment could induce fatty acid absorption.
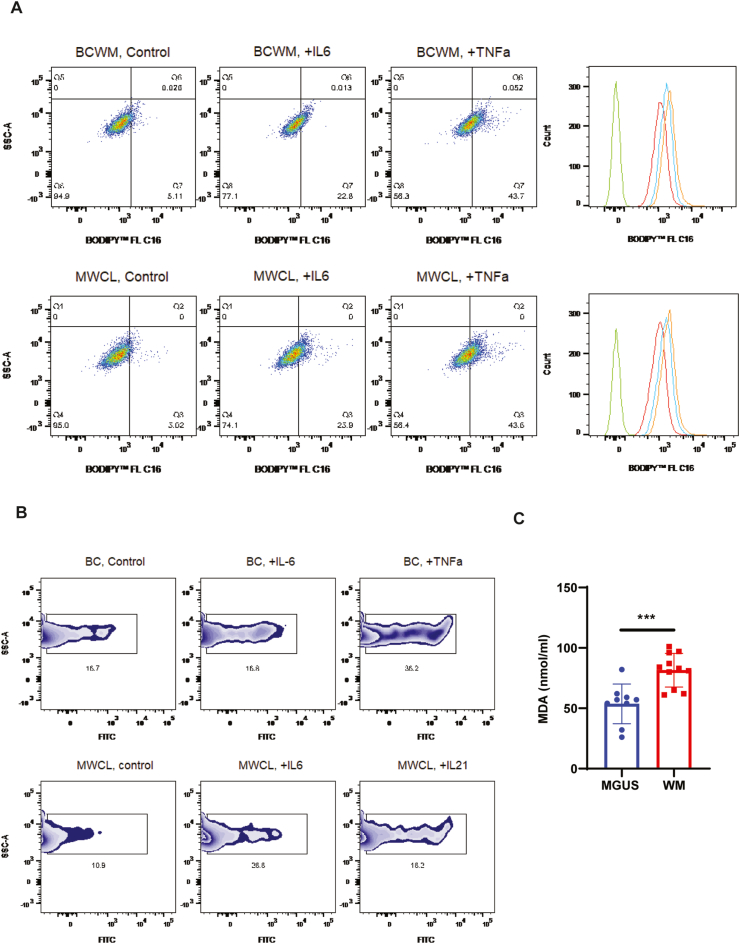
Lipid absorption and lipid peroxidation in response to IL-6 or TNFα treatment. A) Flow cytometry analysis shows increased lipid absorption using lipid probes (BODIPY™ 493/503). Overlapped histograms show the shift in fluorescent intensity (green: unstained; red: untreated; blue: IL-6; orange: TNFα). B) Flow cytometry analysis displays the percentage of FITC positive cells (peroxidized) following treatment with IL-6 or TNFα. C) Malondialdehyde (MDA) assay comparing the lipid peroxidation in the MGUS and WM serum samples (**p < 0.001). (For interpretation of the references to color in this figure legend, the reader is referred to the Web version of this article.)
We have recently reported that the WM tumor microenvironment is under elevated oxidative stress [25]. Such distress, together with increased activity of glutathione peroxidases (GPXs) indicates that the lipids might be undergoing lipid peroxidation in WM. Therefore, we examined lipid peroxidation in response to IL-6 or TNFα and found that these cytokines could increase lipid peroxidation in both WM cell lines (Fig. 5B). In agreement with this data, we also identified that the WM serum samples had a significantly higher level of lipid peroxidation than the MGUS (Fig. 5C), indicating that WM samples are under increased oxidative stress as compared to MGUS, which results in elevated lipid peroxidation.
Inhibition of 15-LOX expression promotes WM cell survival and is associated with increased 5-LOX and GPX4 expression
It has been shown that oxidation of PUFA by LOXs increase the lipid hydroperoxides (LOOH). The generation of LOOH mostly occurs by iron-mediated free radical autoxidation and LOX-catalyzed oxidation of polyunsaturated fatty acids [26].
We therefore examined the role of 15-LOX in WM cell viability by knocking down the expression of 15-LOX. Our data showed increased cell survival in both BCWM.1 and MWCL-1 cell lines following 15-LOX siRNA transfection (Fig. 6A), indicating that the reduced 15-LOX level, is associated with increased tumor cell survival in WM. Our data also showed increased expression of GPX4 in the WM patients BM section (Fig. 6B). GPX4 is known to play a critical role in the process of ‘Ferroptosis’ and lipid peroxidation and activation of GPX4 may overcome cell death induced by iron and lipid peroxidation [27]. Of note, we found that GPX4 expression was higher in the patients BM cells, who had higher percentage of BM involvement (Supplementary Fig. 1). Interestingly, 15-LOX knock-down upregulated the expression of GPX4 and 5-LOX (Fig. 6C), both of which are involved in promoting cell survival and inhibition of cell apoptosis. Furthermore, we demonstrated that inhibition of 5-LOX using a 5-LOX pharmacological inhibitor, CJ-13,610, increased apoptosis of the cells that were treated with either IL-6 or IL-21 (Fig. 6D), providing additional evidence that activation of 5-LOX, as opposed to 15-LOX, promotes survival of WM cells.
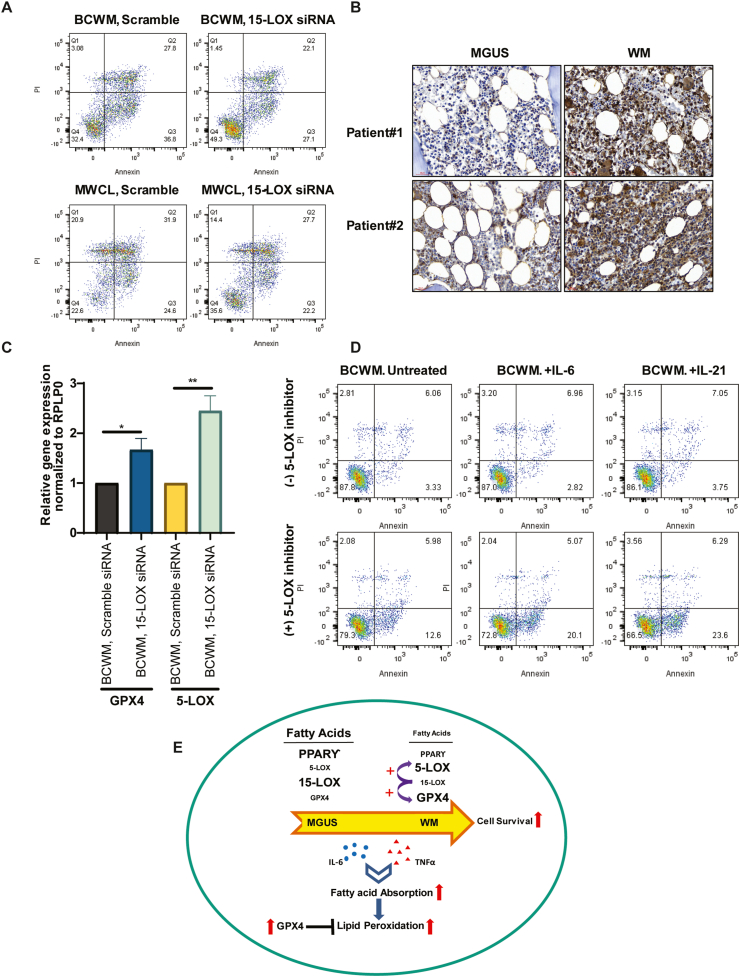
The effect of 5-LOX or 15-LOX inhibition on WM cells gene expression and cell survival. A) Representative Annexin/PI staining shows increased cell viability of WM cells following transfection with 15-LOX siRNA. B) IHC staining comparing the expression of GPX4 in MGUS and WM patients' BM sections (brown color, 40× magnification). C) Bar graphs show the effect of 15-LOX knock-down on 5-LOX and GPX4 gene expression. Significant values are depicted as *p < 0.05, **p < 0.01. D) Annexin/PI staining shows percentage of apoptotic cells in response to IL-6 or IL-21 treatment, with or without 10 μM CJ-13,610. E) Schematic representation showing data summary describing how changes in the fatty acids' metabolism promote WM tumor cell survival. (For interpretation of the references to color in this figure legend, the reader is referred to the Web version of this article.)
Discussion
The pathogenesis of WM is primarily attributed to the somatic mutations found predominantly in MyD88 and CXCR4 genes [28]. However, mutations of these genes has also been identified in the pre-malignant condition of IgM-MGUS, questioning the involvement of such mutations in the transformation of MGUS to WM [5]. Therefore, it is essential to identify additional mechanisms orchestrating the transition from MGUS to symptomatic disease.
Given the key role of metabolism in regulating tumorigenesis, we took advantage of comprehensive proteomics and metabolomics analyses to explore the discriminating metabolic features between MGUS and WM. Proteomics analysis of the serum showed distinct clustering of normal, MGUS, and WM patients' samples. However, MGUS and WM samples were clustered closer than normal samples, indicating that they are related disorders. This was consistent with previous reports indicating a higher degree of phenotypical and genetic similarity between MGUS and WM clonal B-cells [5,6]. We identified a few unique proteins in WM but not in MGUS samples, including IGFBP1, TFRC and Hemicentin 2 (HMCN2). Previous data have reported increased expression of IGFBP1 and its association with an elevated risk of prostate or pancreatic cancer [29,30] or resistance to therapy in breast cancer [31]. While TFRC is associated with iron metabolism and anemia [32], the presence of TFRC in the serum of the patients with Hodgkin or non-Hodgkin's lymphoma is shown to correlate with disease severity rather than iron-deficiency anemia [33]. Our data showing the presence of IGFBP1 and TFRC in the WM, but not MGUS serum, could be a prognostic and diagnostic indication of disease transformation.
Here, pathway analysis of the upregulated proteins in WM versus MGUS revealed nuclear receptor activation, LXR/RXR in WM. LXR/RXR belongs to the nuclear receptor family of ligand-activated transcription factors involved in lipid homeostasis and fatty acid metabolism [34]. Previous reports indicate that PUFA inhibits LXR binding to LXR response elements and suppresses sterol regulatory element-binding protein 1c expression (SREBP-1), which is involved in fatty acid metabolism [35,36]. Using metabolomics analysis of lipids, we identified significantly altered fatty acid, steroids; prostaglandins and dicarboxylic acids levels, most of which were downregulated in WM compared to MGUS samples. Disturbed serum fatty acid levels, such as a reduced level of PUFA, have previously been reported in the aggressive forms of non-Hodgkin lymphoma [37]. Significant reduction of vitamin D2 and provitamin D3 (7-dehydrocholesterol) was detected in WM. Low levels of serum vitamin D have also been shown in most patients with Diffuse Large B-cell Lymphoma (DLBCL), Chronic Lymphocytic Leukemia (CLL), and multiple myeloma (MM) [38]. The inhibitory effect of vitamin D on the clonogenic growth of normal and malignant lymphoid B cell progenitors has also been reported [39]. Moreover, vitamin D has been shown to downregulate the genes involved in growth and survival MyD88 mutated DLBCL [40]. Our data showing reduced vitamin D levels is consistent with the increased proliferation of malignant B-cells in WM.
We identified a significant reduction of serum SCFA and dicarboxylic acids in WM. SCFAs can inhibit histone deacetylases (HDACs) and exert an anti-proliferative effect in colon cancer [41,42]. The reduced levels of SCFA in WM could be an indication of increased tumor cell survival. In prostate and ovarian cancer cells, the transport of dicarboxylic acids into the tumor cells provides an energy source for mitochondria [43], so the reduced levels of these metabolites could indicate their active transport and subsequent utilization for fueling the mitochondria in WM cells. We also showed that the lipid or fatty acid levels are changed in WM patients post-therapy, supporting previous reports demonstrating that aberrant plasma levels of fatty acids could affect the therapeutic response in non-Hodgkin lymphoma [44].
We found that the metabolite derived from arachidonic acid metabolism (AEA) was higher in the WM than MGUS serum. Arachidonic acid is an ω-6 PUFA released from the cellular phospholipids via catalysis by PLA2 and oxidized by LOXs to generate eicosanoids, the metabolites crucial for inflammatory responses [18]. We identified increased 5-LOX, but instead reduced 15-LOX expression in WM versus MGUS samples, indicating the differential role of these enzymes in WM and MGUS.
We also observed increased expression of 5-LOX in two WM cell lines in response to IL-6 and TNFα treatment, two upstream regulators of several altered proteins between WM and MGUS. Moreover, inhibition of 5-LOX increased apoptotic cell death in response to IL-6 or IL-21, indicating that increased 5-LOX could promote WM cell survival. The link between increased expression of 5-LOX and tumorigenesis has been previously described [17]. As opposed to 5-LOX, suppression of 15-LOX promoted WM cell viability. These data are in keeping with studies showing a tumor suppressor function for 15-LOX in several malignancies, including prostate, breast, and colorectal cancer [[45], [46], [47]].
A previous report indicated that the anti-tumorigenic effect of 15-LOX is exerted via PPARγ-mediated inhibition of NFκB [48], a transcription factor that has an established role in the pathogenesis of WM [49]. Our data showed that WM BM sections had lower PPAR family protein expression than MGUS. PPARs are well-known regulators of lipid metabolism and inflammation, with PUFAs and eicosanoids acting as their ligands [50]. In multiple myeloma, PPARϒ is shown to reduce cell growth and viability partly by inhibiting IL-6 secretion by BM stromal cells [51]. Low level of PUFA and reduced expression of PPARs in WM could shift the lipid metabolism to increase WM tumor cell growth. We also showed that in response to cytokines IL-6 and TNFα, there was increased lipid absorption into the WM cells, accompanied by elevated lipid peroxidation. Interestingly, lipid peroxidation was also higher in WM than MGUS samples.
Increased lipid peroxidation is a process related to iron-dependent, non-apoptotic cell death, called ferroptosis, which occurs in increased reactive oxygen level and insufficient GPX4 activity [52]. Our data showing higher GPX4 expression in WM indicate that elevated lipid peroxidation is counteracted by GPX4 activity. Furthermore, our data showing the upregulation of GPX4 in response to 15-LOX knock-down further strengthens the fact that GPX4 drives tumor cell survival in WM.
In summary, our results show that many lipids and fatty acids metabolites were downregulated in WM versus MGUS samples. These reductions were associated with diminished expression of 15-LOX and the PPAR family of nuclear receptors, and a reciprocal increased expression of 5-LOX and GPX4. Treatment with cytokines, IL-6 and TNFα, increased lipid absorption and lipid peroxidation in WM cells. We identified that knock-down of 15-LOX increased WM cell viability, the effect that was accompanied by increased expression of 5-LOX and GPX4, indicating that suppressed 15-LOX expression promotes survival and proliferation of the WM cells (Fig. 6E). These data highlight the novel metabolic role played by lipids in contributing to the progression of IgM-MGUS to WM. Further understanding the metabolic pathways that benefit tumor cells survival is therefore crucial in developing future therapeutic interventions for WM.
Author contributions
SJ designed the experiments, performed the experiments, and wrote the manuscript; JS, MS, LEW, HK, XT, ZY helped in some lab works; NA performed the proteomic analysis and analyzed the proteomic dataset. AB supported part of bioinformatics analysis; JP involved in reviewing patients database; AJN and RAK involved in advising and editing the manuscript; SMA supervised the study and provided scientific inputs. All authors read and revised the manuscript.
Declaration of competing interest
There is no conflict of interest to report.
References
1
2
3
4
5
6
7
8
9
10
11
12
13
14
15
16
17
18
19
20
21
22
23
24
25
26
27
28
29
30
31
32
33
34
35
36
37
38
39
40
41
42
43
44
45
46
47
48
49
50
51
Acknowledgment
The authors acknowledge the International Waldenstrom's Macroglobulinemia Foundation (IWMF), David and Janet Bingham Research Fund of the IWMF, Elting Family Research Fund of the IWMF and Adrian and Lisa Binks Foundation for supporting this study. The authors also recognize support from the Specialized Programs of Research Excellence (SPORE) in lymphoma (P50 CA97274), Mayo Clinic Center for Individualized Medicine, and the Predolin Foundation.