 Correction: Inference of past demography, dormancy and self-fertilization rates from whole genome sequence data
PLoS Genetics


- Altmetric
The mutation and recombination rates reported throughout the article are incorrect by a factor of 2. The captions of Figs 1–4, Table 2, and S1–S19 Figs are incorrect. Additionally, the Y axes of Figs 5 and 6 and S20 Fig are shifted by a factor of 2. The authors provide corrected versions here. The correct rates were used for the simulations (S2 Appendix) and as such this error does not affect the conclusions of the study.

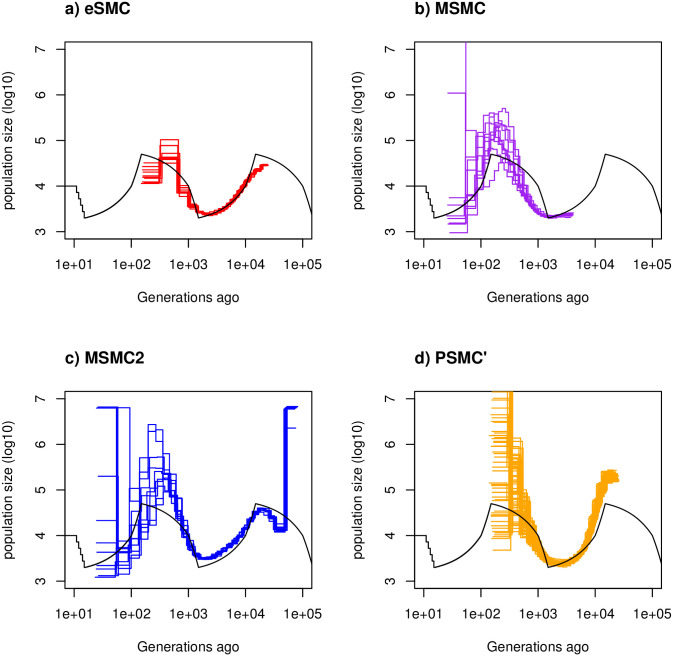
Estimated demographic history with no selfing or seed banking.
Estimated demographic history using four simulated sequences of 30 Mb under a saw-tooth scenario with 10 replicates. Mutation and recombination rates (respectively μ and r) are set to 1.25 × 10⁻⁸ per generation per bp. Therefore . The simulated demographic history is represented in black. a) Demographic history estimated by eSMC (red). b) Demographic history estimated by MSMC (purple). c) Demographic history estimated by MSMC2 (blue). d) Demographic history estimated by PSMC’ (orange).
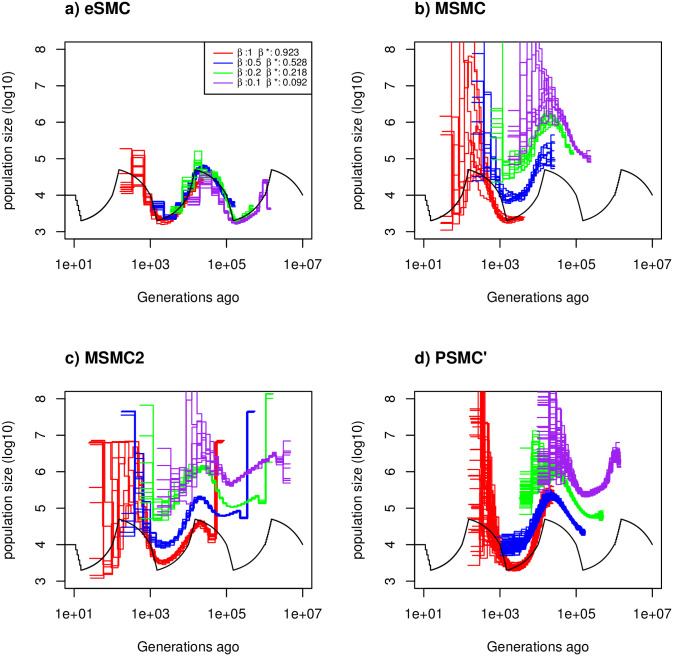
Estimated demographic history with seed banking.
Estimated demographic history using four simulated sequences of 10 Mb and ten replicates under a saw-tooth demographic scenario (black). The mutation and recombination rates are set to 1.25 × 10⁻⁸ per generation per bp. Therefore . We simulate under four different germination rates β = 1 (red), 0.5 (blue), 0.2 (green) and 0.1 (purple), hence we respectively have , 0.5, 0.2 and 0.1. The demographic history is estimated using a) eSMC, b) MSMC, c) MSMC2 and d) PSMC’. β* represents the estimated germination rate by eSMC.
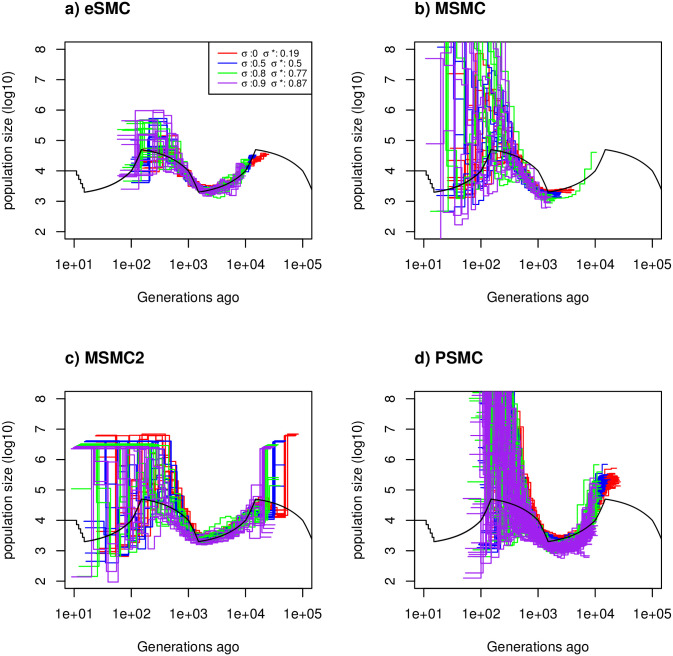
Estimated demographic history with selfing.
Estimated demographic history using four simulated sequences of 10 Mb and ten replicates under a saw-tooth demographic scenario (black). The mutation and recombination rates are set to 1.25 × 10⁻⁸ per generation per bp, and simulations were run for four different self-fertilization rates (σ = 0 (red), 0.5 (blue), 0.8 (green) and 0.9 (purple)), and as , this gives , 0.6667, 0.333 and 0.182 respectively. The demographic history is estimated using a) eSMC, b) MSMC, c) MSMC2 and d) PSMC’. σ* represents the self-fertilization rate estimated by eSMC.
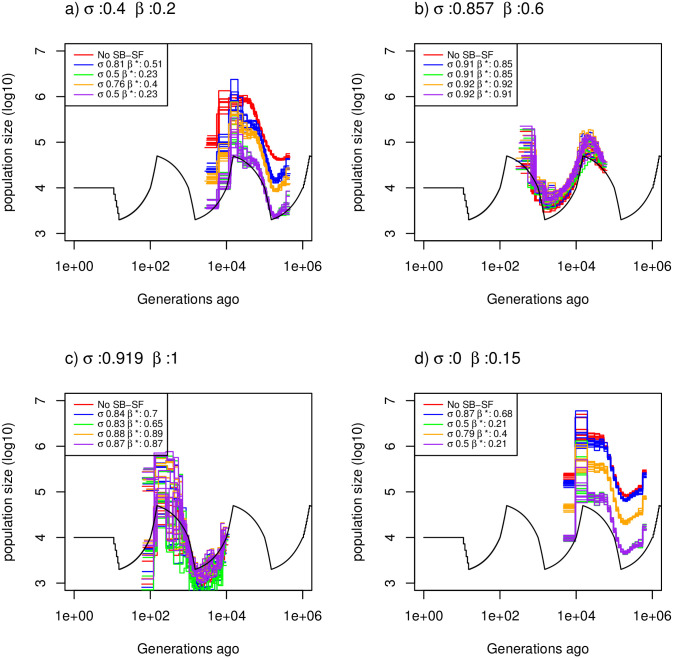
Estimated demographic history with selfing and seed banking.
Demographic history estimated by eSMC for ten replicates using four simulated sequences of 10 Mb under a saw-tooth demographic scenario and four different combinations of germination (β) and self-fertilization (σ) rates but resulting in the same . Mutation and recombination rates are set to 1.25 × 10⁻⁸ per generation per bp, giving . The four combinations are: a) σ = 0.4 and β = 0.25, b) σ = 0.75 and β = 0.6, c) σ = 0.85 and β = 1 and d) σ = 0 and β = 0.15. Hence, for each scenario . For each combination of β and σ, eSMC was launched with five different prior settings: ignoring seed-banks and self-fertilization (red), accounting for seed-banks and self-fertilization but without setting priors (blue), accounting for seed-banks and self-fertilization with a prior set only for the self-fertilization rate (green), only for the germination rate (orange) or for both (purple). σ* and β* respectively represent the estimated self-fertilization and germination rate.
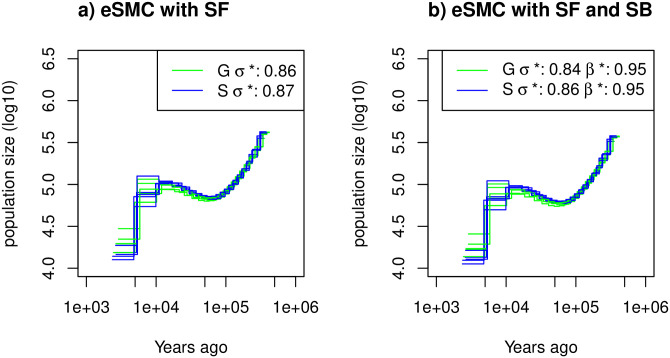
Estimated demographic history of Arabidopsis thalinana.
Demographic history of two European (Sweden (S, blue) and German (G, green)) populations of A. thaliana estimated using eSMC: a) accounting only for selfing (σ is a variable and β = 1) and b) accounting simultaneously for selfing and seed-banking (σ bounded between 0.5 and 0.99 and β bounded between 0.5 and 1). Mutation rate is set to 7 × 10⁻⁹ per generation per bp and recombination respectively set for chromosome 1 to 5 to 3.4 × 10⁻⁸, 3.6 × 10⁻⁸, 3.5 × 10⁻⁸, 3.8 × 10⁻⁸, 3.6 × 10⁻⁸) per generation per bp. σ* and β* respectively represent the estimated self-fertilization and germination rates.
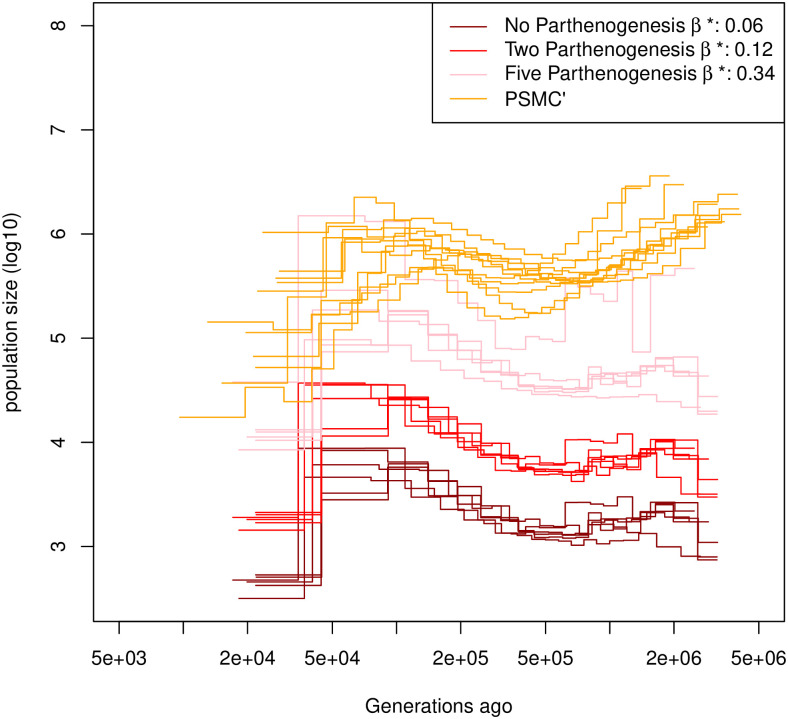
Estimated demographic history of Daphnia pulex.
Demographic history estimated by eSMC on six individuals of D. pulex accounting for egg-banks (β is a variable and σ = 0). Different assumptions concerning the number of parthenogenetic cycles before the production of the dormant egg are made: Five cycles (pink), two cycles (red) and no parthenogenesis (dark red). A subset of demographic history estimated by PSMC’ are plotted in orange. Mutation and recombination rates are respectively set to 4.33 × 10⁻⁹ and per generation per bp, where np is the number of reproductive cycles per year, parthenogenetic and sexual.

| Sequence length (Mb) | 2 Haplotypes | 4 Haplotypes | 10 Haplotypes |
|---|---|---|---|
| 1 Mb | 12 | 13 | 14 |
| 10 Mb | 14 | 16 | 31 |
| 30 Mb | 19 | 25 | 75 |
There are several errors in the Simulation results subsection of the Results as listed below.
In the Convergence property in the absence of seed-banks and self-fertilization subheading, there are errors in the first sentence of the fourth paragraph. The correct sentence is: We now assume , with the mutation and recombination rate respectively set to 1.25 × 10⁻⁸ and 6.25 × 10⁻⁸ per generation per nucleotide.
In the Convergence property with dormancy (seed- or egg-banks) subheading of the Simulation results subsection of the Results, there is an error in the first sentence of the first paragraph. The correct sentence is: Using eSMC on sequences simulated under the “saw-tooth” scenario in the presence of seed-banks (mutation and recombination rates are set to 1.25 × 10⁻⁸ per generation per bp, (Fig 2), we obtain an accurate estimation of the demography (χt) and of the germination rates (β). There is also an error in the last sentence of the first paragraph. The correct sentence is: Therefore when the molecular mutation and recombination are set to 2.5 × 10⁻⁹ per generation per bp, better fits are obtained (S12 Fig).
In the Convergence property with dormancy (seed- or egg-banks) subheading, there are several errors in the second paragraph. The correct paragraph is: For simpler demographic scenarios (constant population size, bottleneck, expansion and decrease, see S13 Fig) and μ = r = 1.25 × 10⁻⁸ per generation per bp, the germination rate and the demographic histories estimated by eSMC are accurate for most of the demographic scenarios considered, except in the case of a bottleneck scenario (as expected from previous results). In presence of strong seed-banks (β = 0.2 or 0.1) there are biases in estimations of the far past. Once again, this tendency disappears when the molecular mutation and recombination rates per site are lowered so as not to violate the infinite site model (μ and r = 2.5 × 10⁻⁹ per generation per bp, see S14 Fig).
In the Convergence property with self-fertilization subheading, there is an error in the first sentence of the first paragraph. The correct sentence is: Under the “saw-tooth” scenario with different rates of self-fertilization σ, with mutation and recombination rates set to 1.25 × 10⁻⁸ per generation per bp (), for four different self-fertilization rates σ = 0 (no self-fertilization), 0.5 (50% selfing), 0.8 (80% selfing) and 0.9 (90% selfing), we estimate the self-fertilization rate respectively at 0.19, 0.5, 0.77 and 0.87 (Fig 3). There are also errors in the fifth sentence of the first paragraph. The correct sentence is: When the mutation rate is set to 1.25 × 10⁻⁸ per generation per bp and the recombination rate to 6.25 × 10⁻⁸ per generation per nucleotide (), the self-fertilization rate is overestimated for small values of σ (S15 Fig), but well estimated for higher values of σ.
In the Convergence property with both dormancy and self-fertilization subheading, there is an error in the first sentence of the first paragraph. The correct sentence is: Here we test different combinations of seed/egg-banks and self-fertilization rates that result in the same ratio , with (setting μ = r = 1.25 × 10⁻⁸ per generation per bp). There is also an error in the eleventh sentence of the first paragraph. The correct sentence is: We also test how recombination can influence the output of these models, notably by taking a higher recombination rate (8.335 × 10⁻⁸ per site per generation), more representative of the high recombination to mutation ratio observed in some species (notably D. pulex and A. thaliana [4, 45]).
There is a minor error in S2 Appendix. The command lines for S8, 10, and 11 Fig are incorrect. Please view the correct S2 Appendix below.
Reference
1