 Selective cysteine-to-selenocysteine changes in a [NiFe]-hydrogenase confirm a special position for catalysis and oxygen tolerance
Proceedings of the National Academy of Sciences of the United States of America
![Selective cysteine-to-selenocysteine changes in a [NiFe]-hydrogenase confirm a special position for catalysis and oxygen tolerance](https://storage.googleapis.com/nova-demo-unsecured-files/unsecured/content-1766004619212-6d857fdc-8550-4cde-9a98-6bd9dc408456/cover.png)

Contributed by Dieter Söll, February 16, 2021 (sent for review January 15, 2021; reviewed by Marcetta Y. Darensbourg and Rudolf Kurt Thauer)
Author contributions: R.M.E., N.K., B.J.M., F.A.A., and D.S. designed research; R.M.E., N.K., B.J.M., and H.L. performed research; R.M.E., N.K., and F.A.A. analyzed data; and R.M.E., N.K., F.A.A., and D.S. wrote the paper.
Reviewers: M.Y.D., Texas A&M University; and R.K.T., Max Planck Institute for Terrestrial Microbiology.
1R.M.E. and N.K. contributed equally to this work.
2Present address: Redox and Metalloproteins Research Group, Max Planck Institute of Biophysics, 60438 Frankfurt am Main, Germany.

- Altmetric
Substitution of cysteine by selenocysteine is held responsible for the increased performance of many enzymes: The higher activity of [NiFeSe]-hydrogenases compared with their [NiFe] counterparts is often attributed to the Sec replacement of one active-site cysteine ligand. Replacing each of the four active-site cysteine residues in an O2-tolerant [NiFe]-hydrogenase by selenocysteine shows that this substitution alone does not overcome the inability to evolve H2 that is a characteristic of the group 1d hydrogenases. A nonbridging cysteine lying on the direct path between the Ni and an adjacent proton-relaying glutamic acid emerges as being very special: Its substitution by selenocysteine confers extreme tolerance to O2 but disrupts the proton transfer pathway, providing an example of where sulfur is superior to selenium.
In [NiFe]-hydrogenases, the active-site Ni is coordinated by four cysteine-S ligands (Cys; C), two of which are bridging to the Fe(CO)(CN)2 fragment. Substitution of a single Cys residue by selenocysteine (Sec; U) occurs occasionally in nature. Using a recent method for site-specific Sec incorporation into proteins, each of the four Ni-coordinating cysteine residues in the oxygen-tolerant Escherichia coli [NiFe]-hydrogenase-1 (Hyd-1) has been replaced by U to identify its importance for enzyme function. Steady-state solution activity of each Sec-substituted enzyme (on a per-milligram basis) is lowered, although this may reflect the unquantified presence of recalcitrant inactive/immature/misfolded forms. Protein film electrochemistry, however, reveals detailed kinetic data that are independent of absolute activities. Like native Hyd-1, the variants have low apparent KMH2 values, do not produce H2 at pH 6, and display the same onset overpotential for H2 oxidation. Mechanistically important differences were identified for the C576U variant bearing the equivalent replacement found in native [NiFeSe]-hydrogenases, its extreme O2 tolerance (apparent KMH2 and Vmax [solution] values relative to native Hyd-1 of 0.13 and 0.04, respectively) implying the importance of a selenium atom in the position cis to the site where exogenous ligands (H−, H2, O2) bind. Observation of the same unusual electrocatalytic signature seen earlier for the proton transfer-defective E28Q variant highlights the direct role of the chalcogen atom (S/Se) at position 576 close to E28, with the caveat that Se is less effective than S in facilitating proton transfer away from the Ni during H2 oxidation by this enzyme.
Hydrogenases catalyze highly efficient H2 activation, providing a paradigm for renewable hydrogen technologies (1). In a small subgroup of [NiFe]-hydrogenases from sulfate-reducing bacteria and methanogens, natural substitution of cysteine (Cys; C) for selenocysteine (Sec; U) occurs in the active site (Fig. 1) (2). The [NiFeSe]-hydrogenases (group 1a) are reported to have higher activity than their [NiFe] counterparts—a feature seen in other enzymes where C and U are swapped (234567–8). Escherichia coli produces [NiFe]-hydrogenase-1 (Hyd-1) (group 1d, O2-tolerant) and Hyd-2 (group 1c, O2-sensitive) membrane-bound [NiFe]-hydrogenases (3, 91011–12). At neutral pH in vitro Hyd-1 performs H2 oxidation only, whereas Hyd-2 can also produce H2 (reduce H+) (13). Hydrogen oxidation activity in vivo is linked to reduction of different terminal electron acceptors depending on the bacterial species, availability of different oxidants, and their redox potential, for example fumarate or, in the case of the Knallgas bacterium Ralstonia eutropha, O2. The production of Hyd-1 and Hyd-2 is maximal using fumarate as the terminal electron acceptor under anaerobic conditions (13). E. coli does not produce a [NiFeSe]-hydrogenase; Hyd-3 (group 4a) is U-containing in the formate dehydrogenase (FdhF) subunit only (3, 14).

![(A) Amino acid alignment of selected hydrogenases (Hyd-1 numbering) highlighting key residues (Cys/Sec, red; E28, green; D118, pink; R509, yellow) and differences (cyan). See also SI Appendix, Fig. S1 and Table S1. (B and D) The extended active site of Hyd-1 (Protein Data Bank [PDB] ID code 5A4M) (B) and Desulfomicrobium baculatum NiFeSe (PDB ID code 1CC1) (D) hydrogenases. (C) Representation of the active site, where “X” denotes the atom in a bridging position between the Ni and Fe atoms, the identity of which depends on the (in)active state of the enzyme (SI Appendix, Fig. S3).](/dataresources/secured/content-1766004619212-6d857fdc-8550-4cde-9a98-6bd9dc408456/assets/pnas.2100921118fig01.jpg)
(A) Amino acid alignment of selected hydrogenases (Hyd-1 numbering) highlighting key residues (Cys/Sec, red; E28, green; D118, pink; R509, yellow) and differences (cyan). See also SI Appendix, Fig. S1 and Table S1. (B and D) The extended active site of Hyd-1 (Protein Data Bank [PDB] ID code 5A4M) (B) and Desulfomicrobium baculatum NiFeSe (PDB ID code 1CC1) (D) hydrogenases. (C) Representation of the active site, where “X” denotes the atom in a bridging position between the Ni and Fe atoms, the identity of which depends on the (in)active state of the enzyme (SI Appendix, Fig. S3).
Minimally, Hyd-1 has two membrane-extrinsic subunits: HyaB containing the NiFe active site, and HyaA housing three FeS clusters to mediate long-range electron transfer (SI Appendix, Figs. S1 and S2) (15). The resulting complex, a (HyaA)2(HyaB)2 dimer, transfers electrons to a b-type cytochrome in a membrane-intrinsic HyaC subunit (10). For periplasmic [NiFeSe]-hydrogenases from sulfate-reducing bacteria, the normal redox partner is a soluble cytochrome c3 (16). In protein film electrochemistry (PFE; see below), the FeS clusters connect the active site to an electrode, enabling catalysis to be controlled and recorded (1).
The active-site metal atoms are coordinated by four conserved Cys residues (Fig. 1), two of which are terminal to the Ni and two of which are bridging (μ) between the Ni and Fe atoms. In [NiFeSe] homologs it is usually a terminal Cys (C576; Fig. 1B) that is replaced by Sec (Fig. 1D), although purported examples exist in which a bridging Cys residue C579 is substituted (2). Additionally, a nearby aspartate is substituted by serine in the active-site “canopy” of [NiFeSe]-hydrogenases (17). Other important residues include a strictly conserved arginine (R509) essential for fast and efficient H2 oxidation in Hyd-1 (4, 17), and a glutamate (E28) adjacent to C576 which appears to be a universal proton gate (18, 19).
The FeS relays are disparate (SI Appendix, Fig. S2): [NiFeSe]-hydrogenases coordinate three [4Fe-4S] clusters at all positions proximal, medial, and distal to the active site, whereas the medial site in [NiFe]-hydrogenases is a [3Fe-4S] cluster having a more positive reduction potential (202122–23). In group 1d O2-tolerant hydrogenases, such as Hyd-1, all the FeS clusters have more positive reduction potentials (24, 25); importantly, the proximal cluster is a unique [4Fe-3S]6-Cys center that is essential for O2 tolerance (9), a property requiring the invading O2 molecule to be reduced to harmless water (1, 26). The [4Fe-3S]6-Cys proximal cluster can perform two one-electron transfers back to the active site upon O2 exposure during H2 oxidation, a process requiring substantial conformational change to form the “superoxidized state” (11, 24, 25, 27, 28). A third electron is available from the high-potential medial [3Fe-4S] cluster and a fourth stems from oxidation of the Ni (SI Appendix, Fig. S3). A truly O2-tolerant [NiFe]-hydrogenase is thus also an oxidase (26). Although [NiFeSe]-hydrogenases are considered “O2-tolerant” (29), this property, requiring reductive destruction of O2, may be limited to H2 evolution (30).
Selenocysteine, the versatile 21st amino acid, appears in proteins from all domains of life (31). Sec is structurally similar to Cys, except the thiol is replaced by a selenol (Fig. 2A). Selenium and sulfur are chalcogens; thus U and C share certain chemical properties, but the electronic structures of S and Se differ sufficiently to give selenoproteins distinctive catalytic efficacies (6). The much lower pKa of selenol compared with thiol renders it fully ionized at physiological pH (32), selenoproteins are more resistant to irreversible oxidation than their C-containing homologs (5), and diselenide bonds are more stable to reduction than disulfide bonds (7, 33). Most natural selenoenzymes are oxidoreductases having an essential (for efficient catalysis) U active-site residue, and many have Cys homologs from which they evolved (34).
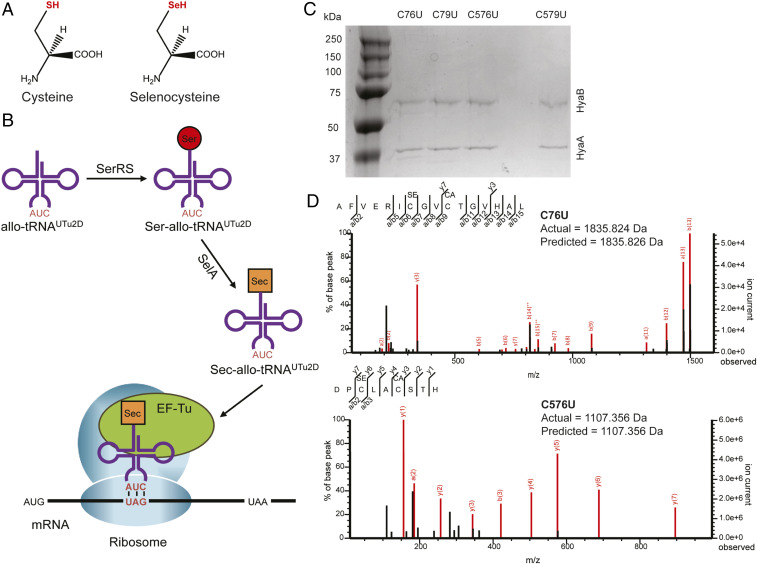
(A) Chemical structures of Cys and Sec show the selenol moiety (red) to be the only difference. (B) EF-Tu–driven site-specific incorporation of Sec at a UAG codon. mRNA, messenger RNA. (C) Coomassie blue-stained denaturing sodium dodecyl sulfate-polyacrylamide gel of Hyd-1 variants (C76U, C79U, C576U, and C579U) shows high purity in each case, comprising HyaA (37 kDa) and HyaB (66 kDa) only. (D) Tandem mass spectra of C76U and C576U show Sec incorporation at the desired position in the designated peptide. Red lines correlate with the cleavage products depicted in the peptide sequence with an accuracy of 5 ppm. See also SI Appendix, Figs. S4–S8.
Advances in genetic code expansion have provided tools for effective, site-specific UAG-programmed Sec insertion into recombinant proteins in E. coli. These in vivo methods (3536–37) rely on elongation factor EF-Tu, thus bypassing the natural complex U-specific selenoprotein synthesis machinery programmed by UGA (Fig. 2B). Recently, one of these methods was used to replace active-site Cys residues with Sec in ribonucleotide reductase (38). This encouraged us to produce Cys-to-Sec variants of Hyd-1 in E. coli by the same strategy (35, 37).
A recent paper described the consequences of replacing the Sec residue of a natural [NiFeSe]-hydrogenase with Cys, thereby retroengineering it to resemble a [NiFe]-hydrogenase (39). Here we report the opposite and complementary study, substituting each active-site Cys residue for Sec at all four coordination positions in Hyd-1. The resulting data highlight why one particular position has special significance.
Results
Production of C→U Variants of [NiFe]-Hydrogenase Hyd-1.
The scheme of site-specific UAG-programmed Sec insertion into proteins (35, 37) is shown in Fig. 2B. To ensure full maturation, Hyd-1 and its variants were expressed in E. coli from chromosomally encoded hexa-His–tagged hyaA and C→U mutant hyaB genes. The Cys codons at positions 76, 79, 576, and 579 in hyaB were individually mutated to TAG to create four E. coli strains (Materials and Methods and SI Appendix, Table S2). Transformation of these strains with the pSecUAG-Evol2 plasmid (35), which carries the genes for the machinery of sufficient Sec-allo-tRNAUTu2D synthesis, yielded the final expression strains. Expression conditions and enzyme purification were optimized (Fig. 2C), yet the amounts of the C→U variant enzymes were low compared with the wild-type enzyme (see below). Mass spectrometry determined the levels of Sec insertion at the TAG positions to be >96% for all U variants (Fig. 2D and SI Appendix, Figs. S4–S8).
Hydrogen Oxidation Activities.
Steady-state solution assays are standard first steps in determining the presence of enzyme activity. As-isolated enzymes were measured at pH 6.0, under 1 atm H2 with methylene blue as the electron acceptor. After an initial lag phase (Materials and Methods), a limiting slope is identified with Vmax. The rate obtained for native Hyd-1 under these conditions was 340 ± 20 s−1, in good agreement with previously published results (4, 17, 19). Each variant’s rate was lower than for native enzyme, decreasing in the order C79U (13% of native) > C576U (4%)/C579U (4%) > C76U (3%) (Table 1). The values for the variants are likely to be underestimates (see below), hence the importance of the electrochemical profiles that are addressed next.

| Enzyme | Native Hyd-1 | C76U | C79U | C576U | C579U |
| Steady-state H2 oxidation rate, s−1* | 338.3 ± 21.6 | 9.2 ± 1.3 | 42.6 ± 4.3 | 13.9 ± 0.5 | 11.9 ± 0.9 |
| Steady-state H2 oxidation rate, µmol of H2 oxidized per min per mg of enzyme | 202.2 ± 12.9 | 5.5 ± 0.8 | 25.5 ± 2.6 | 8.3 ± 0.3 | 7.1 ± 0.5 |
| Percentage of native activity, % | 100 | 3 | 13 | 4 | 4 |
| O2 tolerance (relative resistance to prolonged O2 exposure during H2 oxidation)† | **** | *** | *** | ***** | ** |
| ΔH‡, kJ⋅mol−1‡ | 44.7 ± 0.9 | 58.0 ± 1.2 | 55.1 ± 0.8 | 65.3 ± 2.6 | 45.6 ± 4.4 |
| Apparent KMH2, µM† | 36.8 ± 8.2 | 21.9 ± 5.9 | 5.3 ± 0.7 | 4.7 ± 2.7 | 8.0 ± 5.0 |
Errors are standard means (at least three repeats).
* Determined at approximately 0 V via solution assay, 25 °C, pH 6.0, with methylene blue as electron acceptor.
† Determined at 0 V via PFE, 37 °C, pH 6.0. The effect of C-to-U substitutions on O2-tolerance is ranked out of 5 by an asterisk.
‡ Determined at 0 V via PFE, 2 to 42 °C, pH 6.0.
Electrochemical Profiles.
Complementing solution assays, PFE delivers data that do not depend on the activity of an overall sample. With just traces of enzyme attached to an electrode, cyclic voltammograms (CVs) give a characteristic signature of an enzyme’s activity, where current is directly proportional to catalytic turnover rate. The actual number of electroactive enzyme molecules is rarely known as it requires analysis of peak-type signals due to electron-transfer sites in the absence of turnover; no such signals have been detected for Hyd-1 or variants using conventional CVs (40). Nevertheless, regardless of how much active enzyme is present, a CV reveals precisely how rate depends on driving force (electrode potential); it distinguishes steady-state from time-dependent processes and allows determination of apparent Michaelis constants (KMH2) and activation enthalpies (ΔH‡) from the H2 concentration and temperature dependencies of catalytic current, respectively. Thus, both KMH2 and ΔH‡ can be measured as a function of electrode potential, offering insight into the properties of different redox levels as they may alter within an enzyme. Quantitative kinetics of activation and inactivation processes are obtained from experiments carried out at a fixed electrode potential (chronoamperometry; CA) (40).
At pH 6.0, scanning at the very slow rate of 0.5 mV⋅s−1 to ensure the closest approach to steady state, all enzymes showed H2 oxidation commencing at approximately −0.3 V (Fig. 3A), reflecting an onset overpotential of ∼70 mV above the Nernstian equilibrium potential (E2H+/H2 = −0.37 V). No H+ reduction activity (which would appear as a negative current <−0.37 V) was observed (41). With the exception of C576U, the H2 oxidation current leveled out above +0.1 V. Even at such a slow scan rate, only minimal anaerobic oxidative inactivation occurred in this potential range. A small degree of reactivation—a slight current increase—appeared at approximately +0.2 V on the return scan; otherwise, forward and reverse scans corresponded closely, consistent with the steady state being maintained at each potential. The results obtained for C576U differed in that H2 oxidation activity increased markedly in a boost commencing above 0 V.
![Electrochemical profiles and response to O2. (A) CVs were scanned from −0.46 to +0.24 V and back (black arrows) at 0.5 mV⋅s−1. Other conditions: 100% H2, 1,000 standard cubic centimeters (scc) per minute, ω = 3,000 rpm, 37 °C, pH 6.0. (B) Series of CV scans from −0.46 to + 0.24 V and back at 0.5 mV⋅s−1 under 100% H2 (scan 1), then after injecting O2 (154 μM) at +0.03 V (red arrows; scan 2), and finally under 100% H2 to assess post–O2-exposure effects (scan 3). Other conditions: 100% H2, 1,000 scc per minute, ω = 3,000 rpm, 37 °C, pH 6.0. (C) The current at 0 V was first measured under 100% H2 (730 μM), then 10% (blue arrows). Increasing [O2] levels were introduced into the headspace for 600 s per increment. At 5,000 s, 100% H2 was restored and spontaneous recovery was monitored. At 7,000 s, potential steps to −0.659 V were performed for 60 or 600 s, and total recovery was monitored at 0 V. Other conditions: 37 °C, pH 6.0, Ar carrier gas, flow 1,000 scc per minute, ω = 3,000 rpm.](/dataresources/secured/content-1766004619212-6d857fdc-8550-4cde-9a98-6bd9dc408456/assets/pnas.2100921118fig03.jpg)
Electrochemical profiles and response to O2. (A) CVs were scanned from −0.46 to +0.24 V and back (black arrows) at 0.5 mV⋅s−1. Other conditions: 100% H2, 1,000 standard cubic centimeters (scc) per minute, ω = 3,000 rpm, 37 °C, pH 6.0. (B) Series of CV scans from −0.46 to + 0.24 V and back at 0.5 mV⋅s−1 under 100% H2 (scan 1), then after injecting O2 (154 μM) at +0.03 V (red arrows; scan 2), and finally under 100% H2 to assess post–O2-exposure effects (scan 3). Other conditions: 100% H2, 1,000 scc per minute, ω = 3,000 rpm, 37 °C, pH 6.0. (C) The current at 0 V was first measured under 100% H2 (730 μM), then 10% (blue arrows). Increasing [O2] levels were introduced into the headspace for 600 s per increment. At 5,000 s, 100% H2 was restored and spontaneous recovery was monitored. At 7,000 s, potential steps to −0.659 V were performed for 60 or 600 s, and total recovery was monitored at 0 V. Other conditions: 37 °C, pH 6.0, Ar carrier gas, flow 1,000 scc per minute, ω = 3,000 rpm.
To obtain apparent Michaelis constants (KMH2) as a function of potential, CVs for each enzyme were recorded over the H2 concentration range 2 to 730 μM. The current at each given potential during the scan in the direction of increasing (positive) potential was averaged with that recorded at the same potential on the reverse scan (thus cancelling the contribution from electrode capacitance). Average currents recorded over the range −0.15 to +0.24 V (where the driving force for H2 oxidation is high and oxidative inactivation is minimal) were plotted against H2 concentration; KMH2 values were then obtained using the Michaelis–Menten equation (Origin Pro-2020). All enzymes showed a similar potential dependence for KMH2 (Fig. 4A), ranking as C79U/C576U/C579U < C76U < native Hyd-1 at 0 V (Table 1). The increase as the potential becomes more positive may reflect the underlying dependence of kcat on electron transfer rate, noting that KM = (koff + kcat)/kon, where koff and kon are the rates of H2 binding and dissociation (1).
![(A) Apparent KMH2 values at each potential were determined by measuring CVs between −0.659 and +0.241 V at 5 mV⋅s−1 in 2 to 730 μM H2. Total gas flow rate (Ar carrier gas) 1,000 scc per minute, 37 °C, pH 6.0, ω = 3,000 to 4,000 rpm. (B) Activation enthalpies ΔH‡ at different potentials were determined by measuring CVs under 100% H2 from −0.659 to +0.241 V at 5 mV⋅s−1 over the temperature range 2 to 45 °C. Gas flow 1,000 scc per minute, pH 6.0, ω = 1,000 rpm. (C) Steady-state H2 oxidation rates and ΔH‡ at 0 V (Table 1). Turnover frequencies (TOF; triangles) for native Hyd-1 [the asterisk indicates a previously published result (19)], Sec variants, and R509K (4, 17). (D) Summary: R, response to prolonged exposure to 104 μM O2; S, ability to recover H2 oxidation activity spontaneously; T, total recovery level after applying −0.659 V. All error bars represent the standard error of at least three repeats.](/dataresources/secured/content-1766004619212-6d857fdc-8550-4cde-9a98-6bd9dc408456/assets/pnas.2100921118fig04.jpg)
(A) Apparent KMH2 values at each potential were determined by measuring CVs between −0.659 and +0.241 V at 5 mV⋅s−1 in 2 to 730 μM H2. Total gas flow rate (Ar carrier gas) 1,000 scc per minute, 37 °C, pH 6.0, ω = 3,000 to 4,000 rpm. (B) Activation enthalpies ΔH‡ at different potentials were determined by measuring CVs under 100% H2 from −0.659 to +0.241 V at 5 mV⋅s−1 over the temperature range 2 to 45 °C. Gas flow 1,000 scc per minute, pH 6.0, ω = 1,000 rpm. (C) Steady-state H2 oxidation rates and ΔH‡ at 0 V (Table 1). Turnover frequencies (TOF; triangles) for native Hyd-1 [the asterisk indicates a previously published result (19)], Sec variants, and R509K (4, 17). (D) Summary: R, response to prolonged exposure to 104 μM O2; S, ability to recover H2 oxidation activity spontaneously; T, total recovery level after applying −0.659 V. All error bars represent the standard error of at least three repeats.
Provided [H2] >> KMH2, catalytic currents measured for different temperatures allow determination of activation energies relating to the turnover frequency, kcat. From transition-state theory, ΔH‡ at any given potential is obtained from the gradient (−ΔH‡/R) of the Eyring plot (SI Appendix, Fig. S9). A series of CVs were performed at temperatures in the range 2 to 45 °C. As above, the average currents recorded at −0.15 to +0.24 V were used to populate the Eyring plots. Apart from C576U, the variants showed a similar potential dependence for ΔH‡ (Fig. 4B) increasing as the potential is raised from −0.15 to 0 V and then decreasing. In contrast, C576U showed a larger, linear potential dependence, ΔH‡ decreasing from almost 70 kJ⋅mol−1 at −0.15 V to 55 kJ⋅mol−1 at +0.24 V. Values at 0 V are given in Table 1 and Fig. 4C.
Tolerance to Transient O2 Exposure.
The effect of oxygen on catalytic activity is determined in the first instance by injecting a small quantity at a suitable potential while a CV is scanned. For each enzyme, a CV at 0.5 mV⋅s−1 was recorded between −0.46 and +0.24 V (labeled as “1” in Fig. 3B). During the subsequent cycle (“2”), O2-saturated buffer (initially 154 μM O2) was injected during the forward scan at +0.03 V (where anaerobic inactivation and direct O2 reduction by the electrode are minimal). By the time the scan reached the positive limit, O2 had been completely flushed from the headspace by the continuous flow of 100% H2. For native Hyd-1, the H2 oxidation current dropped initially by 75% before immediately starting to recover. On the return scan to lower potential the enzyme reactivated sharply, and the current at +0.1 V overlaid with the following scan (“3”). Hence, reactivation from aerobically-generated inactive states is complete and spontaneous—it does not require harsh reducing conditions. The immediate loss of activity upon O2 exposure was most dramatic for C76U, which retained only 5% initial activity. The C79U and C579U variants responded similarly to native Hyd-1, losing ∼80 and ∼75% of initial activity, respectively. The C76U and C79U variants immediately began recovering some activity, whereas C579U showed no recovery until all O2 had been removed. In stark contrast, C576U behaved very differently: Injection of O2 resulted in just a slight drop in current (∼15% loss), and recovery started to occur even while O2 was present.
Tolerance to Prolonged O2 Exposure.
By examining the potential and time dependencies of catalytic activity as the enzyme encounters O2 at different constant concentrations, a picture is assembled of the success with which each variant handles aerobic conditions. We define O2 tolerance as the ability to sustain H2 oxidation in the continued presence of O2 (9, 42). In the transient exposure experiments described above, the O2 level drops as it is flushed out. To determine the response to prolonged, constant O2 exposure, CA experiments were conducted at a constant potential of 0 V, at which anaerobic oxidation of the enzymes is negligible, while O2 was introduced into the gas flow (Fig. 3C). The H2 oxidation current was recorded under 100% H2 before adjusting to 10% H2. The O2 level was then increased stepwise (1 to 10% O2) over a period of 3,200 s, and then at 5,000 s the gas composition was returned to 100% H2. In all cases the H2 oxidation current started to recover spontaneously. To check that no additional current was recoverable by applying a more negative potential, −0.659 V was imposed for 60 to 600 s, periodically returning to 0 V to check for H2 oxidation current changes. As already suggested by the transient O2-exposure experiments, C576U showed extremely high O2 tolerance, incurring very little attenuation in current with each increase in O2. Even at 104 μM O2 (10% O2), ∼70% of the initial current in 100% H2 was maintained. At the same O2 level, native Hyd-1 maintained ∼35% activity while C76U and C79U were rendered almost inactive. The C579U variant did not display a plateau in current after each incremental step in O2 concentration, suggesting that the inactivation rate far outpaces reactivation, and it was the only variant for which substantial reactivation was gained by the application of the more reducing conditions (−0.659 V). Fig. 4D summarizes the results obtained for each variant.
Discussion
Our results add important detail to complement the general consensus that natural selenoproteins are more active than their Cys-containing counterparts (16, 39, 434445–46). An important factor in our discussion is that the electrochemical profiles generated by PFE are independent of absolute activity, as the effect of having only a small fraction of active enzyme molecules translates only as a lowering of current—the amplitude of the CV or CA. Consequently, most factors influencing activity, such as electrode potential, concentrations of reactant and inhibitors, and temperature, are observed with a high degree of reliability. Like native Hyd-1, all U variants lack the ability to reduce H+ and have the same onset potential for H2 oxidation, confirming that this property is independent of the nature of active-site Ni coordination. The conclusion is significant because the naturally occurring [NiFeSe]-hydrogenases with U substitution at Hyd-1 position 576 are highly active, reversible H2 activators (30, 47, 48). The strong catalytic bias toward H2 oxidation displayed by Hyd-1 and other O2-tolerant [NiFe]-hydrogenases has been proposed to arise primarily from the unusually high reduction potentials of electron-transferring FeS centers, particularly the distal [4Fe-4S] cluster (41, 49). The KMH2 values are all lower than for native Hyd-1, showing that single Sec replacements increase rather than lower the enzyme’s affinity for H2.
As summarized in Fig. 4C, all variants apart from C579U (a bridging variant) show a higher activation enthalpy for H2 oxidation compared with native Hyd-1, values at 0 V for C76U, C79U, and C576U being higher by ∼13, 10, and 21 kJ⋅mol−1, respectively. Significantly, the C576U variant also displays a more marked potential dependence than the others (Fig. 4B), ΔH‡ decreasing from nearly 70 kJ⋅mol−1 at −0.15 V to 58 kJ⋅mol−1 at +0.15 V, a value similar to C76U. Conversely, ΔH‡ for C579U is identical to that for native Hyd-1. The higher ΔH‡ measured for three of the Sec variants suggests that their turnover rates are limited by an energy barrier; this is in marked contrast to the outer-shell canopy variant R509K (Fig. 1), where the low rate coincides with a lower ΔH‡ (Fig. 4C) (4, 17). The X-ray structural evidence for conservation of Ni coordination in R509K meant in that case that the 100-fold lower rate could be interpreted with confidence, leading to the conclusion that substituting the pendant arginine by lysine introduces an unfavorable activation entropy (i.e., a relatively ordered transition state) (4).
Wider consideration of the data reveals a tight functional connection between ligand C/U576 and the adjacent E28, implicating their dual role in proton transfer: The link appears as a common signature in the PFE data that would undoubtedly evade detection by other means. The complex potential dependence for catalytic H2 oxidation by C576U closely resembles that observed for E28Q investigated earlier (19), a fact displayed well by overlaying their unusual CVs (Fig. 5). A wealth of evidence currently supports the role of E28 in transferring at least one catalytic proton in [NiFe]-hydrogenases (SI Appendix, Fig. S3), the immediate relay partner being the Cys-S located here at position 576 (19, 50). Our results now show that these two residues operate in close harmony during catalysis, disruptions to either residue producing the same effect on the catalytic potential profile (see SI Appendix, Fig. S10 for pH dependencies). Referring to Figs. 3A and 4B, the potential at which the catalytic boost occurs (+0.05 V) coincides closely with removal of the high ΔH‡ barrier, a connection allowing us to conclude (notwithstanding the lower limit for activity in solution assays) that C576U bears an unusually high energy barrier under normal mild oxidation conditions. In PFE, discontinuities in the current/potential dependence indicate a switch in enzyme state linked to a redox transition, often reflecting a change in the rate-determining step. By correlating PFE and high-resolution X-ray data, it was concluded that the large rate enhancement at high potential observed for E28Q coincides with superoxidation of the proximal cluster and an accompanying structural change that allows a H2O/OH− to enter close to the carboxylate side chain and rescue the dysfunctional proton relay (19). Extending this reasoning, the following kinetic consequences would apply for C576U: 1) Like E28Q, replacement of Cys-576 by Sec similarly allows entry of H2O/OH− when the proximal cluster is superoxidized, thus enhancing proton transfer away from the site of H2 oxidation. 2) An obvious inference from 1 is that the selenocysteine is less proficient than the cysteine it replaced (otherwise any such activity-enhancing transition would be redundant). 3) An interesting fundamental issue is raised, namely that all else being equal (noting that naturally occurring [NiFeSe]-hydrogenases bear further structural differences; Fig. 1 and SI Appendix, Fig. S2), a Ni-ligated Se can be a poorer catalyst partner than a Ni-ligated S. In this context, it appears that the higher nucleophilicity expected for a Se (which would be useful kinetically) is offset by its much lower proton affinity (reflected in the lower pKa for Sec compared with Cys).
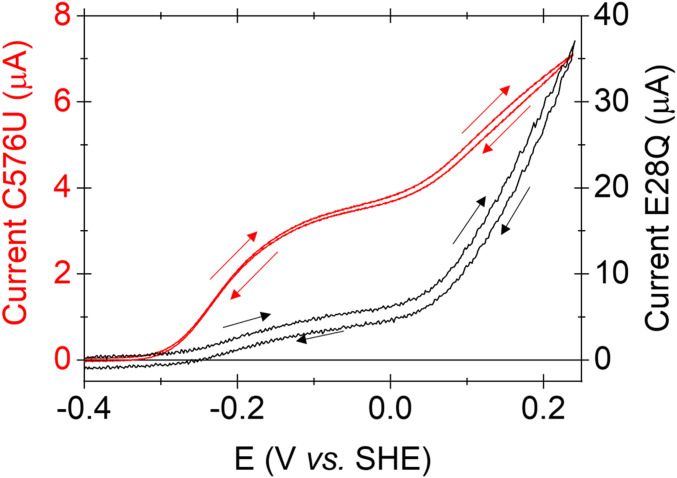
Overlaid electrocatalytic oxidation profiles of C576U (red) and E28Q (black). Cyclic voltammograms were scanned between −0.6 and +0.241 V at 5 mV⋅s−1 and back (arrows). Conditions: 100% H2 at 1,000 scc per minute, pH 6.0, and 37 °C (C576U) or 30 °C (E28Q), ω = 1,000 rpm. A modified PGE-multiwalled carbon nanotube electrode was used for E28Q (19).
The C576U variant also displays an increased tolerance to O2, rendering it almost perfect in its ability to catalyze H2 oxidation aerobically. The observations made for C576U, first by CVs for transient exposure to O2 (Fig. 3B), then by CA for prolonged exposure (Fig. 3C), are unambiguous and prove that a hydrogenase having good H2 oxidation ability can also possess extreme O2 tolerance. Provided the local structure has not been altered significantly, the singularly increased ability to deal with invading O2 is traced to the presence of a Se donor to Ni at position 576. Two notable facts are important: 1) The greater O2 tolerance is unlikely to stem from improved H+ transfer efficacy (needed to increase the rate of O2 destruction) since the Cys-to-Sec substitution resulted in a lower catalytic rate with a high-energy barrier attributed to a H+ transfer limitation. 2) The advantage of having a Se at position 576 may relate directly to its position cis to that occupied by the hydride intermediate and (by extension) molecular H2 and O2. This stereochemical preference suggests two options: 1) The Se atom, due to its larger size or unknown influence over the side-chain conformation, hinders the initial binding of an O2 molecule; or 2) the greater nucleophilicity of Se promotes its attack on an electron-deficient reactive oxygen intermediate, producing a selenoxide moiety (Se-O) that is more easily reduced (compared with S-O) to release H2O, that is, the Se atom serves as a decoy (51).
Finally, native Hyd-1 is not a standard hydrogenase, as it exhibits lower H2 oxidation activity, does not evolve H2 at neutral pH, and is already very O2-tolerant; it might therefore be argued that it was not a good target to pursue. However, these properties are highly tuned characteristics of Hyd-1, thereby sensitizing quantitative comparisons. Further, the presence of the unusual proximal cluster, superoxidation of which relieves an otherwise sluggish H+ transfer pathway, has served an unexpected role in pinpointing the role of one specific inner-sphere ligand during H2 oxidation.
Materials and Methods
Plasmid Preparation and Construction of Expression Strains.
Native hyaA containing a C-terminal His6 tag (hyaA.his6) and hyaB genes in a pUC18 plasmid (Addgene; plasmid 50004) was used as a template for mutagenesis (52). Cysteines at positions 76, 79, 576, and 579 in hyaB were mutated to TAG using the QuikChange II Site-Directed Mutagenesis protocol (Agilent Technologies). Flanking regions (50 bp) homologous to the surrounding hyaA-hyaB gene sequence were added to both ends of the successful plasmids in preparation for recombination. Primers were acquired from Keck Biotechnology Resource and DNA sequencing was performed at the Keck DNA Sequencing Facility at Yale University. The resulting TAG variants were used to replace the hyaA and hyaB genes in the genome of ME6 cells (E. coli K-12 Δgor ΔselABC Δfdh strain) via recombination (53) to generate strains NK157 to NK160 (SI Appendix, Table S2).
Protein Expression and Purification.
To incorporate Sec into Hyd-1, pSecUAG-Evol2 (Addgene; plasmid 163148) encoding allo-tRNAUTu2D was transformed into the appropriate NK strain (SI Appendix, Table S2) (35). Overnight cultures (6 mL) of Luria Broth (LB) containing antibiotics were grown aerobically at 37 °C and then transferred to a 625-mL preculture for 8 h. These precultures were inoculated into glass bottles containing 6 L LB media with 0.5% (volume/volume) glycerol, 25 mM sodium fumarate, 0.1% (weight/volume) arabinose, 10 μM sodium selenite, and 50 μg/mL kanamycin. Variants were expressed anaerobically at 37 °C overnight. All strains were harvested and their membranes were solubilized for Hyd-1 purification by Ni-affinity chromatography as previously described (13, 19).
Enzyme Evaluation.
All variant enzymes were produced to high purity as for native Hyd-1 (19) with two bands assignable to the HyaA (37 kDa) and HyaB (66 kDa) subunits (Fig. 2C). Yields of Sec variants were much lower (1 to 4%) than obtained for native Hyd-1 (13). Expressing native Hyd-1 under identical conditions showed a 34% yield decrease, thereby adjusting the variant yields to 2 to 6% that of native Hyd-1. The positions and amounts of Sec inserted into the Hyd-1 variants were confirmed by liquid chromatography-tandem mass spectrometry (details in SI Appendix) (Fig. 2D and SI Appendix, Figs. S4–S8).
Steady-State H2 Oxidation Activities.
Solution assays were performed at 25 °C, pH 6.0, using an Ocean Optics S2000 spectrometer controlled by OOIBase32 software housed in a glovebox (Belle Technologies; O2 < 5 parts per million; ppm). All activities were obtained using as-isolated enzymes of known concentration [0.2 to 0.3 mg/mL, determined using A280, a molecular mass of 103,100 Da, and an extinction coefficient (ε) of 162,730 M−1⋅cm−1 estimated from the amino acid sequence using the online ExPASy database (54)]. Enzyme stock was diluted (20- to 1,000-fold) in buffer of 15 mM each 2-Morpholinoethanesulfonic acid (MES), (4-(2-hydroxyethyl)-1-piperazineethanesulfonic acid) (HEPES) , [tris(hydroxymethyl)methylamino]propanesulfonic acid (TAPS), N-Cyclohexyl-2-aminoethanesulfonic acid (CHES), and NaOAc (Melford) and 100 mM NaCl (Sigma-Aldrich). Methylene blue [25 μM; Sigma-Aldrich; ε = 22.4 mM−1⋅cm−1 at 600 nm (19)] in 50 mM potassium phosphate (Sigma-Aldrich) was constantly purged with 100% H2 (BOC) and the absorbance was monitored for 1 min before injecting 5 μL of diluted enzyme. Two processes then occur: Active enzyme catalyzes H2 oxidation by methylene blue, producing decolorization, while inactive (resting) enzyme molecules are activated by H2 and reduced methylene blue, causing an increase in color. After this initial lag phase, the maximum absorbance/time gradient was taken as the steady-state rate. Assays were repeated at least threefold, with a minimum of three separate dilutions for each enzyme.
Protein Film Electrochemistry.
All PFE was carried out in an anaerobic glovebox (M Braun; O2 < 5 ppm). The three-electrode system featured a Pt counter, a saturated calomel electrode (SCE) reference, and a pyrolytic graphite edge (PGE) working electrode (0.03 to 0.09 cm2). The potentiostat (PGSTAT128N; Metrohm Autolab) was controlled via Nova software. Potential scales were converted to versus the Standard Hydrogen Electrode (SHE) using ESHE = ESCE + 0.241 V at 25 °C (55). The PGE electrode was rotated at a speed (ω) of 1,000 to 3,000 rpm to minimize mass transport limitations. The rotator shaft was fitted snuggly into the all-glass thermostated electrochemical cell to ensure gas-tight conditions. Highest-quality gases (BOC) were mixed using mass flow controllers (Sierra). A buffer containing MES, Hepes, TAPS, CHES, and NaOAc (15 mM each; Melford) and NaCl (100 mM; Sigma-Aldrich) was used at pH 6.0, 37 °C. To facilitate comparisons, the electrode surface was wiped with a tissue after applying enzyme sufficient to achieve similar H2 oxidation currents in each experiment (40). All enzyme films were thoroughly activated to recover inactive states produced during purification and, apart from O2 inhibition studies, currents were corrected for slow natural deterioration of enzyme coverage (“film loss”) (55).
Acknowledgements
We thank Markus Englert for his early input, Christina Z. Chung for artwork contributions, and Jean Kanyo (Keck Biotechnology Resource Laboratory at Yale, supported by an NIH Shared Instrument Grant, OD01803, to the Yale School of Medicine) for devoted efforts in mass spectrometry analysis. We are grateful to Robert Stack for his enduring encouragement. B.J.M. is grateful to the John Fell Fund and the UK Solar Fuels Network. Research was supported by grants from the UK Biological and Biotechnology Sciences Research Council (BB/I022309-1 and BB/L009722/1 to F.A.A.), the National Institute of General Medical Sciences (R35GM122560 to D.S.), and, for the genetic studies, the Department of Energy Office of Basic Energy Sciences (DE-FG0298ER2031 to D.S.).
Data Availability
All study data are included in the article and/or supporting information.
References
1
2
3
4
6
7
8
9
10
11
12
13
14
15
16
17
18
19
20
21
22
23
24
25
26
27
28
29
30
31
32
33
34
35
36
37
38
39
40
41
42
43
44
45
46
47
48
49
50
51
52
53
54
55