 The number of catalytic cycles in an enzyme’s lifetime and why it matters to metabolic engineering
Proceedings of the National Academy of Sciences of the United States of America

 ,
Donald R. McCarty,
Jaya Joshi,
Jenelle A. Patterson,
Jorge D. García-García,
A. Harvey Millar
,
Donald R. McCarty,
Jaya Joshi,
Jenelle A. Patterson,
Jorge D. García-García,
A. Harvey Millar
Edited by Richard A. Dixon, University of North Texas, Denton, TX, and approved February 11, 2021 (received for review November 9, 2020)
Author contributions: A.D.H., D.R.M., and A.H.M. designed research; A.D.H. performed research; A.D.H., D.R.M., C.S.H., X.X., J.J., J.A.P., J.D.G.-G., S.D.F., N.D.T., and A.H.M. analyzed data; and A.D.H., D.R.M., C.S.H., and A.H.M. wrote the paper.

- Altmetric
The continuous replacement of enzymes and other proteins appropriates up to half the maintenance energy budget in microorganisms and plants. High enzyme replacement rates therefore cut the productivity of biosystems ranging from microbial fermentations to crops. However, yardsticks to assess what drives enzyme protein replacement and guidelines on how to reduce it are lacking. Accordingly, we compared enzymes’ life spans across kingdoms using a new yardstick (catalytic cycles until replacement [CCR]) and related CCR to enzyme reaction chemistry. We concluded that 1) many enzymes fail due to collateral damage from the reaction they catalyze, and 2) such damage and its attendant enzyme replacement costs are mitigable by engineering and are therefore promising targets for synthetic biology.
Metabolic engineering uses enzymes as parts to build biosystems for specified tasks. Although a part’s working life and failure modes are key engineering performance indicators, this is not yet so in metabolic engineering because it is not known how long enzymes remain functional in vivo or whether cumulative deterioration (wear-out), sudden random failure, or other causes drive replacement. Consequently, enzymes cannot be engineered to extend life and cut the high energy costs of replacement. Guided by catalyst engineering, we adopted catalytic cycles until replacement (CCR) as a metric for enzyme functional life span in vivo. CCR is the number of catalytic cycles that an enzyme mediates in vivo before failure or replacement, i.e., metabolic flux rate/protein turnover rate. We used estimated fluxes and measured protein turnover rates to calculate CCRs for ∼100–200 enzymes each from Lactococcus lactis, yeast, and Arabidopsis. CCRs in these organisms had similar ranges (<103 to >107) but different median values (3–4 × 10⁴ in L. lactis and yeast versus 4 × 10⁵ in Arabidopsis). In all organisms, enzymes whose substrates, products, or mechanisms can attack reactive amino acid residues had significantly lower median CCR values than other enzymes. Taken with literature on mechanism-based inactivation, the latter finding supports the proposal that 1) random active-site damage by reaction chemistry is an important cause of enzyme failure, and 2) reactive noncatalytic residues in the active-site region are likely contributors to damage susceptibility. Enzyme engineering to raise CCRs and lower replacement costs may thus be both beneficial and feasible.
As the synthetic biology revolution brings engineering principles and practices into the life sciences, biomolecules are being rethought as component parts that are used to build new biosystems and improve existing ones (12–3). Enzymes—the working parts of metabolic systems—are targets for this rethinking and are increasingly being repurposed by rational design and directed evolution (4).
Substrate specificity, catalytic efficiency, and expression level are common performance specifications for enzyme parts in metabolic engineering, but life span is not, despite its centrality in other engineering fields. Knowing an engineering component’s life span (how long it lasts in service) is critical to preventing system failures and optimizing maintenance schedules (5). Failure metrics such as “mean time to failure” (6) are consequently used widely in engineering, which distinguishes three types of failures: early, wear-out, and random or stochastic. All three have counterparts in enzymes operating in vivo (Fig. 1A) (7891011121314151617–18), but wear-out and random failures (Fig. 1A, red font) are most relevant to length of working life.

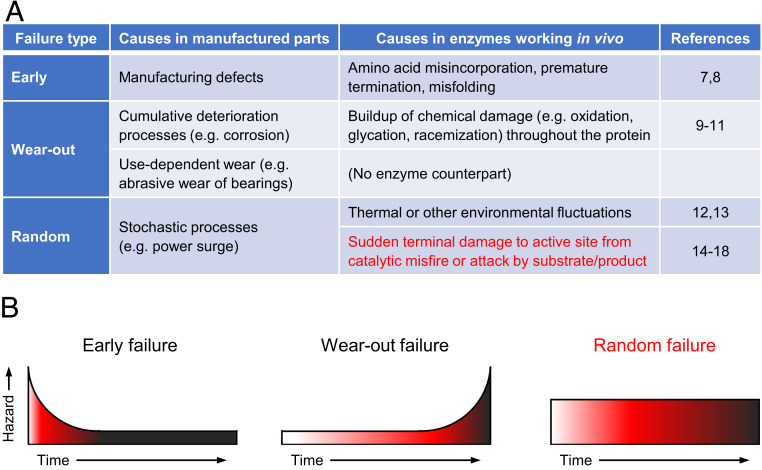
The engineering concept of component failure and its application to enzymes in vivo. (A) The types of failure in manufactured components and their counterparts in enzymes operating in vivo. (B) Schematic representation of the time dependence of the hazard rate and the cumulative probability (increasing color density) that an individual component will have failed.
In manufactured systems, wear-out failures are caused by cumulative deterioration processes or by use-dependent wear (Fig. 1A). Like all proteins, enzymes are subject to cumulative deterioration from oxidation, racemization, or other chemical events (“protein fatigue”) that can affect any part of the molecule and degrade its function (910–11). However, use-dependent wear-out has no equivalent in enzymes, i.e., enzyme performance is not progressively degraded by operation of the catalytic cycle in the way a bearing is worn down a little each time it turns (Fig. 1A). Rather, a random catalytic misfire or a chemical attack by a substrate or product on a vulnerable residue in the active-site region can instantly inactivate an enzyme, whatever its age (14151617–18). Such failures thus have a constant hazard rate and are random or stochastic, like the abrupt failure of a transistor due to a current surge (Fig. 1A).
Although the hazard of random failure does not depend on a part’s age, the cumulative probability that any individual part will experience a random failure increases with time (Fig. 1B). Given long enough, certain types of enzyme molecule may thus be doomed to have a terminal, catalysis-related accident. Such self-inflicted inactivation processes are important considerations for industrial enzymes (i.e., enzymes used ex vivo as reagents) and the number of catalytic cycles that each enzyme molecule carries out in its lifetime—often called “total turnover number”—is a key industrial performance criterion (1920–21).
The number of catalytic cycles mediated before self-inactivation could also be key to in vivo enzyme performance. Recent proteomic evidence points to damage from the reaction catalyzed as a major mode of enzyme failure and to the possibility that some reactions do more damage than others. Thus, in the bacterium Lactococcus lactis, a fivefold increase in growth rate was accompanied by a sevenfold increase in protein turnover rate (22). This near proportionality implies that L. lactis enzymes catalyze a similar number of reactions in their lifetimes, whatever the growth rate. This fits with reaction-related damage as a cause of failure: The faster the growth, the more flux through reactions, the more damage to enzymes, and the sooner enzymes fail. Similarly, protein turnover in yeast was faster when enzymes were in active use (23). Furthermore, in L. lactis, yeast, and Arabidopsis, the fastest turning-over metabolic enzymes include many with reactive substrates, products, or intermediates (SI Appendix, Table S1) (2223–24), i.e., with a high risk of spontaneous chemical damage to the active site.
The rates at which enzyme proteins are degraded and resynthesized are critical to the cellular energy economy because such turnover can consume about half the maintenance energy budget in microbes and plants (22, 2526–27). High enzyme protein turnover rates therefore potentially reduce the productivity of biosystems ranging from microbial fermentations to crops (26, 28, 29). Consistent with such reduction, fast protein turnover is associated with low biomass yield in yeast (27) and with low growth rate in Arabidopsis (30). Also, slowing the turnover of abundant, fast-turnover enzymes is predicted to substantially increase growth rate and biomass yield in plants (26, 31) and other organisms (32).
Rational design or directed evolution can now be used to tune protein turnover rates (3334–35). However, before setting out to reduce enzyme turnover it is essential to define target enzymes and to understand why they turn over fast in the first place. Accordingly, here we calculate and compare the life spans of enzymes from three kingdoms using the criterion of “catalytic cycles until replacement” (CCR) (33), defined as the moles of substrate converted per mole of enzyme before the enzyme is replaced, i.e., the following:
Results
Extraction of Proteomics and Flux Data for L. lactis, Yeast, and Arabidopsis.
Calculating CCR values for the enzymes in a cell or tissue requires 1) “proteome-wide” protein turnover data, 2) protein abundance data, and 3) measured or estimated flux rates through the enzyme reactions in operation under the conditions used to measure protein turnover (33). By matching published enzyme protein turnover and abundance data for L. lactis, yeast, and Arabidopsis leaves with estimates of the corresponding metabolite fluxes, we were able to extract all three of the values needed to calculate CCRs for 97 L. lactis enzymes, 182 yeast enzymes, and 123 Arabidopsis enzymes. All were enzymes of primary metabolism; 14 were present in all three datasets (Fig. 2A). This fairly low commonality is attributable to inherent metabolic differences between the organisms, differences in growth conditions, and gaps in the datasets.
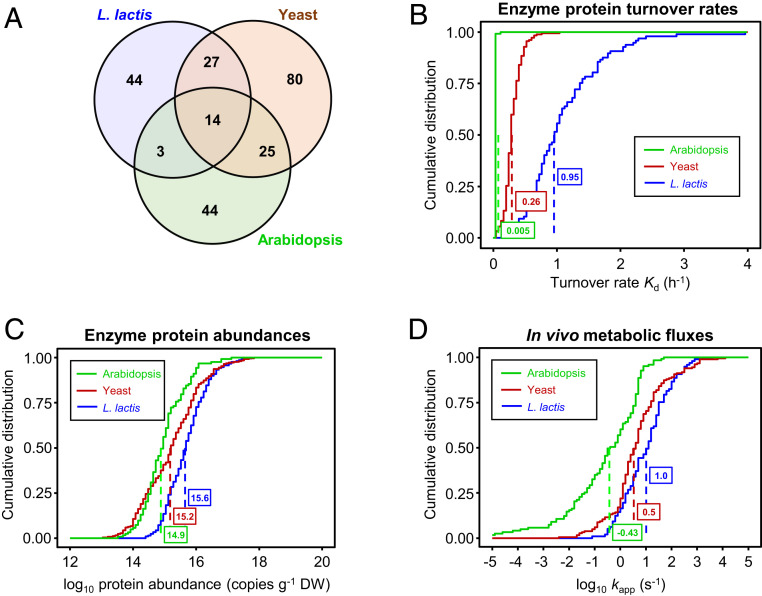
Summary of primary data from which CCR values for 97 L. lactis, 182 yeast, and 123 Arabidopsis enzymes were calculated. (A) Venn diagram showing how many enzymes having the same EC number are shared between the datasets. There are fewer EC numbers than enzymes in each dataset because each organism had several enzymes (isoforms) with the same EC number. (B–D) Cumulative distribution plots of enzyme protein turnover rates (per hour) (B), log10 enzyme protein abundances (copies per gram dry weight) (C), and log10 kapp, the estimated net in vivo metabolic flux for each enzyme (moles substrate processed per mole enzyme per second) (D). Median values are boxed.
The protein turnover rate (Kd) data were for L. lactis grown anaerobically (22), for yeast grown aerobically (23), and for leaves of Arabidopsis grown in 16-h days in moderate light (24) (Datasets S1, S2, and S3). The protein abundance data for L. lactis and yeast came from the same sources as the turnover data; the abundance data for Arabidopsis were from PaxDb (36). As for other data, we used cumulative probability plots to display the distributions of enzyme turnover rates (Fig. 2B) and abundances (Fig. 2C) for each organism. The median turnover rates (Fig. 2B) correspond to half-lives of 0.7 h in L. lactis, 2.7 h in yeast, and 5.8 d in Arabidopsis, which are in the typical ranges for these organisms (22, 23, 35). The sets of enzymes studied were thus representative in this respect. Enzyme abundances expressed per unit dry weight (Fig. 2C) were likewise as expected, the Arabidopsis median value being the lowest due to the high proportion of structural carbohydrates in leaf biomass (25).
Metabolic fluxes for L. lactis and yeast were estimated using genome-scale flux balance analysis models (37, 38), which were constrained by the growth rates, media compositions, and incubation conditions of the cells used to measure protein turnover and abundance (22, 23). For L. lactis, the faster of the two reported growth rates (0.5 h−1) was selected. Flux modeling details are given in Materials and Methods. Arabidopsis leaf fluxes were estimated from biomass composition (Dataset S3), Kyoto Encyclopedia of Genes and Genomes (KEGG) biosynthetic pathways (39), and the growth rate (0.1 d−1) of the plants used to measure protein turnover (35). When expressed on a fresh weight basis, a subset of the estimated Arabidopsis fluxes agreed well (r2 = 0.91) with a corresponding set of 11 measured photosynthetic and photorespiratory fluxes (40), allowing for experimental differences in light intensity and other conditions (Dataset S4). The flux through each enzyme reaction was divided by enzyme abundance from proteomics to give the apparent catalytic rate in vivo (kapp, per second) (41, 42) (Fig. 2D). All flux estimates for reversible reactions were for the net forward direction and are consequently minimum values.
To cross-check the kapp estimates, we compared them with kcat values extracted from the BRENDA database (43) and original publications for L. lactis, yeast, and Arabidopsis if possible and for related organisms if not (Dataset S5). In this way we obtained kcat values for 78%, 30%, and 61%, respectively, of the L. lactis, yeast, and Arabidopsis enzymes with kapp values. Plotting the data for all three organisms as a log–log scatter diagram (Fig. 3A) confirmed that most (91%) of the data points fell below the 1:1 line, i.e., that, as expected, the in vivo fluxes through enzymes were generally below their maximum in vitro capacity. Plotting the data as cumulative probability distributions (Fig. 3B) further showed that the median kapp/kcat value was 30% in L. lactis but only 2.2% in Arabidopsis, with yeast between them at 7.4%. Similar values (38%, 1.8%, and 12%, respectively) can be estimated for an “average enzyme” in each organism by linear regression analysis of the scatter plots shown in Fig. 3A, based on the Bar-Even et al. (44) observation that an average enzyme has a kcat ∼ 10 s−1. These percentages are consistent with the literature on microbes (42, 45) and Arabidopsis (46), including the finding that central metabolic enzymes in Arabidopsis operate further from saturation than their prokaryotic counterparts. The cross-check thus basically validated our kapp values.
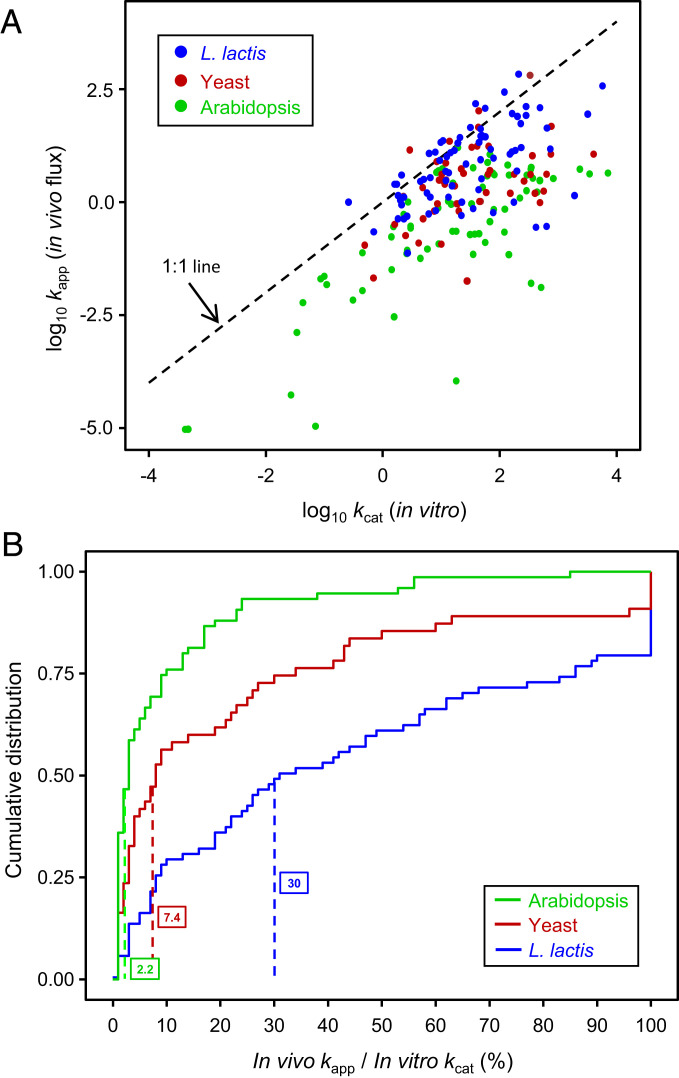
Relationships between estimated kapp values (in vivo fluxes) and published kcat values for 76 enzymes from L. lactis or other bacteria, 55 from yeast or other fungi, and 75 from Arabidopsis or other plants. (A) Scatter plot (log10 scale) of kapp vs. kcat for the enzymes from each organism. Note that most points fall below the 1:1 line. Linear regression analysis indicated that an “average” enzyme (kcat ∼ 10 s−1) operates in vivo at 38% of maximum velocity in L. lactis, at 12% in yeast, and at 1.8% in Arabidopsis. (B) Cumulative distribution plots of the kapp/kcat ratio (expressed as a percentage) for the enzymes from each organism. Values >100% were scored as 100%. Median values are boxed and marked by vertical dashed lines.
CCR Values in L. lactis, Yeast, and Arabidopsis Span at Least Five Orders of Magnitude.
Pairing the above proteomics and flux data enabled the calculation of CCR values for the listed enzymes in each organism (Dataset S6). The values were distributed over a similarly wide range in each organism, from <103 to >107 (Fig. 4A), but the distributions had significantly different median values: 3–4 × 10⁴ for L. lactis and yeast versus 4 × 10⁵ for Arabidopsis (Fig. 4A). The distributions of the CCRs for the 14 enzymes common to all three datasets showed the same pattern, i.e., the L. lactis and yeast distributions differed significantly from Arabidopsis and had much lower median values (SI Appendix, Fig. S1). The agreement between the common enzymes and the whole datasets makes it reasonable to compare the whole datasets with each other even though they consist mostly of different enzymes. These findings supported the idea (33) that CCRs, like ex vivo total turnover numbers (14), vary greatly between enzymes and organisms and prompted investigation of the variation’s mechanistic basis.
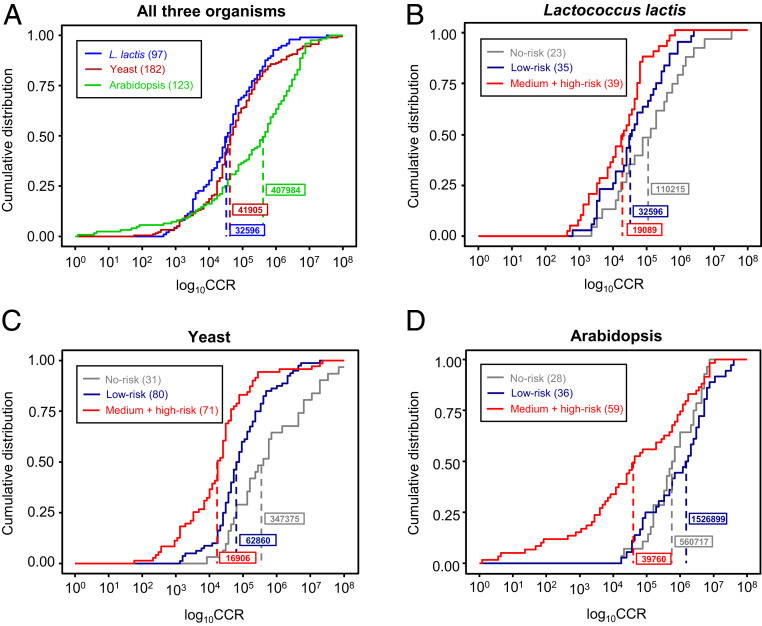
Distributions of CCR values for L. lactis, yeast, and Arabidopsis enzymes and their relationship to the chemistry of the reaction catalyzed. (A) Distribution of CCR values for each organism. The Arabidopsis distribution is significantly different from those of L. lactis and yeast with P values of <10−6 (Kolmogorov–Smirnov test) and <10−4 (Mann–Whitney U test). (B–D) Distributions of CCR values for enzymes in each organism scored as being at no, low, and medium or high risk of damage from the reaction catalyzed. In each organism, the distributions of medium- plus high-risk and no-risk enzymes are significantly different with values of P < 0.005, and the distributions of medium- plus high-risk and pooled no-risk plus low-risk enzymes are significantly different with values of P < 0.01 (Kolmogorov–Smirnov test and Mann–Whitney U test). Numbers of enzymes are in parentheses. Median values are boxed and marked by dashed lines.
Low CCR Correlates with High Risk of Chemical Damage from the Reaction Catalyzed.
To investigate mechanism, we first inspected Enzyme Commission (EC) numbers (Dataset S6) for links between CCR and enzyme class but found no consistent effects across all the three species. We therefore next looked for associations between CCR and the chemical reactivity hazards of the reaction catalyzed, the rationale being that 1) reactive metabolites attack protein side chains (47, 48); 2) many enzymes are known to be inactivated during catalysis (14, 49); and 3) enzymes at risk for active-site damage may be short-lived (14, 31) (SI Appendix, Table S1).
While other reports have qualitatively assembled lists of risks (e.g., ref. 14), we could find no precedent for quantifying degrees of hazard to enzymes’ active sites. To approach quantification, we therefore defined six nonoverlapping risk factors based on the mechanism of the enzyme reaction and the chemical properties of each substrate, product, and cofactor (Table 1). We gave each factor one, two, or four “risk points” based on the likely severity of the risk, e.g., a suicide reaction mechanism (certain inactivation) scored four points, a radical mechanism scored two, and a reactive carbonyl substrate (possible attack on a nucleophilic side chain) scored one (Table 1). Each enzyme’s risk factors were scored and the points were summed on the basis that each risk could act independently, and thus additively, to inactivate an enzyme molecule. The most frequent risk factors were a reactive or unstable substrate, product, or reaction intermediate, and the least frequent were suicide and radical mechanisms (Table 1).

| Risk factor* | Risk points | No. of enzymes | ||
| L. lactis | Yeast | Arabidopsis | ||
| 1. Suicide mechanism | 4 | 0 | 0 | 1 |
| 2. Radical mechanism | 2 | 2 | 2 | 1 |
| 3. Photoreactive substrate/product/cofactor | 1 | 7 | 10 | 13 |
| 4. Carbonyl substrate/product† | 1 | 24 | 52 | 37 |
| 5. Reactive or unstable cofactor‡ | 1 | 19 | 36 | 19 |
| 6. Reactive or unstable substrate§/product§/intermediate | 1 or 2¶ | 41 | 83 | 49 |
* Risk factors 1–6 do not overlap, i.e., each damage chemistry is assigned to only one of the six factors.
† Excluding α-keto acids and >4C-sugars and their phosphates except for glucose 6-, fructose 6-, ribose 5-, and ribulose 5-phosphates.
‡ Iron–sulfur cluster, iron, folate, coenzyme A, thioredoxin, thiamin diphosphate.
§ Other than carbonyl compounds.
¶ Two points for carbamoyl phosphate and acyl phosphates.
We then grouped enzymes into three risk classes—no risk (0 points), low risk (1 point), and combined medium risk (2 points) plus high risk (≥3 points)—and compared the cumulative distributions of their CCRs on a log scale (Fig. 4 B–D). Note that “no risk” is a convenient label that does not imply absolute absence of risk, and that medium and high risk were combined due to the small number (≤13) of high-risk enzymes in each organism. In all three organisms, the distributions of medium- plus high-risk and no-risk enzymes were significantly different (P < 0.005) by both Kolmogorov–Smirnov and Mann–Whitney U tests. So also were the distributions of medium- plus high-risk enzymes and the pooled no-risk plus low-risk enzymes (P < 0.01), confirming that the medium- plus high-risk enzymes remain robustly distinct even when compared to all other enzymes rather than to just the no-risk enzymes. This was also still nearly always the case when we performed a sensitivity analysis in which the risk factors (Table 1) were dropped out one-by-one (SI Appendix, Fig. S2); this outcome indicates that the various risk factors contribute similarly to CCR. The median CCR for the medium- plus high-risk class was always roughly one to two orders of magnitude below that of the no-risk class, with the median CCR of the low-risk class in an intermediate position in L. lactis and yeast (Fig. 4 B and C) and slightly above the no-risk class median in Arabidopsis (Fig. 4D). The log-transformed means for no-risk and medium- plus high-risk classes likewise always differed by one to two orders of magnitude (P < 0.001) and nearly all enzymes with CCRs <1,000 were from the medium- plus high-risk class. Of note, the CCR variances of the risk classes in L. lactis and yeast were similar to each other and to the pooled no-risk plus low-risk class variance in Arabidopsis, but the Arabidopsis medium- plus high-risk class variance was much greater (P < 0.0001; SI Appendix, Table S2). We discuss below what this difference may imply. Collectively, these observations for >400 enzymes show a robust, cross-kingdom correlation between degrees of hazardous reaction chemistry and a short working life span. We therefore explored the basis of this correlation.
High-Risk Enzymes Carry Lower Metabolic Fluxes and Are More Abundant.
Because CCR depends on three variables—metabolite flux rate and enzyme abundance (whose ratio is kapp), and enzyme turnover rate Kd—we examined how risk class impacts each variable. To simplify the analysis and increase statistical power, the medium- plus high-risk class was compared with pooled data from the no-risk plus low-risk classes. For all three organisms, the kapp distribution for the medium- plus high-risk class differed significantly from the pooled no-risk plus low-risk class, having a median value about 10-fold lower (Fig. 5 A–C). In all cases, the difference was due to the medium- plus high-risk class having both lower metabolic fluxes and higher protein abundances. In contrast, the Kd value distributions for the two classes did not differ significantly (Fig. 5 A–C). The differences in CCR between these grouped classes are thus determined predominantly by the numerator (kapp) in the CCR term and not by the denominator (Kd). One outcome of this analysis was to confirm that our simple scoring system for chemical risk (Table 1) corresponds to in vivo enzyme characteristics, i.e., to biological reality. Other implications are discussed below.
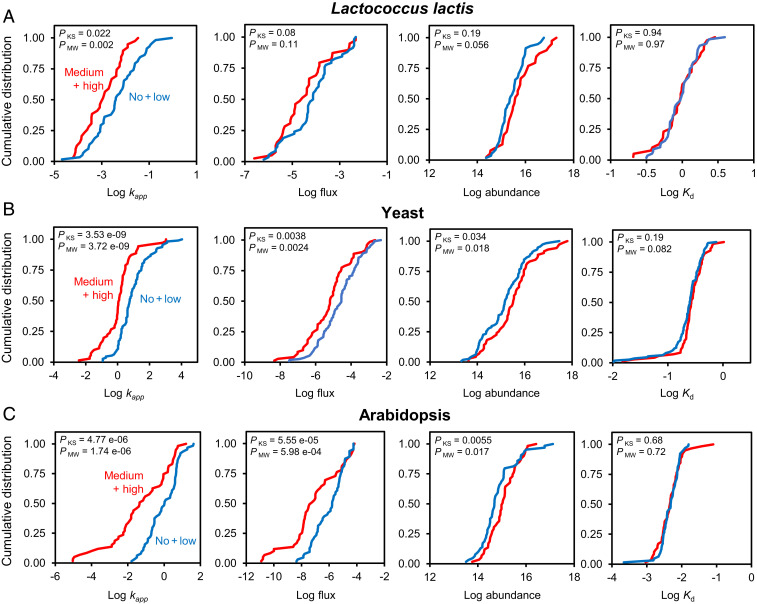
Relationships between enzyme risk class and each of the variables on which CCR values depend. Cumulative distributions (log scale) are plotted for L. lactis (A), yeast (B), and Arabidopsis (C) enzymes assigned to the medium- plus high-risk class (red lines) or to the pooled no-risk plus low-risk class (blue lines). The kapp units are per second. Flux units are millimoles per second per gram dry weight, enzyme abundances are molecules per gram dry weight, and Kd values are per hour. P values for Kolmogorov–Smirnov (KS) and Mann–Whitney U (MW) tests for significant differences between the distributions are shown in each frame.
Discussion
Self-Inflicted Damage as a Major Mode of Enzyme Failure In Vivo.
Our analysis provides correlative evidence that 40 to 50% of central metabolic enzymes—those we class as medium and high risk—may undergo use-dependent failure due to collateral chemical damage by substrates, products, cofactors, or the catalytic mechanism. Such self-inflicted damage is a “Cinderella” among the potential drivers of enzyme failure and turnover, more attention having gone to cumulative damage from age-related “protein fatigue” (9, 10, 48) and to the control of turnover by degron motifs (11, 50). We also show that, as a general rule, it is differences in kapp between medium- plus high-risk enzymes and no-risk plus low-risk enzymes that drive the differences in CCR observed in large enzyme sets, not differences in protein turnover rate Kd (Fig. 5 A–C). However, some of the highest-Kd enzymes that also have high risk and low CCR are notable exceptions; these include the phosphopentomutase DeoB in L. lactis, the carbamoyl phosphate synthase CPA1 (YOR303W) in yeast, and the thiamin synthesis enzymes THI4 and THIC in Arabidopsis (SI Appendix, Table S1 and Dataset S6). It is also notable that the median Kd value for the 13 high-risk enzymes (risk score ≥3) in Arabidopsis is modestly but significantly greater than the median for the other enzymes (SI Appendix, Fig. S3), but the small size of this class in Arabidopsis, as in L. lactis and yeast, precludes generalizations.
If self-inactivation is a neglected cause of enzyme failure and turnover in vivo, the concepts of catalysis-related inactivation and of inactivation-triggered enzyme turnover are nevertheless quite well established (14, 49), as is the principle that substrates can interact with—and hence damage—enzymes in the many futile encounters that end in dissociation rather than product formation (51). Indeed, our datasets include high-risk, low-CCR enzymes whose vulnerability to catalysis-related inactivation has previously been shown in other organisms. Three classical cases are as follows:
1)Deoxyribose-phosphate aldolase (DeoC). Escherichia coli DeoC is inactivated by a side reaction in which two molecules of its acetaldehyde substrate condense to form crotonaldehyde, which cross-links the catalytically active lysine (K167) to a cysteine (C47) nearby in the active site (52). Both of these residues are conserved in L. lactis DeoC, which is therefore likely to undergo the same inactivation reaction (Fig. 6A). Ready inactivation by this mechanism would fit with DeoC’s CCR value (4.6 × 10²) being the second lowest in L. lactis (Dataset S6).
2)Class I fructose bisphosphate aldolase (FBA). Mammalian FBA is inactivated by its enzyme-bound dihydroxyacetone phosphate intermediate that, in an oxidative side reaction, cross-links the catalytic lysine residue (K229) with another active-site lysine (K146) (53, 54). As both lysines are conserved in Arabidopsis FBA3 (Fig. 6B), the same inactivation reaction is possible and would be consistent with FBA3’s below-median CCR (3.1 × 10⁵) (Fig. 4A and Dataset S6)
3)Transaldolase (TAL). Candida utilis TAL undergoes an oxidative side reaction of a Schiff-base intermediate similar to that of FBA but less well characterized (55, 56); the reaction most probably cross-links the catalytic lysine residue to one of two active-site arginines. These residues are conserved in yeast TAL1 (Fig. 6C), indicating the likelihood of a similar reaction that could help account for TAL1’s CCR (3.5 × 10²) being the fifth lowest of 182 in yeast (Dataset S6).
![Damage mechanisms of high-risk, low-CCR enzymes vulnerable to catalysis-related inactivation. Images show the active-site region with the inactivating structure and alignments show the extent of sequence conservation in this region. Residues are numbered according to the top species in each alignment. Carbon skeletons of inactivating structures are colored red, and carbon skeletons of residues are colored as in the alignments below. (A) L. lactis DeoC homology model generated using E. coli DeoC crystallized in inactivated form with K167 and C47 linked via an acetaldehyde derivative (Protein Data Bank [PDB]: 5EL1). (B) Arabidopsis FBA3 homology model generated using rabbit muscle FBA (PDB: 1ZAI); the inactivating cross-linked dihydroxyacetone phosphate molecule was added manually using PyMOL. (C) Yeast TAL1 homology model generated using Francisella tularensis TalA with bound sedoheptulose-7-phosphate (PDB: 3TNO); black dashes mark substrate atoms within 3 Å of the active-site arginines. Homology models and images were generated using SWISS-MODEL and PyMOL 2.3.5. Residue conservation was determined by BLASTp against the National Center for Biotechnology Information nonredundant sequence database. Query and structural template sequences were aligned with orthologs using ClustalO. TAL R184 and R230 are strictly conserved. Species names: Streptococcus pneumoniae, Pediococcus acidilactici, Lactobacillus nodensis, Oryctolagus cuniculus, Oryza sativa, Macaca nemestrina, Cyphomyrmex costatus, and Candida utilis.](/dataresources/secured/content-1766004776900-f7fbcf4f-7e19-44ea-928b-b263ea63d753/assets/pnas.2023348118fig06.jpg)
Damage mechanisms of high-risk, low-CCR enzymes vulnerable to catalysis-related inactivation. Images show the active-site region with the inactivating structure and alignments show the extent of sequence conservation in this region. Residues are numbered according to the top species in each alignment. Carbon skeletons of inactivating structures are colored red, and carbon skeletons of residues are colored as in the alignments below. (A) L. lactis DeoC homology model generated using E. coli DeoC crystallized in inactivated form with K167 and C47 linked via an acetaldehyde derivative (Protein Data Bank [PDB]: 5EL1). (B) Arabidopsis FBA3 homology model generated using rabbit muscle FBA (PDB: 1ZAI); the inactivating cross-linked dihydroxyacetone phosphate molecule was added manually using PyMOL. (C) Yeast TAL1 homology model generated using Francisella tularensis TalA with bound sedoheptulose-7-phosphate (PDB: 3TNO); black dashes mark substrate atoms within 3 Å of the active-site arginines. Homology models and images were generated using SWISS-MODEL and PyMOL 2.3.5. Residue conservation was determined by BLASTp against the National Center for Biotechnology Information nonredundant sequence database. Query and structural template sequences were aligned with orthologs using ClustalO. TAL R184 and R230 are strictly conserved. Species names: Streptococcus pneumoniae, Pediococcus acidilactici, Lactobacillus nodensis, Oryctolagus cuniculus, Oryza sativa, Macaca nemestrina, Cyphomyrmex costatus, and Candida utilis.
These examples all involve a necessarily invariant catalytic residue plus a second active-site residue that is noncatalytic and may therefore be replaceable through engineering by residues that cannot undergo the inactivating reaction. Such replacement of damageable nonessential residues is predicted to harden the enzyme against self-inactivation, as discussed below. If it does in practice, engineering higher-risk, lower-CCR enzymes to raise CCR becomes a realistic strategy to extend their working lives in vivo and thus cut their turnover costs. Of course, as active sites can contain noncatalytic residues that are nonetheless critical to substrate positioning or stabilization and need to be retained, such engineering will require structural biology-based analysis to maximize success.
Engineering Damage-Hardened Enzymes.
Replacing damageable noncatalytic residues in or near active sites with less damageable ones can clearly extend enzymes’ working lives in vitro. For instance, mutating E. coli DeoC (case 1 above) to replace cysteine 47 with leucine or methionine greatly reduced inactivation by acetaldehyde without crippling catalytic activity (52, 57). Aligning 11,000 DeoC orthologs from GenBank shows that cysteine 47 is replaced in 1.5% of DeoC sequences by less reactive residues, usually methionine or valine (Dataset S7); another study, which used more relaxed orthology criteria, found cysteine 47 replacement in 9% of 3,700 sequences (52). DeoCs with different degrees of susceptibility to self-inflicted damage by this mechanism may thus also occur in nature. Similarly, for FBA (case 2 above), mutational replacement of lysine 146 with methionine protects against loss of activity by carbonyl attack but does not abolish catalytic activity (58). Besides such examples of hardening against damage by substrates or products, there are instances of hardening against damage by the catalytic mechanism itself. One example is extension of the in vitro operating life of a laccase by changing phenylalanine residues on the active-site rim to residues such as leucine, isoleucine, or alanine that are less prone to oxidation by the enzyme’s free-radical mechanism (59). Further examples of increasing in vitro operating lives of enzymes with a radical mechanism come from directed evolution of cytochrome P450s (21, 60).
If rational design and directed evolution can reduce self-inactivation of high-risk enzymes in vitro, they can likely do the same for high-risk enzymes in vivo, i.e., increase CCR. This inference rests on the assumption that CCR values are not already optimized, which is reasonable since other enzyme characteristics such as kinetic properties and specificity are not optimized either (44, 606162–63). An engineering strategy to damage-harden enzymes in vivo and cut turnover costs could therefore be as follows: From a host of interest, pick a low-CCR target that is high risk and abundant (abundant enzymes offer the largest potential savings on turnover costs) → Express in E. coli, yeast, or other platform → Design and screen, or evolve and select, versions that last longer in operation → Introduce the mutations responsible into the native host genome, e.g., by gene editing. Screening for higher CCR in vitro under physiological conditions is laborious but straightforward (21). Selecting for higher CCR in platform cells is more challenging. It depends on coupling cell growth to the activity of the target enzyme and, in most cases, on being able to sharply shut off target expression, thereby locking subsequent growth to the number of catalytic cycles that the target mediates before inactivation. We are seeking proof-of-concept by evolving the suicide enzyme THI4 (CCR = 1) for higher CCR and function in mild conditions (64, 65).
Implications of Self-Inflicted Damage for Metabolic Design.
Beyond demonstrating that an enzyme’s CCR value is a useful in vivo performance criterion and that simple scores of chemical risk help account for low CCRs, our analysis raises four questions about the relationship between enzyme turnover and metabolism that are relevant to engineering design.
Do high-risk enzymes actually get replaced at a faster rate in vivo?
Self-inflicted damage at a higher rate coupled to programmed enzyme degradation to maintain function could, in its simplest expression, lead to high-risk enzymes having higher Kd values. While clearly there are such examples (e.g., DeoB, CPA1, THI4, and THIC) (see above), our enzyme risk class datasets do not support this notion as a primary driver for large enzyme sets (Fig. 5 A–C). Rather it is the two terms that make up kapp (flux and protein abundance) that are varied, allowing higher-risk enzymes to be replaced on a similar time-based schedule to lower-risk enzymes. This hedges against a requirement for specific in vivo recognition of damaged or damageable enzymes and toward the slower rate of operation of higher-risk enzymes to ensure that a portion of each enzyme pool remains functional.
Do high-risk enzymes fail stochastically?
Direct demonstration that enzyme failure is random or stochastic rather than time dependent (Fig. 1B) requires data on enzyme age at time of failure, which are difficult to acquire. As no proteome-wide turnover study has yet acquired such data, direct proof of random failure must await advances in activity-based proteomics (66). Logic and indirect evidence both favor random failure, however. First, inactivation during catalysis necessarily leads to a random failure pattern (14). Second, the exceptionally high variance of the CCR values of Arabidopsis higher-risk enzymes (Fig. 4D and SI Appendix, Table S2) may fit with flux-dependent random failure. Metabolic fluxes and kapp values (i.e., reactions per second per enzyme molecule) remain constant over time in L. lactis and yeast but vary greatly between day and night in Arabidopsis (26). This partial decoupling of kapp from time in Arabidopsis could selectively inflate the CCR variance of high-risk enzymes.
Are high-risk enzymes replaced by reactive or scheduled maintenance?
If high-risk enzymes self-inactivate during operation, in engineering terms cells are opting for a run-to-failure strategy. The next step in this strategy is to either a) identify and replace the failed part (reactive maintenance) or b) indiscriminately remove the failed part along with still-functioning parts according to a timetable (scheduled maintenance). In biochemical terms, alternative a implies that the protein degradation system recognizes and specifically culls failed enzyme molecules so that they never accumulate. Alternative b implies that an enzyme’s degradation rate is set to statistically match its failure rate, in which case failed enzyme molecules build up to a steady-state level. Both alternatives—inactivation-triggered or programmed enzyme degradation—are biologically reasonable and could work together (8, 11, 14). Our analysis and related findings provide some support for alternative b. First, the significantly higher median protein abundances of the medium- plus high-risk enzymes in all three organisms (Fig. 5 A–C) is consistent with the inflation of higher-risk enzyme pools by failed molecules awaiting breakdown. Second, the overall lack of major differences between enzyme risk classes in terms of Kd implies the steady-state level of failed enzymes would be more abundant for low CCR enzymes. Backing this interpretation, the suicide enzyme THI4 (CCR = 1) isolated from both yeast and Arabidopsis is mainly found in the failed state in vivo (17, 67). Note that if b is generally the case, synthesis rates of damage-hardened enzymes might need to be tuned to take advantage of increased enzyme longevity.
Could the characteristics of high-risk enzymes lead to metabolic tailspins?
If a high-risk enzyme’s life span depends on the number of catalytic cycles performed and a low-risk enzyme’s life span does not (being set by time alone), these enzymes will respond differently when substrate concentration rises. Assuming that high- and low-risk enzymes normally operate below maximum capacity (i.e., kapp < kcat; Fig. 3 A and B), then both will respond to an increase in substrate concentration by increasing reaction velocity, i.e., by increasing kapp, the number of catalytic cycles per second. This will increase the inactivation rate of the high-risk enzyme but not the low-risk one. Therefore, unless the synthesis rate of the high-risk enzyme is stepped up to offset its increased inactivation rate, the amount of active enzyme left to process the substrate will decrease, leading to a tailspin situation of ever-faster catalysis and ever-faster inactivation of the remaining enzyme molecules in the pool. While this tailspin is only a thought experiment, it uncovers a fragility to varying metabolic states that higher-risk enzymes may impose and lower-risk ones may not. A resilience design strategy could be to run higher-risk enzymes further from saturation (i.e., with kapp further below kcat) than lower-risk enzymes, to “buy time” before inactivation goes too far and the whole enzyme pool becomes inactive. Our kapp/kcat data suggest that L. lactis, yeast, and Arabidopsis might use such a strategy (SI Appendix, Fig. S4), but datasets with more experimental values and greater statistical power are needed to confirm or discount this.
Materials and Methods
Protein Turnover Rates and Abundances.
Saccharomyces cerevisiae protein abundances and turnover rates from ref. 23 were converted to a dry weight basis by assuming there are 6.67 × 10¹⁰ cells per gram dry weight (Dataset S2). Arabidopsis leaf protein turnover rates were taken from ref. 35; protein abundances in parts per million units were taken from PaxDb (36) and were converted to a weight basis by assuming that protein content is 15 mg⋅g−1 fresh weight and that dry weight is 12% of fresh weight (31) (Dataset S3). The analysis was limited to soluble enzymes due to the difficulty of quantifying membrane proteins (68), and to enzymes that act on small molecules.
Metabolite Flux Estimates.
Flux balance analysis models for L. lactis and yeast used the media and growth conditions given in the protein turnover studies (22, 23); for L. lactis, the faster of the two reported growth rates (0.5 h−1) was selected. The L. lactis model was generated using the ModelSEED reconstruction algorithm in KBase (37). We did not use the published L. lactis model (69) as it was less accurate than the freshly reconstructed model in replicating the experimentally observed phenotypes that are important for this study (lactate production in the specified growth conditions at the specified growth rate). All reconstruction and gapfilling steps performed, all media formulations, FBA solutions, and the model itself are available for view and download in a KBase narrative (https://narrative.kbase.us/narrative/51582). The yeast model was the iMM904 model (70). As with the L. lactis analysis, the yeast model, media formulations, and flux analysis solutions are available for download and view in a KBase narrative (https://narrative.kbase.us/narrative/51584). The protein turnovers for both yeast and L. lactis were measured in rich growth conditions, which created a challenge when simulating growth in these conditions due to uncertainty over which nutrients are actively utilized by these organisms (which was not measured in the original experiments). We applied the proteomics data with the models to overcome this challenge. First, model growth rates were fixed at experimentally measured values while the net uptake of all nutrients was minimized, producing a flux solution that maximized the efficient use of nutrient sources at a set growth rate. To determine which nutrients in the media were actively consumed, we removed each compound from the media one at a time, comparing the binary reaction activity (active if carrying flux and inactive if carrying no flux) predicted by the model with the experimentally measured protein profiles at each step. This was a qualitative rather than quantitative comparison. That is, we counted how often reactions associated exclusively with proteins that were not observed in our available proteomics data were forced to carry flux in each flux solution. If removal of a compound from the media resulted in an increase in these reactions that was inconsistent with available proteomics data, we retained the compound in the media. Otherwise, we removed the compound from the media. In this way, we produced flux distributions that maximized consistency with all available proteomic data and reported growth rates.
While we attempted to similarly apply genome-scale metabolic models of Arabidopsis to predict our fluxes, these models were unsuitable for producing the accurate central carbon flux estimates that our study required. In many cases, key genes in these pathways were missing from the models, and in other cases, the models were too underdetermined (e.g., due to organellar compartmentation) to produce reasonable flux estimates (flux in the model would proceed through too many alternative and/or physiologically unreasonable routes). For this reason, flux through Arabidopsis pathways was estimated using a simplified stoichiometric representation of plant metabolism based on the method of Penning de Vries et al. (71), KEGG pathway stoichiometry (39), biomass composition, and a growth rate of 0.1 d−1. We also assumed that there is no catabolism of biosynthetic end products such as amino acids and nucleobases (Dataset S3). When more than one enzyme was predicted to mediate the same reaction, flux was partitioned in proportion to enzyme abundance, including minor isoforms that were not present in the protein turnover datasets.
Although kinetic modeling can give more accurate flux predictions than the standard FBA we applied, kinetic models require significant parameterization that is not available for all the species in our study. We focused mainly on central carbon pathways, for which FBA produces an acceptable approximation of flux. We only computed net flux through reversible reactions; our estimates are thus a lower bound.
kcat Values.
When extracting kcat values from the BRENDA database (43) or original publications, we used values for L. lactis, yeast, and Arabidopsis when coherent ones were available, and otherwise used values for the closest possible relatives (Dataset S5). All the kcat values applied to yeast came from S. cerevisiae or other ascomycetes and all those applied to Arabidopsis came from Arabidopsis thaliana or other higher plants. The kcat values applied to L. lactis came mainly from other bacteria including some not from the same phylum as L. lactis (Firmicutes).
Assigning Risk Scores to Enzymes.
Reactive substrates, products, and cofactors, and intermediates participating in each enzyme reaction, and hazardous reaction mechanisms, were identified using the KEGG database (39) and original literature. The literature sources used are annotated in Dataset S6.
Acknowledgements
This work was supported by NSF Award IOS-1444202 (to A.D.H., D.R.M., and C.S.H.), by Australian Research Council Awards CE140100008 and DP180104136 (to A.H.M.), and by an endowment from the C. V. Griffin Sr. Foundation.
Data Availability
All study data are included in the article and/or supporting information.
References
1
2
3
4
5
6
7
8
9
10
11
12
13
14
15
16
17
18
19
20
21
22
23
24
25
26
27
28
29
30
31
32
33
34
35
36
37
38
39
40
41
42
43
44
45
46
47
48
49
50
51
52
53
54
55
56
57
58
59
60
61
62
63
64
65
66
67
68
69
70