 Functional connectome fingerprinting using shallow feedforward neural networks
Proceedings of the National Academy of Sciences of the United States of America


Edited by Huda Akil, University of Michigan–Ann Arbor, Ann Arbor, MI, and approved March 10, 2021 (received for review October 20, 2020)
Author contributions: G.S., B.R., and T.L. designed research; G.S. and T.L. performed research; G.S. and T.L. contributed new reagents/analytic tools; G.S. and T.L. analyzed data; and G.S. and T.L. wrote the paper.

- Altmetric
Although individual subjects can be identified with high accuracy using correlation matrices computed from resting-state functional MRI (rsfMRI) data, the performance significantly degrades as the scan duration is decreased. Recurrent neural networks can achieve high accuracy with short-duration (72 s) data segments but are designed to use temporal features not present in the correlation matrices. Here we show that shallow feedforward neural networks that rely solely on the information in rsfMRI correlation matrices can achieve state-of-the-art identification accuracies (≥99.5%
Functional connectome fingerprinting based on the similarity of correlation coefficient matrices computed from resting-state functional MRI (rsfMRI) data can identify individuals with high accuracy () using long-duration ( min) scans, but considerably lower accuracy (68%) is obtained when the data duration is decreased to 72 s (1). Recurrent neural networks (RNN) can achieve high accuracy (98.5%) with short duration (72 s) data, presumably reflecting their ability to capture both spatial and temporal features (2, 3). However, it has been shown that high RNN performance can be achieved even when the temporal order of the fMRI data is permuted (4), suggesting that the temporal features are not critical for identification. Here we introduce two shallow feedforward neural networks that can achieve high identification accuracy without the need for recurrent connections. Furthermore, we use these networks to estimate the minimum size of the data needed to robustly identify subjects with high mean accuracy () from short segments of rsfMRI data. Since identification accuracy reflects the ability to effectively extract information from functional connectomes, additional insight into the methods and minimum data sizes that achieve high performance can guide the development of extended approaches to detect other differences in functional connectivity, such as disease-related changes.
The two networks considered are shown in Fig. 1 A and B. The input to the correlation neural network (corrNN) consists of the upper triangular elements of the correlation coefficient matrix estimated from a data matrix consisting of z-normalized time series (of length ) from regions of interest (ROIs). For identification of subjects, the network structure consists of a fully connected classification layer with units, a batch normalization layer, and a softmax layer. The norm-based neural network (normNN) uses the z-normalized data as the input. The first stage is a fully connected layer that projects the data onto hidden units using the weight matrix to form the intermediate matrix . In the second stage, the norm across the time dimension (i.e., across each column of ) is computed for each hidden unit to form a summary measure of similarity over the collection of time points. The resulting vector comprises features extracted from the correlation matrix . The th feature is proportional to the variance in the direction of the th column vector of . If these vectors are randomly oriented and constrained to be unit norm, then the features represent a random sampling of the “peanut”-shaped surface of directional variances (5). The subsequent stages in the network are a batch normalization layer, a fully connected classification layer with hidden units, a second batch normalization layer, and a softmax layer.

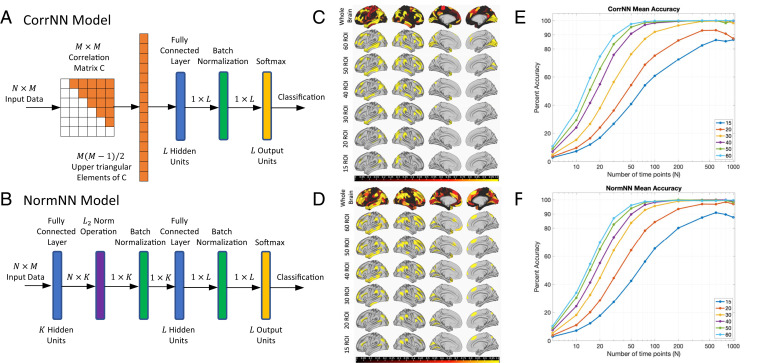
(A and B) CorrNN and NormNN model structures. (C and D) Top rows are maps showing the relative importance of the ROIs for identification accuracy, with maximum importance of 1.0 indicated in yellow. The remaining rows are thresholded to show the locations of the top 15 to 60 ROIs. (E and F) Mean identification accuracies as a function of the number of time points and ROIs.
Results
We assessed the performance of the two networks using data from the Human Connectome Project (HCP) (6). Two rsfMRI scans acquired on day 1 were used for training, while the two scans from day 2 were used for validation and testing.
For ROIs, time points (72-s duration) per segment, and hidden units, the mean classification accuracies of the corrNN and normNN models were 99.8% and 99.6%, respectively, for an initial set of 100 subjects, and 100.0% and 99.7% for a second independent set of 100 subjects. These accuracies are higher than those reported (94.3 to 98.5%) for RNN models (2, 3). For comparison, the mean classification accuracy using the similarity of the correlation coefficients was 79.4% for 100 time points per segment, which is higher than the mean accuracy reported in ref. 1 using data from a different dataset.
We used a greedy search algorithm to assess the relative importance of the ROIs with respect to model accuracy. Importance maps are shown in the top rows of Fig. 1 C and D for corrNN and normNN, respectively, with the subsequent rows thresholded to highlight the top 15 to 60 ROIs. When considering the top 60 ROIs, the highest numbers of ROIs are found in region 22 (dorsolateral prefrontal cortex) followed by regions 17 (inferior parietal cortex), 14 (lateral temporal cortex), 16 (superior parietal cortex; for CorrNN), 21 (inferior frontal cortex), and 3 (dorsal stream visual cortex), where brain regions are as defined in ref. 7.
We used the top ROIs to evaluate CorrNN and NormNN performance with 15 to 60 ROIs and 5 to 1,000 time points, as shown in Fig. 1 E and F, respectively. As the number of ROIs decreases, the number of time points needed to achieve higher accuracy increases. Defining as the threshold for high mean accuracy, we observed that this threshold is surpassed with as few as ROIs and time points for CorrNN and 40 ROIs and 200 time points for NormNN, corresponding to or 8,000 total data points, respectively.
To further explore the dependence on the number of ROIs and time points, we considered combinations where the total number of data points was constrained to be equal to or close to either 6,000 or (see Fig. 2 legend). For CorrNN, high mean accuracies are obtained for two of the combinations (dark red squares) with 6,000 data points and for all five of the combinations (dark red diamonds) with points.
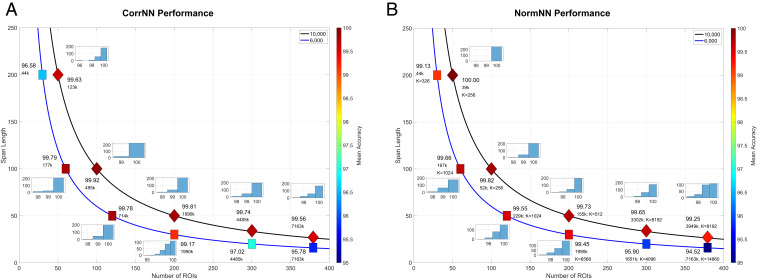
(A) CorrNN and (B) NormNN identification accuracies for combinations of numbers of ROIs () and span lengths () that are constrained to have either 6,000 (blue curves) or (black curves) data points, with the exception of the combinations , , and , which have 6,064, , and data points, respectively. Mean accuracies are indicated by labels and color scale. The numbers of model parameters (in thousands) for CorrNN and NormNN are also listed (with ), as are the numbers of hidden units () for NormNN combinations. For combinations where CorrNN mean accuracy is greater than 99%, autoscaled histograms show the distribution of identification accuracies obtained over 250 test trials per combination.
For NormNN, the number of parameters exhibits a linear dependence on the number of ROIs () as compared to the quadratic dependence for CorrNN (see Fig. 2 legend). To better compare the models, we increased by powers of 2 up to the value for which the numbers of NormNN and CorrNN parameters were equivalent, while also including as one of the possible options. In Fig. 2B, we show NormNN accuracies obtained for either 1) the minimum value of that surpassed the threshold or 2) the value that achieved the highest accuracy when the threshold was not met. High mean accuracies were obtained for two and four of the combinations with 6,000 and data points, respectively.
As shown by the histograms, the high mean CorrNN and NormNN accuracies correspond to robust identification performance, with the majority of the trials demonstrating 100% prediction accuracy. These accuracies were obtained with global signal regression (GSR), and were significantly greater than those obtained without GSR for both CorrNN () and NormNN () where denotes the mean difference in accuracy. Without GSR, only two of the CorrNN combinations and two of the NormNN combinations exhibited accuracies greater than .
Using the ROIs determined from the first 100 subjects, we evaluated performance on the second set of 100 subjects for the combinations denoted in Fig. 2. High mean CorrNN accuracies () were maintained for both of the previously identified high-performance combinations with 6,000 points and for four of the combinations with points, with the remaining combination exhibiting slightly lower accuracy for the second dataset. Thus, the same set of ROIs can offer comparable and high levels of performance across independent datasets.
For both sets of subjects, the mean number of CorrNN prediction errors was not significantly correlated (across subjects) with the mean framewise displacement (FD) measure of subject motion (). Correlations were higher but did not reach significance when using a filtered version of the FD measure (SI Appendix, Extended Methods), with values of and for the first and second subject groups, respectively. When viewed within the context of the high CorrNN accuracies that can be achieved, these results suggest that any effects of subject motion on performance are fairly weak.
For NormNN, we find that the first layer trained weights are randomly distributed so that the features after the norm operation represent an approximately uniform sampling of the directional variance surface of . Indeed, high performance can also be achieved by replacing the first layer with a set of random Gaussian weights. The generalizability of the features across datasets exhibits a dependence on the number of units . For example, when using first layer weights trained using the first set of subjects, performance for the combination with drops from for the first 100 subjects to for the second 100 subjects. Increasing to 1,024 units with weights trained using the first set yields accuracies of and for the first and second sets, respectively. Comparable accuracy levels ( and ) are obtained when using random weights for the first layer. Thus, generalizability of the NormNN features increases when there is a higher number of features to characterize the directional variance.
Discussion
We have shown that shallow feedforward models can identify subjects based solely on information in rsfMRI correlation matrices, robustly achieving high accuracies () with 6,000 to data points. For comparison, the convolutional RNN presented in ref. 3 achieved 98.5% accuracy with data points. In comparing the two feedforward models, NormNN can attain high accuracy with fewer model parameters, while CorrNN may serve as a better foundation for future work, as it uses correlation coefficient features that are more directly interpretable than the NormNN directional variance features.
Consistent with prior observations (1), high performance can be achieved when using a subset of the ROIs, including those located in frontoparietal and lateral temporal regions. The same set of ROIs can be used to achieve high performance across independent datasets, suggesting that the predictive value of intersubject variability in the functional boundaries and connectivity of these regions generalizes across datasets.
While combinations with span lengths as short as 27 points (19.5 s; CorrNN ) can offer high performance, they require a large number of model parameters. In contrast, combinations with fewer ROIs but increased span lengths (e.g., ) achieve high performance with one to two orders of magnitude fewer parameters. For NormNN, the number of trainable parameters can be further decreased through the use of random weights in the first layer.
As in prior studies (12–3), the current study utilized the HCP dataset, in which the data were acquired on two consecutive days (6). Although substantial variations in functional connectivity can occur on short time scales (i.e., minutes to hours) due to factors such as temporal fluctuations in vigilance (8), our results indicate that high performance can be obtained over a 1-d interval even in the presence of these factors. Future large-scale studies will be needed to assess whether high identification accuracy can be obtained over longer intervals (i.e., weeks to years).
The effectiveness of the feedforward networks for distinguishing individuals with relatively little data suggests that similar future approaches may have the potential to more fully utilize the information contained in rsfMRI data to better identify disease-related differences.
Materials and Methods
HCP preprocessing of the data included motion correction, detrending, denoising, and registration (7). The 379 ROIs were defined using 360 cortical ROIs from ref. 7 and 19 subcortical ROIs from ref. 6. Data were averaged within each ROI, and GSR was applied. Training, testing, and validation of the models were performed with Keras and TensorFlow. Further details are provided in SI Appendix, Extended Methods.
Acknowledgements
This work was supported, in part, by NIH Grant R21MH112155. We thank Eric Wong, Garrison Cottrell, Jiawei Ren, and Shili Wang for their assistance.
Data Availability
Analysis code, summary data, and anonymized fMRI data have been deposited at Bitbucket and Open Science Framework (9, 10).
References
1
2
3
4
5
8
9
10