 An mtDNA mutant mouse demonstrates that mitochondrial deficiency can result in autism endophenotypes
Proceedings of the National Academy of Sciences of the United States of America

 ,
Ana G. Cristancho,
Almedia J. McCoy,
Patrick M. Schaefer,
Meagan J. McManus,
Eric D. Marsh,
Douglas C. Wallace
,
Ana G. Cristancho,
Almedia J. McCoy,
Patrick M. Schaefer,
Meagan J. McManus,
Eric D. Marsh,
Douglas C. Wallace
Contributed by Douglas C. Wallace, December 4, 2020 (sent for review October 19, 2020; reviewed by Valerio Carelli, Richard Eugene Frye, and Eric M. Morrow)
Author contributions: T.Y., A.G.C., E.D.M., and D.C.W. conceptualized the project; T.Y., A.G.C., M.J.M., E.D.M., and D.C.W. designed research; T.Y., A.G.C., A.J.M., and P.M.S. performed research; T.Y., A.G.C., E.D.M., and D.C.W. contributed new reagents/analytic tools; T.Y., A.G.C., E.D.M., and D.C.W. analyzed data; and T.Y., A.G.C., E.D.M., and D.C.W. wrote the paper.
Reviewers: V.C., University of Bologna; R.E.F., Barrow Neurological Institute at Phoenix Children’s Hospital; and E.M.M., Brown University.
1T.Y. and A.G.C. contributed equally to this work.

- Altmetric
Autism spectrum disorders (ASDs) have increasingly been associated with mitochondrial dysfunction, corroborated by mitochondrial DNA (mtDNA) germline and somatic variants being found in ASD patients. If mitochondrial defects can generate ASD, then specific mtDNA mutations should induce ASD endophenotypes in mice. We tested this prediction by introduction of an mtDNA ND6 gene missense mutation (ND6P25L) into the mouse germline and found ASD endophenotypes. The ND6P25L mice exhibit impaired social interaction, compulsive behavior, and increased anxiety. They have reduced electroencephalographic delta and theta wave power, increased predilection to seizures, but without diminution of hippocampal interneurons. These endophenotypes correlate with impaired cortical and hippocampal mitochondrial respiration and increased reactive oxygen species production. Thus, mitochondrial defects can be sufficient to produce ASD phenotypes.
Autism spectrum disorders (ASDs) are characterized by a deficit in social communication, pathologic repetitive behaviors, restricted interests, and electroencephalogram (EEG) aberrations. While exhaustive analysis of nuclear DNA (nDNA) variation has revealed hundreds of copy number variants (CNVs) and loss-of-function (LOF) mutations, no unifying hypothesis as to the pathophysiology of ASD has yet emerged. Based on biochemical and physiological analyses, it has been hypothesized that ASD may be the result of a systemic mitochondrial deficiency with brain-specific manifestations. This proposal has been supported by recent mitochondrial DNA (mtDNA) analyses identifying both germline and somatic mtDNA variants in ASD. If mitochondrial defects do predispose to ASD, then mice with certain mtDNA mutations should present with autism endophenotypes. To test this prediction, we examined a mouse strain harboring an mtDNA ND6 gene missense mutation (P25L). This mouse manifests impaired social interactions, increased repetitive behaviors and anxiety, EEG alterations, and a decreased seizure threshold, in the absence of reduced hippocampal interneuron numbers. EEG aberrations were most pronounced in the cortex followed by the hippocampus. Aberrations in mitochondrial respiratory function and reactive oxygen species (ROS) levels were also most pronounced in the cortex followed by the hippocampus, but absent in the olfactory bulb. These data demonstrate that mild systemic mitochondrial defects can result in ASD without apparent neuroanatomical defects and that systemic mitochondrial mutations can cause tissue-specific brain defects accompanied by regional neurophysiological alterations.
Autism spectrum disorder (ASD) has a prevalence in the United States among 8-y-old children of 1 in 54 with the incidence in males being 1 in 34 and females 1 in 145, 4♂:1♀ (1). ASD is characterized by a deficit in social communication, repetitive behavior, and restricted interests, but patients can manifest an array of additional symptoms, including seizures, sleep disorders, intellectual disabilities, immunological deficiencies, and intestinal dysmotility. Children at high risk for autism have disruption of resting electroencephalogram (EEG) power at all frequencies, suggesting a dysregulation of cortical and hippocampal networks (2).
Numerous studies have reported physiological features in ASD patients consistent with mild mitochondrial defects. The metabolic alterations can involve serum and/or urine lactate, lactate/pyruvate ratio, alanine, ammonia, lipid, acyl-carnitine profiles, and folate and calcium metabolism (3456789101112–13).
Analysis of nuclear DNA (nDNA) genetic variation in ASD subjects has revealed large numbers of heterozygous copy number variants (CNVs) and loss-of-function (LOF) mutations, most of which account for only a few cases, though in aggregate may account for 20 to 40% risk. This indicates that ASD is polygenic in origin (1415–16). A subset of the CNV and LOF mutations impact known mitochondrial genes (7, 11, 12, 17, 18), consistent with the mitochondrial genome encompassing 1,000 to 2,000 nDNA genes plus hundreds of copies of the maternally inherited mitochondrial DNA (mtDNA) (19).
There are three clinically relevant classes of mtDNA variants: ancient polymorphisms that predispose to disease and are homoplasmic (pure mutant), somatic mutations that accumulate randomly within each individual and are heteroplasmic (mixture of mutant and normal), and maternally inherited germline mutations which may be either heteroplasmic of homoplasmic (19, 20).
Consistent with a mitochondrial etiology of ASD, a number of ancient mtDNA lineages (haplogroups) have been found to significantly contribute to ASD risk. These include European haplogroups I, J, K, O-X, T, and U which are associated with increased ASD odds ratios ranging from 1.76 to 2.18 (21). Haplogroups I, J, K, X, T, and U represent ∼55% of the European mtDNAs, so mtDNA haplogroup variation may make a substantial contribution to ASD risk.
Similarly, individual differences in ASD presentation have been correlated with differential accumulation of somatic mtDNA mutations. For mtDNA heteroplasmy data extracted from exome sequences of mother-proband-sibling trios, the incidence of heteroplasmic mutations at nonpolymorphic sites was 53% higher in autistic probands compared with siblings, and probands harbored 52% more nonsynonymous mutations and 118% more predicted pathogenic mutations than siblings. Thus, probands carrying nonsynonymous private heteroplasmic mutations have an increased ASD risk of 2.55 (22).
Maternally inherited mtDNA mutations have also been associated with ASD. This includes the common heteroplasmic tRNALeu(UUR) m.3243A > G mutation (23). At ∼10 to 30% m.3243G mutation, individuals can present with diabetes and ASD; at ∼50 to 80% m.3243G, individuals can manifest neuromuscular and cardiac disease (mitochondrial encephalopathy, lactic acidosis, and stroke-like episodes [MELAS] syndrome); and at ∼90 to 100% m.3243G, individuals can present as lethal pediatric disease. The phenotypic differences that correspond to the m.3243G heteroplasmy levels are associated with discrete transcriptional profiles (24), which in turn are associated with distinctive mitochondrial metabolite and NAD+/NADH redox states. These metabolites modulate histone modifications, which are associated with ∼150 discrete histone modifications (25). Such mitochondrial-nuclear interactions could account for the transcriptional changes associated with ASD (2627–28).
If mild mitochondrial dysfunction is important in the etiology of ASD, specific mitochondrial genetic defects should be sufficient in themselves to generate ASD phenotypes. To test this prediction, we created a mouse harboring an mtDNA mutation causing a partial complex I defect. We then tested the mouse for ASD endophenotypes, neuroanatomical changes, and mitochondrial physiological alterations.
Results
We introduced a homoplasmic missense mutation in the mtDNA complex I ND6 gene at m.13997G > A (P25L) (ND6P25L) into the mouse. This mouse has a partial complex I defect, increased mitochondrial reactive oxygen species (ROS) production, and subclinical optic nerve pathology (29). Since humans harboring the mtDNA ND6P25L mutation can manifest a range of neurological presentations (30), we tested the ND6P25L mouse for autistic endophenotypes.
We analyzed male ND6P25L mice since males have a higher predilection to ASD than females (1, 21, 31). Moreover, mild pathogenic mtDNA mutations that cause Leber hereditary optic neuropathy (LHON) also have a 4♂:1♀ bias in penetrance (19).
ND6P25L Mice Exhibit ASD Behavioral Endophenotypes.
We first tested the ND6P25L mice for impaired sociability employing a three-chamber social interaction assay. In this test, a set of 2-mo-old mice were monitored for time spent interacting with a novel mouse compared to the time spent interacting with a novel object (32). During the habituation phase without the presence of novel object or mouse, there were no significant differences in the time spent exploring the three chambers (social, center, and nonsocial chambers) between wild-type (WT) and ND6P25L mice (Fig. 1A). We then placed a novel mouse in the social chamber and a novel object (rock) into the nonsocial chamber and quantified the time the test mouse visited each chamber. The WT mice spent a significantly greater percentage of time in the social chamber (mean 51.72% ± 9.2) compared to the nonsocial chamber (mean 35.9% ± 6.36), while the ND6P25L mice did not differentiate between the social (mean 49.3% ± 10.4) and nonsocial (mean 43.2% ± 9.35) chambers (Fig. 1B).

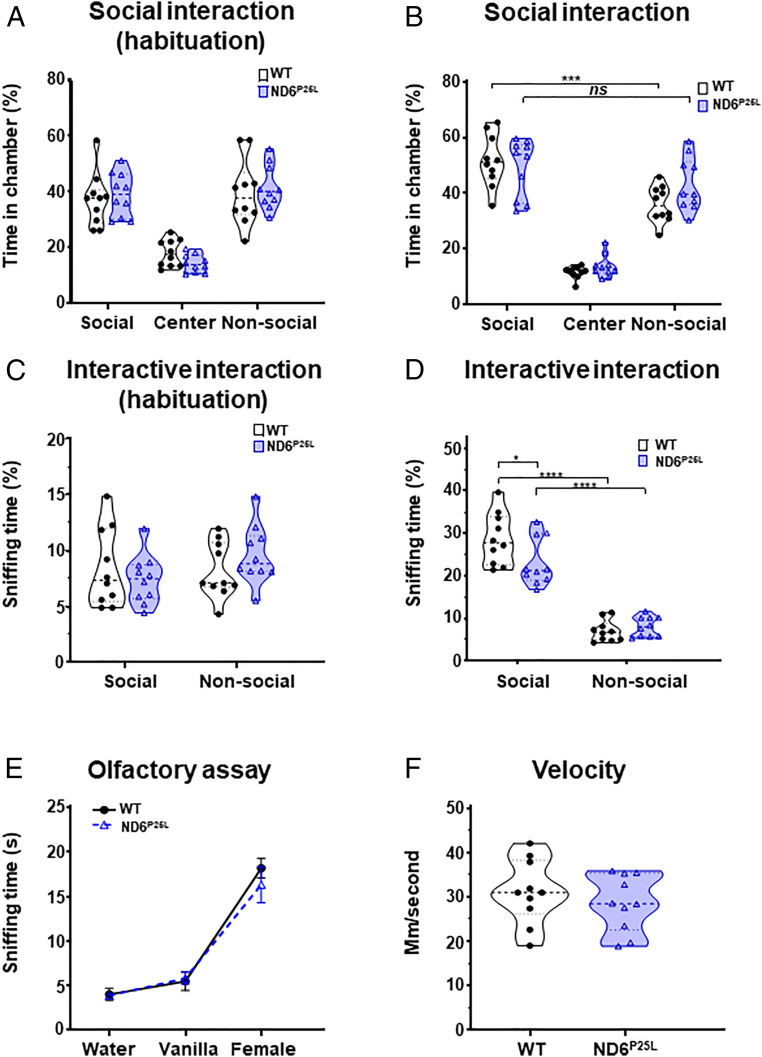
ND6P25L mice exhibit an impaired social interaction phenotype. Social deficit was assessed by three-chamber social interaction assay: (A) chamber occupancy time in chambers during habituation and (B) time in chambers while exploring novel mouse and object. Interaction with novel mouse and object was assessed by sniffing time: (C) sniffing in chambers during habituation and (D) sniffing time of novel mouse and novel object. Control studies: (E) demonstration of normal odor detection of ND6P25L mice and (F) demonstration of normal motor capacity of the ND6P25L mice. Each dot represents an individual mouse. Black (WT mice), purple (ND6P25L mice). *P < 0.05, ***P < 0.001, ****P < 0.0001; ns, no significance.
To further validate the loss of social interaction, we quantified the time the test mouse sniffed the novel mouse versus the novel object. Again, during the habituation phase there was no difference between the WT and ND6P25L mice which sniffed minimally in either the empty social or the nonsocial chamber (Fig. 1C). However, when the novel mouse and novel object were introduced, the WT mouse spent significantly more time sniffing the novel mouse than the ND6P25L mice (mean WT = 28.8% ± 5.9, ND6P25L = 23.1% ± 5.5, effect size by Cohen’s D = −0.431635872) (Fig. 1D). This difference was not due to impaired olfaction, since the WT and ND6P25L mice have the same response to different smells in the olfactory test (Fig. 1E). It was not due to reduced mobility, since there was no difference in total movement or speed between WT and ND6P25L mice in the social interaction assay (Fig. 1F). Hence, by this analysis, the ND6P25L mice exhibit impaired social interaction.
Compulsive Behaviors and Anxiety.
We next tested if the ND6P25L mice exhibit increased compulsive behavior and anxiety. Compulsive behavior was tested using the marble burying test. Sixteen glass marbles (1.4 cm in diameter) were placed in the cage spaced evenly in a 4 × 4 array on the surface of the bedding, 4 cm apart. The mouse was placed into the cage for 30 min and the number of marbles partially buried was quantified. The ND6P25L mice buried significantly more marbles then the WT mice (mean ND6P25L = 7.3 ± 1.28 versus WT = 3.6 ± 0.46). Hence the ND6P25L mice manifest markedly increased compulsive behavior (Fig. 2A).

ND6P25L mice exhibit a compulsive and anxiety phenotype. (A) Compulsive behavior was assessed by marble burying. (B–E) Excessive anxiety assessed by freezing behavior in open field assay: (B) time in the center, (C) freezing time (seconds, S), (D) number of freezing episodes, and (E) confirmation that ND6P25L mice had normal mobility within the test environment. (F and G) Elevated zero maze: (F) time spent in the open arm and (G) number of head entries to the open arms. (H) Confirmation of increased ND6P25L mouse anxiety using the fear conditioning test, showing significant increased percentage of freezing time during training and at 24-h environmental reexposure. Each dot represents an individual mouse. Black (WT mice), purple (ND6P25L mice). *P < 0.05, **P < 0.01. Mann–Whitney test used for A–G. For the freezing time the effect size was calculated by Cohen’s D = −0.768483338.
Anxiety was tested by the mouse’s response to an open field. The mice were placed in the center of a 53 × 53 cm plastic box with 22-cm high walls and central illumination and allowed to roam freely for a 15-min trial. The exploration was videotaped to quantify the proportion of time spent in the center of the field versus the periphery (33). There was no difference between the WT and ND6P25L mice in the time they spend in the center of the open field chamber (Fig. 2B), indicating a near normal desire to avoid exposure. However, the ND6P25L mice displayed markedly increased anxiety when exposed to this threatening environment, indicated by the time they spent freezing (Fig. 2C) and the number of times that they exhibited freezing behavior (Fig. 2D). The observed increased freezing phenotype was not due to the ND6P25L mice having a gross motor deficit, since there was no difference in average mobility speed of the WT and ND6P25L mice in the open field (Fig. 2E).
The increased anxiety phenotype of the ND6P25L mouse was confirmed with the elevated zero maze. The mice were placed in a circular device above ground where they could wander freely in an open arm or in a closed arm. Time spent in the open arm is an indication of decreased anxiety. Time in which the mouse’s head was in the open arm was quantified. The ND6P25L mice spent significantly less head time in the open arm of the elevated zero maze than controls, demonstrating increased anxiety (Fig. 2F), without any difference in the number of times the mutant and control mice approached the open arm (Fig. 2G). These results are consistent with a significant increase in anxiety in the ND6P25L mouse which can be seen in patients with mild ASD.
A similar result was observed when the WT and ND6P25L mice were subjected to the fear conditioning test. Initially, the mice were placed in the test box and exposed to a single 2-s, 1.25-mA, foot shock. Twenty-four hours after training, the mouse was returned to the test box for 5 min to determine if the mouse recalled the previous stress and responded by exhibiting a freezing behavior. Both the WT and ND6P25L mice remembered the earlier shock equally (Fig. 2H, training and 24 h). However, the ND6P25L mice responded more strongly by exhibiting significantly increased freezing behavior (Fig. 2H, 24 h and 14 d).
ND6P25L Mice Have Electrophysiological Alterations.
Individuals with ASD have abnormalities in resting state EEGs and can present with epilepsy, indicating a generalized neuronal network dysfunction (34, 35). To determine if ND6P25L mice manifest network dysfunction, we analyzed their network electrophysiology phenotype by recording EEGs and testing their predilection to pharmacologically induced seizures.
Mouse neuronal electrophysiological alterations were investigated by implanting eight silver electrodes through the skull into the cortex and hippocampus under anesthesia. The electrode responses were recorded from the hippocampus, bilateral parietal, bilateral motor, and bilateral visual cortex (Fig. 3 A and B). The EEG activity was monitored for 72 h for spontaneous seizure activity, epileptiform discharges, and resting background frequency. The ND6P25L mice exhibited differences in the resting background EEG frequency (delta, theta, alpha, beta, and gamma) power distribution throughout the 72 h, most prominently in the low-frequency bands (Fig. 3 A–F). Subanalysis of each band revealed significantly decreased delta wave power in ND6P25L mice in both the cortex (Fig. 3 C and D) and hippocampus (Fig. 3 E and F). ND6P25L mouse theta frequency power was decreased in the cortex (Fig. 3 C and D) but not the hippocampus (Fig. 3 E and F). Further ANOVA analysis confirmed that both the cortex and hippocampus had a generalized power reduction throughout the cortex (Fig. 3C) and hippocampus (Fig. 3E). This result corresponds to the observation that ASD children have alterations in delta and theta power analyzed by scalp EEG recordings of the cortex (35).

ND6P25L mice display altered background low-frequency EEG power levels. (A) Schematic of cortical and hippocampal lead placement (black dots), including ground (open circle “G”), references (black dot designated “ref”), and stabilizing point (open circle with “X”). (B) Representative EEG data from bilateral leads during periods of both awake and asleep for WT and ND6P25L mice. Voltage and time scale are indicated. (C–F) Power distribution of the EEG frequencies over 72 h. (C and D) Cortex EEG wave power levels: (C) global distribution of wave powers and (D) relative power levels of the five established frequency bands (delta, theta, alpha, beta, and gamma). (E and F) Hippocampal EEG wave power levels: (E) global distribution of power levels and (F) relative power level of the five established frequency bands. Each dot represents an individual mouse. Black (WT mice), purple (ND6P25L mice). *P < 0.05, **P < 0.01, ***P < 0.001. For the delta differences (D and F) the effect size was calculated by Cohen’s D: cortex = 0.857793918 and hippocampus = 1.380884881.
Children with ASD but without intellectual disability have a fourfold increased risk of epilepsy than the general population, which can be trigged by environmental stressors (36). Predilection to seizures is also seen in primary mitochondrial diseases (37). Since EEG recording did not reveal spontaneous seizure activity in the ND6P25L mice, we exposed the mice to a graded pharmacologic challenge, increasing exposure to flurothyl ether, a GABA-receptor antagonist. WT and ND6P25L mice were placed in a closed container and flurothyl ether was bled into the chamber at a constant rate (Fig. 4A). The ND6P25L mice began to seize at a lowered concentration of flurothyl ether than the WT mice (Fig. 4B). However, the grade of the flurothyl ether-induced seizures was not different between the two strains according to the modified Racine scale (Fig. 4C). Hence, the ND6P25L mice are more prone to induced seizures than the WT controls.

ND6P25L mice exhibit increased predilection to flurothyl-induced seizures. (A) Schematic diagram of the flurothyl seizure assay, (B) seizure threshold, and (C) modified Racine scale seizure severity. Each dot represents an individual mouse. Black (WT mice), purple (ND6P25L mice). *P < 0.05. For the seizure threshold the effect size was calculated by Cohen’s D = 0.781831061.
The combination of the EEG and flurothyl ether seizure induction experiments demonstrate that the ND6P25L mice have functional cortical and hippocampal network abnormalities frequently observed in ASD. The observed EEG alterations are consistent with those seen in ASD patients, suggesting that the mild ND6P25L mtDNA missense mutation is associated with neuronal network abnormalities analogous to those seen in ASD.
Hippocampal Neuronal Analysis.
One hypothesis as to the etiology of ASD is that it is a neurodevelopmental disorder resulting in a deficiency in the number of inhibitory GABAergic interneurons versus excitatory glutamatergic neurons (38, 39). The fast spiking, parvalbumin interneurons require substantial energy and their dysfunction has been associated with changes in hippocampal physiological properties in ASD-related disorders (38, 40, 41). Previously, we showed that a null mutation in the nDNA-coded mitochondrial adenine nucleotide translocator isoform 1 impaired the tangential migration of interneurons from the medial ganglionic eminence (MGE) into the cortex (42). However, when we used immunohistochemistry to compare the distribution of hippocampal interneurons in the milder ND6P25L mutant mice we found the number of parvalbumin (Fig. 5 A and B), somatostatin (Fig. 5 C and D), or neuropeptide Y (Fig. 5 E and F) interneurons in the hippocampal CA1, CA3, and dentate gyrus regions (Fig. 5) were not significantly different from WT. Therefore, the ND6P25L-mediated behavioral and electrophysiological defects are not the product of gross deficiency in the number or distribution of hippocampal interneurons.
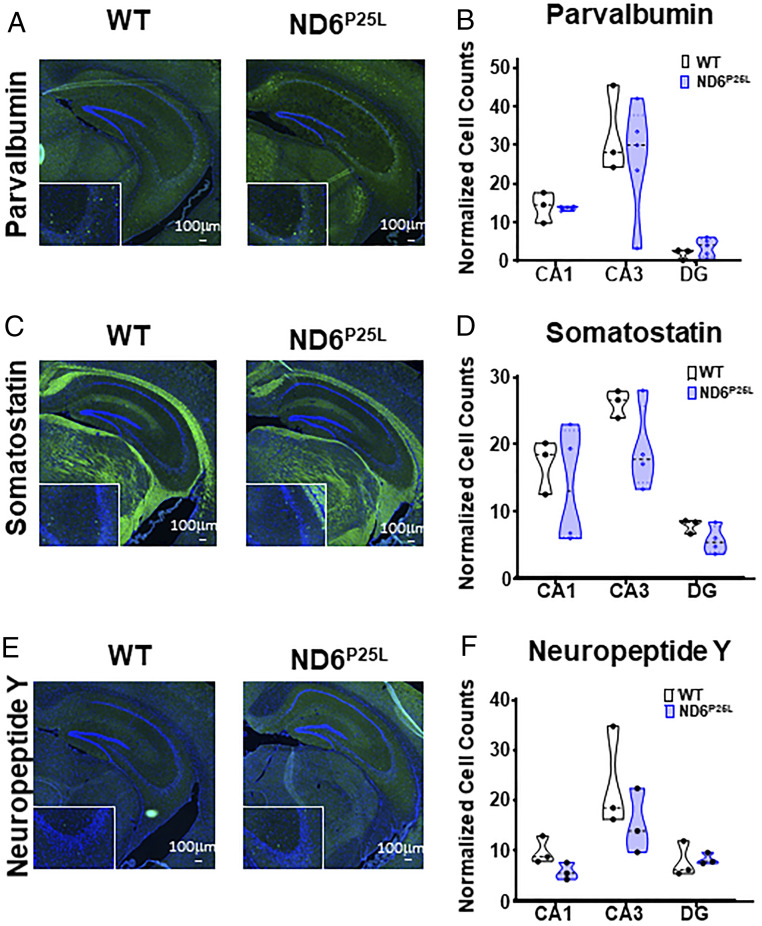
No significant difference in the number of hippocampal interneurons in ND6P25L and WT mice. (A) Immunohistochemistry of parvalbumin cells. (B) Quantification of parvalbumin cells. (C) Immunohistochemistry of somatostatin cells. (D) Quantification of somatostatin cells. (E) Immunohistochemistry of neuropeptide Y cells. (F) Quantification of neuropeptide Y cells. Images are shown at 10× magnification (Scale bar, 100 µm.) with 20× magnification Inset. Each dot is a different mouse.
ND6P25L Mice Have Decreased Respiration and Increased ROS.
A curious feature of mitochondrial disease is that a systemic mtDNA mutation can result in a highly tissue-specific phenotype. This is particularly marked for LHON where a homoplasmic mtDNA missense mutation manifests specifically as optic atrophy (43, 44). To determine if the systemic ND6P25L mtDNA mutation results in differential mitochondrial dysfunction in different regions of the brain, we analyzed the mitochondrial respiration and ROS production of the cortex, hippocampus, and olfactory bulb of the ND6P25L and WT mice using the Oroboros O2k Respirometer.
Strikingly, the most significant respiration defects were observed in the cortex which showed a global reduction in mitochondrial respiration in the ND6P25L mice relative to WT mice (Fig. 6 A and B). This included a significant decrease in the basal respiration (routine), complex I-linked respiration (substrates pyruvate, malate, and glutamate [PMG]), adenosine diphosphate (ADP)-stimulated respiration, and complex II-linked (Suc) respiration (Fig. 6 A and B).

Differential mitochondrial respiration of cortex, hippocampus, and olfactory bulb of ND6P25L versus WT mice. (A and B) Cortex. (C and D) Hippocampus. (E and F) Olfactory. (A, C, and E) Global mitochondrial respiration. (B, D, and F) Detailed respiration measurements. Routine, basal respiration; PMG, complex I-linked leak respiration (substrates pyruvate, malate, and glutamate); ADP, ADP stimulated; Suc, OXPHOS capacity with succinate; Olg, leak respiration with oligomycin; FCCP, uncoupled mitochondria; Rot, rotenone inhibition of complex I demonstrating complex II-linked respiration. Each dot represents an individual mouse. Black (WT mice), purple (ND6P25L mice). *P < 0.05, **P < 0.01; ns, no significance.
By contrast, in the hippocampus the only statistically significant difference was in the carbonyl cyanide-4-(trifluoromethoxy)phenylhydrazone (FCCP)-stimulated maximum respiration (Fig. 6 C and D). In the olfactory bulb there was no difference between the ND6P25L and WT mice (Fig. 6 E and F).
Previous studies showed that the partial complex I defect of the ND6P25L mouse increases mitochondrial ROS production (29). To determine if there was a regional difference in brain mitochondrial ROS production, we utilized the Oroboros O2k Amplex Red H2O2 assay to assess ROS production in the cortex, hippocampus, and olfactory bulb for each respiration state. Mitochondrial ROS production was increased in the cortex in association with complex I and complex II respiration with ADP as well as for FCCP-stimulated maximum respiration (Fig. 7 A and B). By contrast, mitochondrial ROS production was not significantly increased in any of the respiration states of the hippocampus (Fig. 7 C and D) or olfactory bulb (Fig. 7 E and F). Hence, the systemic ND6P25L mutation has a differential mitochondrial physiological impact on different regions of the brain. This differential in cortical and hippocampal mitochondrial function parallels alterations in the cortical and hippocampal EEG wave power levels. The cortex has the most extensive mitochondrial respiration and ROS defects (Figs. 6 and 7 A and B) and the greatest alterations in delta and theta power levels (Fig. 3 C and D). The hippocampus has fewer alterations in respiration and ROS production (Figs. 6 and 7 C and D) and only alterations in the delta wave power levels (Fig. 3 E and F).
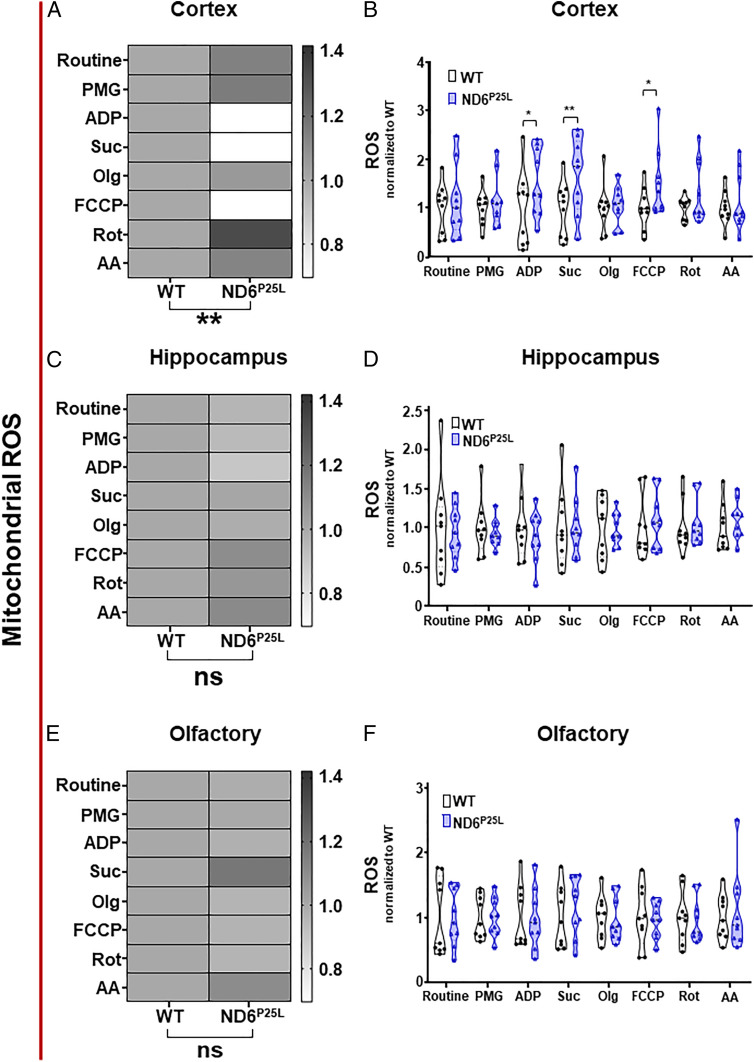
Differential mitochondrial reactive oxygen species generation in the cortex, hippocampus, and olfactory bulb of ND6P25L versus WT mice. (A and B) Cortex. (C and D) Hippocampus. (E and F) Olfactory. (A, C, and E) Global mitochondrial ROS. (B, D, and F) Detailed ROS measurements. Routine, basal respiration; PMG, complex I-linked leak respiration (substrates pyruvate, malate, and glutamate); ADP, ADP stimulated; Suc, OXPHOS capacity with succinate; Olg, leak respiration with oligomycin; FCCP, uncoupled mitochondria; Rot, rotenone inhibition of complex I inhibition demonstrating complex II-linked respiration; AA, antimycin A complex III inhibition demonstrating residual oxygen consumption. Each dot represents an individual mouse. Black (WT mice), purple (ND6P25L mice). *P < 0.05, **P < 0.01; ns, no significance.
Discussion
Analysis of our homoplasmic mtDNA ND6P25L mouse has produced three important insights into ASD. First, we demonstrated that a mild mitochondrial oxidative phosphorylation (OXPHOS) defect is sufficient in itself to manifest the behavioral endophenotypes, brain electrophysiological alterations, and predilection to seizures that are characteristic of ASD. Thus, in at least some ASD cases mitochondrial defects may be important contributors to ASD manifestations. Second, we showed that ASD endophenotypes can be manifest even in the absence of gross alterations in the hippocampal interneuron cell number. This, together with the metabolic origin of ASD endophenotypes in the ND6P25L mouse argues against ASD being exclusively a disorder of abnormal neuronal development. Finally, we show that an mtDNA mutation that is present at the same level in every brain tissue can have markedly different effects on the mitochondrial physiology of different regions of the brain, and these physiological differences correlate with differences in the tissues’ electrophysiological function.
A mitochondrial metabolic basis of ASD could have multiple implications. It is consistent with the numerous reports of mitochondrial OXPHOS defects and metabolic alterations in ASD patients (789101112–13). It could explain the highly heterogeneous genetic basis of ASD which encompasses numerous heterozygous CNVs and LOF mutations (1415–16), which could affect nuclear-coded mitochondrial functions, modulated by inherited and de novo mtDNA variation. Mitochondrial defects could also explain the observation that some of the same genes found associated with autism have also been linked to metabolic syndrome, congenital heart disease, intellectual disability, schizophrenia, and chromatic remodeling (18), since mitochondrial defects have been associated with similar manifestations (37).
Partial mitochondrial defects can manifest as a wide range of neuropsychiatric disorders (24, 25, 45), and both germline and somatic mtDNA mutation can alter ASD penetrance (21222324–25). The mitochondrion also directly regulates the epigenome through modulation of metabolic and high energy intermediates (24, 25) and ROS and ion levels (464748–49). Reciprocally, the nucleus regulates the mitochondrion via an array of transcription factors (50). Hence, partial mitochondrial defects caused by hemizygous mutations, modulated by background mtDNA variation (25) and environmental challenge (51, 52), could cause similar mitochondrial defects to that of the ND6P25L mouse.
Variation in mitochondrial function and ROS production predisposes mice to an enhanced neurophysiological response to stressors. Mild confinement stress of our various mitochondrial mutant mice results in profound differential effects on corticosterone and catecholamine production (53).
The gut microbiome composition has been correlated with autism (54, 55). We have shown that mitochondrial ROS, modulated by systemic mitochondrial gene variants, including the ND6P25L mice, directly regulates the composition of the gut microbiome (56). Therefore, the correlation between ASD and the gut microbiome may be the result of changes in mitochondrial function which modulate both.
The more severe syndromic ASDs can be associated with additional functional and/or morphological alterations. This is observed in fragile X syndrome (575859–60), Rett syndrome (61, 62), Angelman syndrome (6364–65), Phelan-McDermid syndrome (66, 67), and the 22q11 CNV (45). More severe mitochondrial defects, such as our nDNA heart-muscle-brain adenine nucleotide translocator isoform 1 gene null mutant mouse, presents with cardiomyopathy (68, 69) and has impaired interneuron migration (42), and thus approximates a syndromic autism.
Nonsyndromic and environmental stress-related autism can manifest in children without apparent anatomical alterations. These nonsyndromic cases may correspond to our mtDNA ND6P25L mutant mouse which does not manifest apparent anatomical alterations. If so, the ND6P25L mouse permits us to extrapolate back to a fundamental cause of ASD, a partial mitochondrial defect associated with increased mitochondrial ROS that perturbs the function of the highly energetic interneurons.
While it is not clear why there should be a difference in the mitochondrial energetic dysfunction of the cortex, hippocampus, and olfactory bulb in a mouse that is homoplasmic for a systemic ND6P25L mtDNA mutation, this is consistent with other mitochondrial diseases such as LHON. LHON specifically affects the retinal ganglion cells and optic nerve, yet it is caused by systemic, mild, homoplasmic, mtDNA, missense mutations, commonly affecting complex I genes. The differential tissue sensitivity of LHON has been attributed to the high energy demand of the unmyelinated optic nerve fibers that cross over the inner retina on their way to the optic nerve (44).
Even more puzzling is the 4:1 male bias in ASD and LHON, both of which can be associated with partial mitochondrial complex I defects. For LHON, the male bias has been attributed to the protective role of estrogen in reducing mitochondrial ROS production in premenopausal women. Approximately 20% of estrogen receptor β is found in the mitochondrial matrix, which when activated by estradiol doubles the specific activity of the mitochondrial matrix antioxidant enzyme Mn superoxide dismutase within 60 min (70). The protective role of activated estrogen receptor β has been confirmed by demonstration that the complex I defect of cultured LHON cells can be normalized by treatment with estrogen receptor β-specific phytoestrogen agonists (71). In a mouse CNV model of ASD (deletion of 7qF3 which is the equivalent of the human 16p11.2 deletion) male biased behavioral defects are manifest. The 7qF3/16p11.2 deletion removes one copy of the ERK1 gene, and male 7qF3 mice, but not 7qF3 females, have been found to have increased phosphorylation of ERK1 (phospho-ERK1) in the striatum (31). ERK1 is redox sensitive and located with the brain mitochondria, and mild treatment of brain mitochondria with H2O2 increases the phospho-ERK1 to ERK1 ratio (72). Increased phospho-ERK1 has been found to modulate apoptosis (activate NOXA) and mitochondrial fission (phosphorylated DRP1) (73). Hence, elevated male mitochondrial ROS acting upstream of ERK1 signaling could account for the male bias in ASD and LHON.
LHON patients with a homoplasmic mtDNA mutation can manifest optic atrophy while others with the same homoplasmic mtDNA mutation do not. This has been proposed to be due to differences in individual capacity to compensate for mtDNA biochemical defects by up-regulation of mitochondrial biogenesis (74). This aspect of LHON bears resemblance to the differential mitochondrial respiration of ASD lymphoblastoid cell lines, one group of which has increased respiration (AD-A) and another has normal respiration (AD-N), but with all cell lines being sensitive to chronic oxidative stress (75)
Given that mild mitochondrial defects can account for the genetic complexity, neuronal-specific manifestations, and response to environmental challenges of ASD, mitochondrial bioenergetic defects could provide a unifying hypothesis for the pathophysiology of at least a portion of ASD. This conclusion provides hope for treating ASD. If ASD were due to a defect during neuronal development that created an aberrant neuronal wiring diagram, this might be difficult to repair. However, if ASD is due to mild mitochondrial inhibition and associated increased mitochondrial ROS production that impairs the high-energy fast-spiking interneurons, then it is possible that metabolic therapies may provide viable therapeutic interventions for some ASD patients.
Methods
Mice.
The Institutional Animal Care and Use Committee from the Children’s Hospital of Philadelphia approved all animal protocols of this research. Two mouse strains were used for this study, the mtDNA ND6 m.3997G > A (ND6P25L) (29) and the WT control, both on the C57BL/6Eij (Nnt+/+) background. Previous ophthalmological studies on ND6P25L mice were performed on the Nnt−/− background (29). All experiments were performed on 2- to 3-mo-old males.
Behavioral Assays.
The mice were tested for social interactions in a three-chamber study, compulsive behavior by marble burying, and anxiety using the open field and elevated zero maze assays.
Social Interaction Testing.
Sociability was tested by exposure of the mice to a novel mouse within one wire mesh enclosure and a rock in another wire mesh enclosure housed in different chambers of a three-chamber social approach test. The test mouse was monitored for time spent visiting and interacting (sniffing) the novel mouse versus the novel object, using an overhead camera and Ethovision 9 tracking software. As controls, we tested for olfactory deficits and motor impairment. A social preference score was calculated for each test mouse by dividing the time spent sniffing the social test chamber by the total time spent sniffing both the social and nonsocial test compartments.
Repetitive Behavior.
Compulsive repetitive behavior was assessed by the tendency to bury objects (76). The mouse was presented with 20 glass marbles for 30 min, and the number of marbles buried by 2/3 was used to determine the extent of repetitive-compulsive behavior.
Anxiety.
Anxiety was tested by placing the mice in the center of an open field arena and allowing them to roam freely for 15 min (33). The time in the center versus border, the distance traveled, and freezing time were videorecorded and the data analyzed using ANY-Maze software. Anxiety was also tested by placing the mouse in a zero maze, which assesses approach/avoidance conflict, with “less anxious” mice being more willing to explore the brighter, open and elevated regions of the apparatus as opposed to remaining in the darkened and enclosed regions. The time that the mouse’s head entered and remained in the open arm was recorded by ANY-Maze (77).
Fear Conditioning.
Contextual fear conditioning was performed based on the remembered response to a prior mild shock (78). Learning and anxiety were assessed by comparing the percent freezing during the prestimulus epoch of the acquisition phase versus freezing during the recall phase.
Electroencephalogram.
Eight electrodes were implanted under isoflurane anesthesia, using stereotaxic placement for recording the hippocampal, bilateral parietal, bilateral motor, and bilateral visual electrical activity (33, 79). After a 24-h recovery the animals were transferred to the recording cage and recorded using a 32-channel extracellular amplifier and associated software (RHD2000 USB Interface Board, Intan Technologies). The data were analyzed with Matlab.
Flurothyl (Bis-2,2,2-Trifluoroethyl Ether) Seizure Threshold Testing.
The mice were placed on a platform in a 1.7-L sealed glass chamber containing a small amount of soda lime to scavenge CO2. Flurothyl was infused with a syringe pump at 6 mL/h until the first obvious generalized tonic clonic seizure was observed.
Immunohistochemistry.
Posterior hippocampal slices were stained for three populations of interneurons: parvalbumin (PV), neuropeptide Y (NPY), and somatostatin (SST) (33). The number of cell bodies were counted by three independent personnel in three hippocampal regions CA1, CA3, and DG, without prior knowledge of the sample genotype.
Mitochondrial Respiration and ROS Production.
The respiration and mROS production of cortex, hippocampus, and olfactory bulb homogenates were measured using high-resolution respirometry via the O2k (Oroboros Instruments) with simultaneous recording of mROS via Amplex Red fluorescence. The activity of each OXPHOS complex was determined using a substrate-uncoupler-inhibitor titration (SUIT) protocol.
Detailed methods are available in SI Appendix.
Acknowledgements
We thank Arrienne Butic, Wendy Tan, Katherine L. Mitchell, and Deborah Murdock from the D.C.W. laboratory and Elyse C. Gadra from the E.D.M. laboratory for technical assistance. We also acknowledge the Neurobehavior Testing Core at the University of Pennsylvania and Intellectual and Developmental Disabilities Research Center at Children’s Hopsital of Philadelphia (CHOP)/Penn U54 HD086984 for assistance with behavior procedures. This work was supported by NIH Grants MH108592, NS021328, and OD010944; US Department of Defense Grants W81XWH-16-1-0401 and PR202887; and an SP Accure Lab, Ltd. grant (awarded to D.C.W.). A.G.C. was supported by NIH 5K12HD043245, a CHOP K-readiness grant, and a CHOP Foerderer grant.
Data Availability.
All study data are included in the article and/or SI Appendix.
References
1
2
3
4
5
6
7
8
9
10
11
12
13
14
15
16
17
18
20
21
22
23
24
25
26
27
28
29
30
31
32
33
35
36
37
38
39
40
41
42
43
44
45
46
47
48
49
50
51
52
53
54
55
56
57
58
59
60
61
62
63
64
65
66
67
68
69
70
71
72
73
74
75
76
77
78