 Kidney intercalated cells and the transcription factor FOXi1 drive cystogenesis in tuberous sclerosis complex
Proceedings of the National Academy of Sciences of the United States of America

 ,
Kamyar Zahedi,
Marybeth Brooks,
Elizabeth P. Henske,
Yirong Yang,
Erik Zhang,
John J. Bissler,
Manoocher Soleimani
,
Kamyar Zahedi,
Marybeth Brooks,
Elizabeth P. Henske,
Yirong Yang,
Erik Zhang,
John J. Bissler,
Manoocher Soleimani
Edited by Martin R. Pollak, Beth Israel Deaconess Medical Center, Brookline, MA, and approved December 27, 2020 (received for review October 3, 2020)
Author contributions: M.S. designed research; S.B., K.Z., M.B., Y.Y., E.Z., and J.J.Y. performed research; S.B., K.Z., M.B., E.P.H., Y.Y., E.Z., J.J.B., J.J.Y., and M.S. analyzed data; M.B. maintained, generated, and genotyped mouse models; and M.S. wrote the paper with contributions from S.B., K.Z., E.P.H., and J.J.B.
1S.B. and K.Z. contributed equally to this work.

- Altmetric
Tuberous sclerosis complex (TSC) is caused by mutations in TSC1 or TSC2 gene and affects multiple organs, including the kidney, where it presents with angiomyolipomata and cysts that can result in kidney failure. The factors promoting cyst formation and tumor growth in TSC are incompletely understood. Current studies demonstrate that kidney cyst epithelia in TSC mouse models and in humans with TSC are composed of hyperproliferating intercalated cells, along with activation of H+-ATPase and carbonic anhydrase 2. Interfering with intercalated cell proliferation completely inhibited and inactivating carbonic anhydrase 2 significantly protected against cyst formation in TSC. Targeting the acid base and/or electrolyte transporters of intercalated cells may provide a therapeutic approach for the treatment of kidney cysts in TSC.
Tuberous sclerosis complex (TSC) is caused by mutations in either TSC1 or TSC2 genes and affects multiple organs, including kidney, lung, and brain. In the kidney, TSC presents with the enlargement of benign tumors (angiomyolipomata) and cysts, which eventually leads to kidney failure. The factors promoting cyst formation and tumor growth in TSC are incompletely understood. Here, we report that mice with principal cell-specific inactivation of Tsc1 develop numerous cortical cysts, which are overwhelmingly composed of hyperproliferating A-intercalated (A-IC) cells. RNA sequencing and confirmatory expression studies demonstrated robust expression of Forkhead Transcription Factor 1 (Foxi1) and its downstream targets, apical H+-ATPase and cytoplasmic carbonic anhydrase 2 (CAII), in cyst epithelia in Tsc1 knockout (KO) mice but not in Pkd1 mutant mice. In addition, the electrogenic 2Cl−/H+ exchanger (CLC-5) is significantly up-regulated and shows remarkable colocalization with H+-ATPase on the apical membrane of cyst epithelia in Tsc1 KO mice. Deletion of Foxi1, which is vital to intercalated cells viability and H+-ATPase expression, completely abrogated the cyst burden in Tsc1 KO mice, as indicated by MRI images and histological analysis in kidneys of Foxi1/Tsc1 double-knockout (dKO) mice. Deletion of CAII, which is critical to H+-ATPase activation, caused significant reduction in cyst burden and increased life expectancy in CAII/Tsc1 dKO mice vs. Tsc1 KO mice. We propose that intercalated cells and their acid/base/electrolyte transport machinery (H+-ATPase/CAII/CLC-5) are critical to cystogenesis, and their inhibition or inactivation is associated with significant protection against cyst generation and/or enlargement in TSC.
Tuberous sclerosis complex (TSC) is an autosomal dominant disorder caused by mutations in either the TSC1 or TSC2 gene, which encodes hamartin or tuberin, respectively (12345–6). TSC affects over 2 million people worldwide, ∼40% (800,000 people) of whom have renal involvements (12345–6). TSC renal disease is specifically characterized by the development and continuous enlargement of benign tumors (angiomyolipomata) and renal cysts, which eventually result in the decline of kidney function (23–4). Renal cell carcinoma (RCC) can also occur, with a younger age at onset compared with sporadic RCC and with distinctive histologic features (2). Although the initiating event in TSC is understood, the factors that promote the disease phenotype and progression remain unknown.
Mutations in TSC1 or TSC2 in TSC tumors activate mechanistic target of rapamycin (mTOR), a conserved serine/threonine protein kinase and a member of the phosphatidyl-inositol kinase-related kinase family (5, 78910–11). The mTORC1 complex is crucial to cell growth, survival, and regulation (121314–15). p70 ribosomal S6 kinase 1 and eukaryotic initiation factor 4E binding protein 1 provide the canonical substrates for mTORC1, while the activity of mammalian target of rapamycin complex 1 (mTORC1) is regulated by the upstream regulators, Ras-homolog enriched in brain and TSC (161718192021–22). Because of robust mTOR activation and its role in cell proliferation, mTOR inhibitors, such as sirolimus or everolimus, have been used in the treatment of TSC patients (5, 7). Unfortunately, kidney lesions can return to their baseline size when drugs are discontinued (23, 24), and a significant portion of individuals does not respond to this therapy.
Kidney cysts may be composed of cells with the intact TSC gene, as shown by a much lower percentage of loss of heterozygosity in cells lining the cysts in both mouse models and humans with TSC renal cystic disease (25). This is distinct from that in angiomyolipomata, which shows loss of TSC gene and function (26, 27). The first clue to the identity of cyst epithelial cells came from heterozygote Tsc2 (Tsc2+/−) mice, which appear to exhibit a predominance of A-intercalated (A-IC) cells in their cyst lining (25). A more recent report on Tsc1 inactivation in mouse principal cells showed that kidney cysts exhibited a gradual disappearance of Aquaporin 2 (AQP-2)–positive cells in their epithelium (28). The authors attributed the loss of AQP-2 staining to the dedifferentiation of principal cells (28). However, there were no detailed studies characterizing the non–AQP-2–expressing cells in cyst epithelium (28). Recently, we showed that in mice with Tsc2 deletion in kidney principal cells, the epithelia lining the cysts are predominantly composed of hyperproliferating A-IC cells, with intact TSC locus (29).
Results
Generation of Kidney Principal Cell-Specific Tsc1 Knockout Mice.
To develop a better insight into the pathogenesis of kidney cysts in TSC, mice with principal cell-specific deletion of the Tsc1 gene were generated by crossing Tsc1 (loxp/loxp) mice (30) with transgenic mice expressing Cre recombinase under the control of the promoter for Aqp-2, a kidney principal cell-specific molecule (31). Tsc1 knockout (KO) mice are normal at birth but have a life span of less than 8 wk (54 ± 4 d), consistent with published reports on this mouse model (28). Kidneys of Tsc1 KO mice are significantly larger than the wild-type (WT) mice (Fig. 1A). Low-magnification (Fig. 1 B, Upper) and higher-magnification hematoxylin and eosin stain (H&E) (Fig. 1 B, Lower) show kidneys from aged match 6-wk-old WT (Fig. 1 B, Left) and Tsc1 KO mice (Fig. 1 B, Right). Numerous cysts with varying sizes (highlighted with the letter C) were observed in 6-wk-old Tsc1 KO mice (Fig. 1 B, Right).


Generation of principal cell-specific Tsc1 KO mice. (A) Mice with principal cell-specific deletion of the Tsc1 gene were generated as described (Results). Kidneys of Tsc1 KO mice are larger than WT mice. (B) H&E staining with low magnification (global view; Upper) and higher magnifications (Lower) shows kidneys from age-matched 6-wk-old WT (Left) and Tsc1 KO mice (Right), respectively. There are multiple cysts with varying sizes (identified with the letter C) in 6-wk-old Tsc1 KO mice (Right).
RNA sequencing (RNA-seq) studies performed on the kidneys of 4-wk-old Tsc1 KO mice showed significant enhancement in the expression of Forkhead Transcription Factor 1 (Foxi1) in comparison with normal mouse kidneys. Foxi1 plays a crucial role in the expression and regulation of acid base transport machinery in A-IC cells, including several vacuolar H+-ATPase (V-H+-ATPase) subunits (e.g., d2 and b1), carbonic anhydrase 2 (CAII), and AE-1 (Slc4a1) (323334–35). Northern blot analyses confirmed a very robust increase in the expression of Foxi1 in kidneys of Tsc1 KO mice (Fig. 2 A, Left) but not in Pkd1 KO mice (Fig. 2 A, Right). In addition to Foxi1, the transcription factor Tfcp2l1, which is a critical player in IC cells-specific gene regulation (36), showed robust enhancement in RNA-seq studies. This was verified by northern hybridization studies (SI Appendix, Fig. S1 A, Left). Tfcp2l1 expression in Pkd1 KO mice remained unchanged vs. WT mice (SI Appendix, Fig. S1 A, Right).
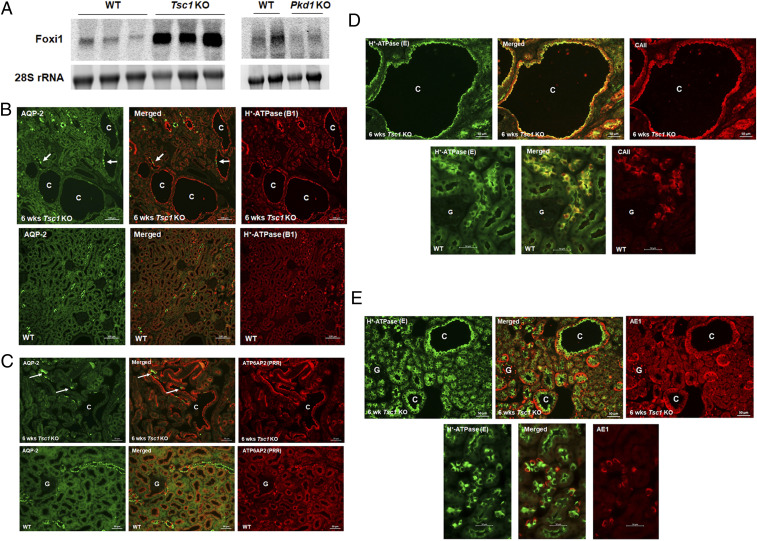
Characterization of cystic epithelium in kidneys of Tsc1 KO mice. (A) Northern hybridizations of Foxi1 expression in kidneys of Tsc1 KO mice (Left) vs. Pkd1 mutant mice (Right) show enhanced Foxi1 expression in Tsc1 KO but not in Pkd1 KO mice. (B) Double-label immunofluorescence images with polyclonal H+-ATPase B1-subunit and monoclonal AQP-2 antibodies in 6-wk-old Tsc1 KO (Upper) and WT mice (Lower). Arrows indicate the few AQP-2–positive principal cells that are present in Tsc1 KO cysts. SI Appendix, Fig. S1B shows additional images. (C) Double-immunofluorescence labeling images with ATP6AP2 (PRR) and monoclonal AQP-2 antibodies in Tsc1 KO (Upper) and WT mice (Lower). (D). Double-labeling images with CAII and monoclonal H+-ATPase (E subunit) antibodies in age-matched Tsc1 KO (Upper) and WT mice (Lower). (E) Double-labeling images with AE-1 and monoclonal H+-ATPase E antibodies in Tsc1 KO (Upper) and WT mice (Lower). C represents cysts, and G represents glomerulus. Information regarding antibody concentrations can be found in SI Appendix, Table S1. Additional immunofluorescence images with polyclonal H+-ATPase B1 and monoclonal AQP-2 antibodies in human kidney cysts (SI Appendix, Fig. S2A) and in kidneys of heterozygote Tsc2+/− mice (SI Appendix, Fig. S2B) are provided. Kidneys from Pkd1 KO (Pkhd1-Cre) mice are shown for comparison (SI Appendix, Fig. S2C). rRNA, ribosomal RNA.
A detailed transcriptome analysis of Tsc1 KO mice kidneys revealed significant enhancement in the expression of several kidney predominant H+-ATPase subunits including v1g3 and v0d2 subunits, with the latter exhibiting a kidney expression pattern limited to IC cells, and the kidney- and lung-specific v1c2 subunit (373839–40). In addition, RNA-seq analysis demonstrated enhanced expressions of Slc4a1 (AE-1), which is the basolateral Cl−/HCO3− exchanger in A-IC cells (4142–43), the cytoplasmic CAII, adenyl cyclase 5, and Aqp-6. As indicated, these molecules are either exclusively (AE-1, Aqp-6, and adenyl cyclase 5) or predominantly (H+-ATPase and CAII) expressed in A-IC cells (373839404142434445–46).
Double-immunofluorescence microscopy with H+-ATPase and AQP-2 antibodies (Fig. 2 B, Upper) demonstrated robust expression of H+-ATPase in over 90% of cells lining the larger cysts with few AQP-2–expressing cells interspersed among them. The epithelia in smaller cysts showed a moderate number of AQP-2–expressing cells adjacent to H+-ATPase–expressing cells (Fig. 2B). The expression pattern of H+-ATPase and AQP-2 in WT mice is shown for comparison in Fig. 2 B, Lower, and demonstrates an abundant number of AQP-2–expressing cells. Larger magnifications of double labeling with H+-ATPase and AQP-2 antibodies in Tsc1 KO and WT mice are shown in SI Appendix, Fig. S1B. Double labeling with prorenin receptor (PRR)—also known as ATP6AP2—and AQP-2 antibodies showed ATP6AP2 expression on the apical membrane of a strong majority of cells lining the cysts, with few but distinct AQP-2–expressing cells (Fig. 2 C, Upper), confirming the localization of ATP6AP2 on the apical membrane of A-IC cells (47484950–51). The expression pattern of ATP6AP2 and AQP-2 in WT mice is shown for comparison and indicates an abundant number of cells expressing AQP-2 (principal cells) and ATP6AP2 (IC cells) adjacent to each other (Fig. 2 C, Lower). Double labeling with H+-ATPase with CAII or AE-1 antibodies showed coexpression of H+-ATPase with cytoplasmic CAII (Fig. 2D) or basolateral AE-1 (Fig. 2E) in the majority of cyst epithelia. Double-labeling images in WT animals are shown for comparison (Fig. 2 D, Lower, and E, Lower). We also found that renal cysts from TSC patients and heterozygote Tsc2 mice (Tsc2+/−) show a predominance of A-IC cells when stained with H+-ATPase and AQP-2 antibodies (SI Appendix, Fig. S2 A and B). Kidneys from Pkd1 KO mice (52) stained with the above antibodies (SI Appendix, Fig. S2C) indicate a predominance of AQP-2–positive principal cells with few H+-ATPase–expressing A-IC cells in cysts epithelia originating from the cortical collecting ducts, a distinct difference from that of Tsc1 KO mice.
mTORC1 Activation in Cyst Epithelium Is Mainly Detected in H+-ATPase–Overexpressing IC Cells That Have Intact Tsc1.
Cyst epithelia displayed robust mTORC1 activation as demonstrated by strong phospho-S6 levels in 6-wk-old Tsc1 KO mice (Fig. 3 A, Right) compared with WT mice (Fig. 3 A, Left). Double labeling with Tsc1 (Hamartin) and H+-ATPase antibodies demonstrated remarkable colocalization in cyst epithelial cells in Tsc1 KO mice (Fig. 3B). Double labeling with Tsc1 and AQP-2 antibodies indicated the expression of Tsc1 in the majority of cells lining the cysts with few and distinct AQP-2–expressing (principal cells [PC]) cells (SI Appendix, Fig. S3A). These results indicate the activation of mTORC1 in genetically intact A-IC cells lining the cysts and strongly suggest that A-IC cells are the primary kidney cells that are robustly proliferating in the cystic epithelium of Tsc1 KO mice. Active proliferation of A-IC cells in cyst epithelia was verified by double labeling with Proliferating Nuclear Cell Antigen (PCNA) and H+-ATPase antibodies (Fig. 3C). As indicated, there is a remarkable colocalization of both H+-ATPase and PCNA in A-IC cells lining the cysts as detected in the merged image in Tsc1 KO mice (Fig. 3 C, Upper Center). The labeling in WT mice is shown in Fig. 3 C, Lower, where few PCNA-positive cells are detected.

mTORC1 activation in cyst epithelium is mainly detected in V-H+-ATPase–expressing IC cells that have intact Tsc1 and are proliferating. (A) Levels of phospho-S6 expression in Tsc1 KO (Right) vs. WT mice (Left). As indicated, IC cells that line the cysts in Tsc1 KO mice display enhanced mTORC1 activation. (B) Expression of Tsc1 (Hamartin) in kidneys of Tsc1 KO mice illustrated by double-label immunofluorescence using polyclonal H+-ATPase B1 and monoclonal Tsc1 antibodies. The IC cells lining the cysts display normal expression of Tsc1 (hamartin) in non–AQP-2–expressing cells. (C) Proliferation of IC cells in cyst epithelia of Tsc1 KO mice. Double labeling with V-H+-ATPase (B1 subunit; Right) and monoclonal PCNA (Left) antibodies, with merged images in Center performed on 6-wk-old Tsc1 KO mice (Upper) and WT mice (Lower). C represents cysts. G represents glomerulus. Arrows point to PCNA and H+-ATPase positive cells.
Generation of Foxi1/Tsc1 Double-Knockout Mice.
To examine the role of Foxi1 in kidney cystogenesis, Foxi1/Tsc1 double-knockout (dKO) mice were generated by cross-breeding Foxi1 KO (32) with principal cell-specific Tsc1 KO mice. At 6 wk of age, Foxi1/Tsc1 dKO mice are smaller (15.6 ± 0.6 g) than Tsc1 KO (20 ± 1 g) and WT mice (22.1 ± 1 g) and showed comparable body weights with Foxi1 KO mice (16.1 ± 1 g). Northern hybridizations verified the generation of Foxi1/Tsc1 dKO mice (Fig. 4 A, Left). H&E staining, performed on age-matched 6-wk-old genotypes, showed numerous kidney cysts in Tsc1 KO mice (Fig. 4 A, Middle Left and Bottom Left). However, Foxi1/Tsc1 dKO mice showed a complete absence of kidney cysts (Fig. 4 A, Middle Right and Bottom Right). MRI studies indicated numerous cysts in kidneys of Tsc1 KO mice and the complete absence of cyst burden in Foxi1/Tsc1 dKO mice (Fig. 4 B, Center vs. Right).

Generation and examination of Foxi1/Tsc1 dKO and CAII/Tsc1 dKO mice: effects on kidney cystogenesis. (A) Generation of Foxi1/Tsc1 dKO mice. Mice with Foxi1 deletion were crossed with Tsc1 KO mice. Northern hybridizations verified the generation of Foxi1/Tsc1 dKO mice (Left). H&E staining showed that compared with Tsc1 single-mutant mice (Middle Left and Bottom Left), Foxi1/Tsc1 dKO mice had complete absence of cyst generation in their kidneys vs. numerous cysts in kidneys of Tsc1 single-mutant mice (Middle Right and Bottom Right). (B) MRI examination of kidneys of Tsc1 and Foxi1/Tsc1 dKO mice. Live anesthetized WT, Tsc1 KO, and Foxi1/Tsc1 dKO mice were subjected to kidney MRI procedure (described in Materials and Methods). As demonstrated, Foxi1 deletion completely abrogated the cyst burden in Foxi/Tsc1 dKO mice. (C) Expression of H+-ATPase in kidneys of Foxi1/Tsc1 dKO mice. (Left) Northern hybridization of the H+-ATPase D2 subunit. The kidney mRNA expression of H+-ATPase D2 subunit is shown in WT, Tsc1 KO, Foxi1/Tsc1 dKO, and Foxi1 KO mice. (Right) Double-label images with polyclonal H+-ATPase (B1 subunit) and monoclonal AQP-2 are displayed in kidneys of Foxi1/Tsc1 dKO (Lower) vs. Tsc1 KO mice (Upper). SI Appendix, Fig. S4 shows additional images. (D) Generation of CAII/Tsc1 dKO mice. CAII KO mice were crossed with Tsc1 KO mice. H&E staining showed that compared with Tsc1 KO (Left), CAII/Tsc1-dKO had a significant reduction in the number and size of cysts (Right). C represents cysts. rRNA, ribosomal RNA. Arrows in D point to small cysts in kidneys of CAII/Tsc1 dKO mice.
We next examined the messenger RNA (mRNA) expression of kidney-specific (and bone-specific) H+-ATPase D2 subunit, which in the kidney, shows exclusive expression in IC cells (37, 38). The results show a robust expression of H+-ATPase D2 in kidneys of Tsc1 KO and a nearly complete abrogation of its expression in kidneys of Foxi1 KO and Foxi1/Tsc1 dKO mice (Fig. 4 C, Left). Immunofluorescence microscopy studies using AQP-2 and H+-ATPase B1-subunit antibodies (we could not obtain a functional D2-subunit antibody) showed a faint labeling of H+-ATPase in the collecting ducts in Foxi1/Tsc1 dKO mice vs. abundant expression in cystic epithelium in Tsc1 KO mice (Fig. 4 C, Right). The intensity of H+-ATPase staining in kidneys of WT and Foxi1 KO mice is shown for comparison (SI Appendix, Fig. S4).
Generation of CAII/Tsc1 dKO Mice.
CAII is regulated by Foxi1 and plays an important role in IC cell physiology, including apical H+-ATPase function. To examine the role of CAII in cystogenesis, CAII KO (5354–55) and Tsc1 KO mice were mated in order to generate CAII/Tsc1 dKO mice. Low- and high-magnification H&E staining showed that CAII/Tsc1 dKO mice had a significant reduction in the number and size of cysts compared with Tsc1 KO mice (Fig. 4D). Further, the size of cysts was significantly larger in Tsc1 KO vs. CAII/Tsc1-dKO mice. CAII/Tsc1-dKO mice have a life expectancy of over 115 d compared with Tsc1 KO mice, which live an average of 54 ± 4 d. The CAII/Tsc1-dKO mice develop cystic kidneys later in life. Tsc1/Foxi1 dKO mice do not develop renal cysts with or without HCO3− (at 140 mM/L) added to their drinking water when examined at 6 to 7 wk of age, suggesting that the presence of acidosis consequent to Foxi1 inactivation or its correction does not have any significant effect on the prevention of renal cystogenesis by Foxi1 deletion.
Detection of the Electrogenic 2Cl−/H+ Exchanger, CLC-5, on the Apical Membrane of Cyst Epithelium.
RNA-seq analysis indicated a significant enhancement in the expression of CLC-5, an electrogenic 2Cl−/H+ exchanger (56) in kidneys of Tsc1 KO mice. The CLC-5 expression in human kidney is detected in several nephron segments, including the proximal tubule, thick ascending limb, and IC cells (56, 57), where it is predominantly localized to the late endosomal/lysosomal membranes and plays a critical role in transporting chloride into the lumen by dissipating H+ secretion-mediated acidification and membrane depolarization by H+-ATPase, thus allowing parallel movement of Cl−- and H+-ATPase–driven H+ into endosomes (565758–59).
We have performed double-immunofluorescence labeling with CLC-5 and H+-ATPase antibodies in WT and Tsc1 KO. Our results demonstrate a remarkable colocalization of CLC-5 (Fig. 5, Upper Right) and H+-ATPase (Fig. 5, Upper Left) on the apical membrane of cyst epithelia in Tsc1 KO mice (merged image in Fig. 5, Upper Center). The expression of CLC-5 and H+-ATPase in WT mice is shown for comparison and clearly indicates the predominant localization of CLC-5 on the subapical and/or intracellular compartment of proximal tubule and IC cells (Fig. 5, Lower).

Localization of CLC-5 in kidneys of Tsc1 KO mice. Double-labeling images with monoclonal H+-ATPase E-subunit (Left) and polyclonal CLC-5 (Right) antibodies, with the merged image in Center on 6-wk-old Tsc1 KO mice (Upper). White arrows in Upper point to the localization of H+-ATPase and CLC-5 on the apical membrane of cyst epithelia. The double-labeling studies in WT mice are shown in Lower. Blue arrows point to proximal tubule cells, while the yellow arrows highlight IC cells. C represents cysts.
The Absence of Dedifferentiation in Cystic Epithelium.
Maintenance of renal collecting duct PC and IC cell fate selection is dependent on Notch signaling (6061–62). To develop better insight into the identity of IC cells preponderance in cyst epithelia, double-immunofluorescence labeling studies were performed with antibodies against HES1 and AQP-2, FOXI1 and H+-ATPase, and FOXI1 and AQP-2 in Tsc1 KO mice. We clearly observe that HES1-expressing cells in cyst epithelia, rare as they are, also express AQP-2 (SI Appendix, Fig. S5). The results further show that Foxi1-expressing cells in cyst epithelia also express H+-ATPase and are distinct from AQP-2–expressing cells, which do not express Foxi1 in cyst epithelia (SI Appendix, Fig. S5). These observations in addition to the results in Fig. 3B, which show that A-IC cells in the cystic epithelium express hamartin, suggest that the cells lining the cysts are predominantly composed of genotypically normal cells that bear all the characteristics of A-IC cells. Further, the expression of hamartin indicates that the cystic epithelial cells are not dedifferentiated PC cells.
Discussion
The most salient features of the current studies are 1) the activation of the Foxi1 gene in kidneys of Tsc1 KO mice, 2) the complete disappearance of kidney cysts by Foxi1 deletion in Foxi1/Tsc1-dKO mice, 3) a significant protection against cyst generation and/or enlargement in CAII/Tsc1-dKO mice (Figs. 2 and 4), and 4) the colocalization of CLC-5 and H+-ATPase on the apical membrane of cyst epithelium (Fig. 5). As indicated, genetically intact A-IC cells comprise more than 90% of cells lining the kidney cysts in Tsc1 KO mice, with few mutant principal cells interspersed in between (Fig. 2). There was a lack of markers for the proximal tubule, thick ascending limb, distal convoluted tubule, or B-IC cells in cells lining the cysts in Tsc1 KO mice (SI Appendix, Fig. S6).
The absence of colocalization of markers of principal cells and A-IC cells in cyst epithelia (Fig. 2), as well as the presence of intact hamartin (Tsc1) in A-IC cells (Fig. 3), strongly suggests that the cystic epithelia does not display dedifferentiation of principal and IC cells. The robust expression of Hamartin (TSC1) on the apical/subapical membrane of A-IC cells lining the cysts in Tsc1 KO mice (above) is in agreement with published studies indicating the preferential localization of TSC1 (and TSC2) to the apical/subapical membrane of A-IC cells in normal kidney (63).
The kidney cystogenesis in mice with Tsc1 inactivation has significant differences compared with Pkd1 KO mice. Cyst epithelia in Tsc1 mutant mice are overwhelmingly composed of A-IC cells, with few principal cells (Figs. 2 and 3). This is significantly different from the cysts originating from the collecting duct in an autosomal dominant polycystic kidney disease (ADPKD) mouse model (Pkhd1-Cre; Pkd1fl/fl), which exhibits an abundant number of principal cells and few IC cells (SI Appendix, Fig. S2). Further, A-IC cells do not participate in cyst expansion in either Pkd1 or Pkd2 mouse model (52, 64), whereas they play a dominant role in cystogenesis in both Tsc1 and Tsc2 KO mice (Figs. 2 and 4) (29).
The only Food and Drug Administration–approved therapy for autosomal dominant polycystic kidney disease is the vasopressin receptor 2 antagonist tolvaptan (65), which works by inhibiting cystic fibrosis transmembrane conductance regulator (CFTR)-mediated chloride secretion across the apical membrane of principal cells into cyst lumen consequent to vasopressin-activated cyclic adenosine monophosphate stimulation. Given the sparse presence of principal cells and the dominant abundance of A-IC cells in cyst epithelia in Tsc1 KO mice, we suggest that V2 receptor antagonists, such as tolvaptan, may have a minimal impact on fluid secretion and cyst expansion in TSC. Recent studies suggest that in addition to CFTR, calcium-activated chloride channels may play an important role in fluid secretion in cysts in ADPKD (66).
Current studies in Tsc1 KO mice (above), recent studies in Tsc2 KO mice (29), fluorescence microscopy in kidneys of Tsc2+/− mice (25) (SI Appendix, Fig. S2), and staining in kidney cysts in humans with TSC (SI Appendix, Fig. S2) all indicate that the cyst epithelia in TSC are predominantly composed of genetically normal A-IC cells. A similar kidney cyst phenotype is also observed in mice with Tsc1 deletion in pericytes (29). Together, these results strongly suggest that in TSC renal cystic disease, the process of cystogenesis involves a reprogramed gain of function in the genetically normal, cyst-forming A-IC cells that is associated with the disappearance of PC cells. IC cells express Notch ligands Delta-like-1 or Jagged, whereas, the adjacent PC cells express Notch (36, 61). The interaction of Notch with its ligand is necessary for PC cell fate and is dependent upon HES1 expression, which suppresses the expression of the IC cell-specific transcription factor FOXI1 (60, 61). Our results demonstrate a preponderance of genotypically normal A-IC cells and a paucity of PC and B-IC cells in cyst epithelia (Figs. 2 and 3 and SI Appendix, Fig. S6). While these observations may be consistent with impaired Notch signaling, it should be noted that the disruption of Notch signaling in PC cells through ablation of Hes1 does not lead to cyst formation despite alteration of the IC to PC cell ratio (61). In addition, the PC cell-specific deletion of Hes1 (61) causes the expansion of B-IC (Pendrin+) cells in cortical collecting ducts (CCD). This is in contrast to our results, which show disappearance of both PC and B-IC cells and expansion of A-IC (H+-ATPase+) cells in cystic epithelial cells in Tsc1 KO mice.
The role of CFTR in fluid secretion and cyst expansion in ADPKD is well established (65), but due to the paucity of principal cells in cyst epithelia in TSC, it is unlikely that it plays a critical role in cyst expansion in TSC. Our results (Fig. 5) demonstrate the remarkable colocalization of CLC-5 and H+-ATPase on the apical membrane of cyst epithelia in Tsc1 KO mice. There have been no published reports on the apical membrane localization of CLC-5 in IC cells in any disease states. These results (Fig. 5) point to enhanced translocation of CLC-5 and H+-ATPase from late endosomes/lysosomes to the apical membrane of cyst epithelia in TSC. Further, this strongly suggests that similar to the late endosomes, CLC-5 and H+-ATPase may function synergistically on cyst epithelia where H+-ATPase–mediated H+ secretion could drive Cl− secretion via CLC-5, resulting in H+ recycling. This interaction allows for continued secretion of Cl− and H+ into the cyst lumen.
H+-ATPase is ubiquitously expressed in the membranes of intracellular organelles, including lysosomes, where it plays a crucial role in their acidification. H+-ATPase and mTORC1 synergistically activate each other, with H+-ATPase playing an important role in sustaining mTORC1 activation in lysosomal membranes and mTORC1 exhibiting a facilitative role in the assembly of V0 and V1 subunits of H+-ATPase (676869–70). It is worth mentioning that the cross-stimulatory effects of H+-ATPase and mTORC1 have been described primarily in lysosomal membranes (6263–64). However, the H+-ATPase shows robust expression on the apical membrane, and mTORC activity is enhanced in the cytoplasm of A-IC cells that line the cyst (Figs. 2 and 3), which when coupled to enhanced proliferation (PCNA labeling) (Fig. 3) and expression of markers of A-IC cells (AE-1, Aqp-6, and Foxi1), strongly point to a unique amplification circuit involving mTORC/Foxi1/H+-ATPase, leading to the dysregulation of cell growth, expansion of A-IC cells, and cystogenesis subsequent to initial signals by TSC mutant cells (e.g., principal cells or pericytes).
The (pro-)renin receptor PRR (or ATP6AP2), which is strongly expressed on the apical membrane of cyst epithelia in Tsc1 KO mice (Results), is known to perform multiple distinct functions, both as a receptor ligand as well as an enzyme and its precursor (47484950–51). ATP6AP2 is thought to be functionally linked to H+-ATPase as an accessory subunit, therefore facilitating acid secretion across the plasma membrane in epithelial cells such as kidney A-IC cells (484950–51). PRR (ATP6AP2) is also linked to Wnt signaling, which could be critical for cell survival and embryonic development (50). Activation of ATP6AP2 stimulates mitogen-activated protein kinase and a cascade of biological pathways, including Wnt/Fz receptor complex and cyclooxygenase-2–activating signals independent of angiotensin II and renin-angiotensin system (RAS) (49, 50). A possible role for ATP6AP2 (PRR) in the activation of RAS has been proposed (48) but not verified (51).
These reports demonstrate that the progression and enlargement of kidney cysts in TSC are dependent on rapidly proliferating, genetically normal IC cells. The mechanism or nature of signals originating from mutated principal cells that target A-IC cells in Tsc1 KO mice remains speculative. Whether principal cells are communicating with the neighboring A-IC cells through extrusion of microvesicles to the extracellular space, as suggested by in vitro studies (29), warrants investigation. The cystic fluid in Tsc2 KO mice was acidic, with a pH of ∼5.6 (29). Similarly, our results confirm the presence of cystic fluid acidity (pH 6.3 ± 0.12, n = 8) in Tsc1 KO mice. These results are consistent with enhanced acid secretion into the cyst lumen via H+-ATPase. Studies in perfused cortical distal tubules have shown that H+-ATPase–mediated H+ secretion stimulates chloride secretion into the lumen of the renal collecting duct via apical chloride channels (71). The inactivation of CAII, which is essential for H+-ATPase activation and H+ secretion, significantly blunted the cyst burden in Tsc1 KO mice (Results), strongly suggesting that the activation of H+-ATPase could play a crucial role in cystogenesis in TSC. These results further raise the strong possibility that enhanced H+-ATPase activity in cyst epithelia plays a key role in chloride secretion into the cyst lumen in Tsc1 KO mice. The apical colocalization of CLC-5 and H+-ATPase in cyst epithelia (Results) raises the strong possibility of enhanced CLC-5–mediated chloride secretion into the cyst lumen that is driven by H+-ATPase activation and acid secretion. Maneuvers aimed at inactivating or inhibiting CLC-5 in Tsc1 KO mice could uncover the role of CLC-5 in fluid secretion and cyst expansion in TSC.
It should be noted that attempts to impair H+-ATPase, CLC-5, PRR, CAII, or AE-1 in A-IC cells, as a therapeutic maneuver to inhibit cystogenesis in TSC, may interfere with acid secretion and bicarbonate reabsorption in A-IC cells in the CCD, which could result in distal renal tubular acidosis. It is therefore imperative that maneuvers aimed at blocking or down-regulating these molecules (such as using carbonic anhydrase inhibitors) be supplemented with oral bicarbonate to minimize deleterious effects of metabolic acidosis.
Materials and Methods
Animal Models: Generation of Principal Cell-Specific Tsc1 Deletion.
Tsc1 flox mice and Aqp-2 cre mice were established and cross-bred (30, 31). The following primer sequences were used for tail PCR genotyping to identify the conditional and null alleles for Tsc1: F4536 (5′-AGG AGG CCT CTT CTG CTA CC-3′), R4830 (5′-CAG CTC CGA CCA TGA AGT G-3′), and R6548 (5′-TGG GTC CTG ACC TAT CTC CTA-3′). PCR conditions for Tsc1 were as follows: 94 °C for 5 min, 1 cycle; 94 °C for 30 s, 58 °C for 30 s, and 72 °C for 30 s, 45 cycles; 72 °C for 7 min, 1 cycle; and hold at 4 °C. Combining all three oligonucleotides in the PCR provides amplification products of size 295 for a WT allele, 486 for a conditional allele, and 368 for a null allele (30). Genotyping was also performed on the following primer sequences to identify the presence or absence of the Aqp-2 transgene: mAqp-2 F (5′-CCT CTG CAG GAA CTG GTG CTG G-3′) and CreTag R (5′-GCG AAC ATC TTC AGG TTC TGC GG-3′). PCR conditions were as follows: 94 °C for 5 min, 1 cycle; 94 °C for 30 s, 63 °C for 30 s, and 72 °C for 1:30 min, 40 cycles; 72 °C for 7 min, 1 cycle; and hold 4 °C. The presence of the Aqp-2 transgene resulted in an amplified 671-base pairs (bp) band signifying the junction between the mouse Aqp-2 promoter and the Cre gene.
Generation of Foxi1/Tsc1 double-mutant mice was accomplished by crossing Tsc1/Aqp-2 cre mice with Foxi1 KO mice. Details for the generation of the Foxi1 null mice have been reported previously (32). The genotyping for Foxi1 KO mice was performed using the following primer sequences: Foxi1 Common (5′-CGA CCT CCC AGC GCC T-3′), Foxi1 WT Reverse (5′-GCT GCC TCT GCA TGC CA-3′), and Foxi1 Mutant (5′-GGC CAG CTC ATT CCT CCA CT-3′). PCR conditions were as follows: 94 °C for 2 min, 1 cycle; 94 °C for 30 s, 65 °C for 30 s, and 68 °C for 45 s, 40 cycles; 68 °C for 1 min, 1 cycle; and hold at 4 °C.
Generation of CAII/Tsc1 double-mutant mice was accomplished by crossing Tsc1/Aqp-2 cre mice with CAII KO mice. Details for the generation of the CAR2 (CAII) null mice have been reported previously (53). The genotyping for CAII KO mice was performed using the following primer sequences: CAII Sense (5′-AAC CCC TGC ATT TCT GCA GAT TGG ACC TGC GTC A-3′) and CAII Antisense (5′-TGG AAG CAA TTA TTT ACC TCC GG-3′). PCR conditions were as follows: 94 °C for 2 min, 1 cycle; 94 °C for 30 s, 62 °C for 30 s, and 68 °C for 1 min, 50 cycles; 68 °C for 1 min, 1 cycle; and hold at 4 °C. The PCR products then undergo a digest with Tsp45I (New England Biolabs) at 63° for 3 h and run on a 3% agarose gel where a WT allele results in 162- and 34-bp bands, while a KO allele has only a 195-bp band.
WT and mutant animals were housed and cared for in accordance with the Institutional Animal Care and Use Committees (IACUCs) at the University of Cincinnati and the University of New Mexico. All animal handlers were IACUC trained. Animals had access to food and water ad libitum; were housed in humidity-, temperature-, and light/dark-controlled rooms; and were inspected daily. Animals were euthanized with the use of excess anesthetics (pentobarbital sodium) according to institutional guidelines and approved protocols.
Immunofluorescent Microscopy.
Animals were euthanized with an overdose of pentobarbital sodium, perfused with saline at room temperature, and then fixed with 4% paraformaldehyde in phosphate-buffered saline (PBS) solution. The kidneys were removed, cut in tissue blocks, and stored in 4% paraformaldehyde/PBS solution overnight at 4 °C. The following day, tissues were then transferred and stored in 70% ethanol. Fixed tissues were embedded in paraffin, and 5-μm sections were cut and stored until used. The expression of Aqp-2, vacuolar ATPase (V-ATPase) B subunit, pendrin, NBC-e1, PRR, Slc4a1 (AE-1), CLC-5, PCNA, and Tsc1 in the kidney was examined in WT and Tsc1 KO mice. Mouse Pkd1 KO slides were examined for the expression of both Aqp-2 and H+-ATPase. To prepare for immunofluorescence staining, slides were baked at 60 °C for 1.5 h and subjected to sodium citrate antigen retrieval (29, 67, 68). Next, slides were incubated with primary antibodies overnight in a humidity chamber at 4 °C. The following day, slides were washed in PBS, and secondary antibodies (AlexaFluor 594 or 488; Invitrogen) were applied to slides in a humidity chamber at room temperature for 2 h. Slides were washed in PBS, dried, and coverslipped with Vectashield Hard-Set (Vector Labs). Immunofluorescence single- and double-labeling microscopic images were acquired using a Zeiss Axio Imager.M2 microscope and Zeiss Zen Software (Zeiss).
RNA Isolation and Northern Hybridization.
Total cellular RNA was extracted from kidneys with TriReagent (MRC), quantitated spectrophotometrically, and stored at −80 °C. Kidneys from mutant Pkd1 mice used for RNA extraction were provided by Terry Watnick and Patricia Outeda Garcia, University of Maryland School of Medicine, Baltimore, MD. Hybridization was performed according to established protocols (29, 72, 73). Gene-specific DNA fragments were generated by RT-PCR and used as specific probes for northern blot hybridization. For Foxi1, the primers 5′-AGCAAGGCTGGCTGG-CAGAA-3′ and 5′-TGGCCACGGAGCGGCTAATA-3′; for H+-ATPase v0d2 subunit, the primers 5′-TGTCACCCACTGGGCGTT-3′ and 5′-ACTGGCACCGACAGCGTCAA-3′; and for Tfcp2l1, the primers 5′-TGTGTTGTGTGCCGCCACCT-3′ and 5′-ACAGCATTCAGC TGGGTTGGGC-3′ were used to generate DNA fragments that were purified, labeled with 32P, and used as probes for northern hybridization.
Antibodies.
Antibodies utilized in immunofluorescence studies along with their sources, catalog numbers (if applicable), research resource identifiers, host species, description, and titer can be found in SI Appendix, Table S1. We have used both monoclonal and polyclonal AQP-2 and H+-ATPase antibodies (29). We have used polyclonal H+-ATPase B1 subunit in combination with monoclonal antibodies (such as PCNA or AQP-2 antibodies) but have used the monoclonal H+-ATPase E subunit in conjunction with polyclonal antibodies (such as CLC-5, CAII, or AE-1). The polyclonal H+-ATPase B1-subunit antibodies were raised in rabbits against a synthetic peptide with the amino acid sequence Cys-Ser-His-Ile-Thr-Gly-Gly-Asp-Ile-Tyr-Gly-Ile-Val-Asn-Glu-Asn using commercial services of Sigma-Genosys. SI Appendix, Fig. S3 B, Left, shows the specificity of the H+-ATPase B1 subunit in kidney by labeling the IC cells. There was no labeling with the preimmune serum (SI Appendix, Fig. S3 B, Right). The polyclonal AQP-2 antibodies were raised in our laboratory as described (74).
MRI Studies.
The animal MRI protocol was approved by IACUC of the University of New Mexico. High-resolution in vivo mouse kidney MRI was performed using a 7T Biospec dedicated research MR scanner (Bruker BioSpin) equipped with a circularly polarized mouse body volume coil (outer/inner diameter: 59/35 mm) combined with a 60-mm high-performance gradient coil. The mice were anesthetized using isoflurane gas (induction dosage 2 to 3%; maintenance dosage 1.5 to 2%) and a mixture of O2:N2; O gases in the ratio 2:1 delivered during the measurements. Real-time monitoring of physiological parameters (body temperature and respiratory rate) was performed during the entire duration of the study. A tripilot scan using gradient echo sequence was used to acquire initial localizer images. T2-weighted MRI was performed with a fast spin-echo sequence (rapid imaging with refocused echoes), repetition time/echo time = 3,300/30 ms, field of view = 25 × 27 cm, slice thickness = 0.5 mm, number of slices = 30 to 36 (cover the whole lower body), image resolution = 100 μm, and number of average = 9. The acquired images were processed in an integrated image acquisition and processing software environment ParaVision 6.1 (Bruker BioSpin).
Statistical Analysis.
Statistical significance between the results in WT and Tsc1 KO or dKO mice was determined by Student's unpaired t test or ANOVA, and P < 0.05 was considered significant.
Acknowledgements
These studies were supported by Merit Review Award 5 I01 BX001000-06 (Department of Veterans Affairs), Dialysis Clinics Inc. Grant C-4149, NIH Grants R01HL140839-01 (to M.S.) and R01HL138481 (to J.J.Y.), and George M. O’Brien Kidney Center at Yale Grant P30 DK079310. This research made use of the Fluorescence Microscopy and Cell Imaging Shared Resource, which is supported partially by University of New Mexico (UNM) Comprehensive Cancer Center Support Grant NCI P30CA118100, and the Department of Pharmaceutical Sciences, College of Pharmacy preclinical imaging core, BRaIN Imaging Center, UNM Health Science Center. The funders had no role in study design, data collection and analysis, decision to publish, or preparation of this manuscript.
Data Availability.
All study data are included in the article and/or supporting information.
References
1
2
3
4
5
6
7
8
9
10
11
13
15
16
17
18
19
21
22
23
24
25
26
27
28
29
30
31
32
33
34
35
36
37
38
39
40
41
42
43
44
45
46
47
48
49
50
51
52
53
54
55
56
57
58
60
61
62
63
64
65
66
67
69
70
71
72
73