
Contributed by Jens Nielsen, February 19, 2021 (sent for review September 14, 2020; reviewed by James J. Collins)
Author contributions: J.G., F.L.-I., and J.N. designed research; J.G. and G.L. performed research; J.G., B.J., and G.L. analyzed data; and J.G. and J.N. wrote the paper.
Reviewer: J.J.C., Massachusetts Institute of Technology.
Quantitatively understanding and predicting spatiotemporal dynamics of microbiota is imperative for development of tailored microbiome-directed therapeutics treatments. However, the complexity of microbial variations, due to interactions with the host, other microbes, and environmental factors, makes it challenging to identify how microbiota colonize in the human gut. Here, we describe a novel multiscale framework for COmputing the DYnamics of the gut microbiota (CODY), which enables the quantification of spatiotemporal-specific variations of gut microbiome abundance profiles, without a prior knowledge of microbiome interactions. Importantly, the predictive power of CODY is demonstrated using cross-sectional data from two longitudinal metagenomics studies—the microbiota development during early infancy and during short-term diet intervention of obese adults.
Microbial variations in the human gut are harbored in temporal and spatial heterogeneity, and quantitative prediction of spatiotemporal dynamic changes in the gut microbiota is imperative for development of tailored microbiome-directed therapeutics treatments, e.g. precision nutrition. Given the high-degree complexity of microbial variations, subject to the dynamic interactions among host, microbial, and environmental factors, identifying how microbiota colonize in the gut represents an important challenge. Here we present COmputing the DYnamics of microbiota (CODY), a multiscale framework that integrates species-level modeling of microbial dynamics and ecosystem-level interactions into a mathematical model that characterizes spatial-specific in vivo microbial residence in the colon as impacted by host physiology. The framework quantifies spatiotemporal resolution of microbial variations on species-level abundance profiles across site-specific colon regions and in feces, independent of a priori knowledge. We demonstrated the effectiveness of CODY using cross-sectional data from two longitudinal metagenomics studies—the microbiota development during early infancy and during short-term diet intervention of obese adults. For each cohort, CODY correctly predicts the microbial variations in response to diet intervention, as validated by available metagenomics and metabolomics data. Model simulations provide insight into the biogeographical heterogeneity among lumen, mucus, and feces, which provides insight into how host physical forces and spatial structure are shaping microbial structure and functionality.
Changes in the human gut microbiome composition are connected with development of numerous diseases, like obesity, type-2 diabetes, and immune dysfunction (12–3). Quantitative understanding and predicting how microbial variations are determined are crucial for designing microbiome-directed therapies that target chronic metabolic diseases (4, 5). However, this remains challenging due to the temporal and spatial heterogeneity along the human gut resulting from a dynamic interplay among host, microbial, and environmental conditions (6, 7). Diet is recognized as a controllable and pivotal environmental factor in shaping longitudinal microbial landscape development (8, 9), such as early childhood colonization (10) and long-term adulthood stabilization (11). While profiling of fecal samples enables a snapshot of consequential changes of the fecal microbiota in response to different stimuli, e.g. dietary changes (1213–14), it is still far from describing the intrinsic dynamics of how microbiome colonize in the gut. Recently, the spatial heterogeneity of microbial composition between lumen and mucus has been recognized in mice (15, 16), but similar studies in humans is impossible with current techniques. In addition, measurements of absolute abundance profiles are required to correct the artifacts associated with relative abundance that confound revealing the interplay between microbial variations and health (17). Therefore, methods that enable quantifying the absolute, temporal, and spatial variations of in vivo human gut microbiota are needed to understand how to maintain or restore healthy microbiota.
Computational models are widely used to decipher microbial complexity and response to perturbations (18). Most existing models have limited usage as they only address specific elements of the multidimensional interaction mechanisms. For example, similarity-based (19) and rule-mining models (20) describe microbial–microbial interactions without considering temporal dependency. The dynamic Bayesian model enables incorporation of directed interactions and longitudinal dataset (21), while reliance on training dataset and difficulties in model selection render these stochastic models confining to specific statistic condition and predictions are therefore not consistent and generalizable (22). The generalized Lotka–Volterra model (18, 23, 24) represents a step forward to simulate dynamics via formulating microbial growth rate as a lumped term, but adherence to assumptions of pairwise interactions-driven community dynamics and constant environment limits their predictive power. Genome-scale models (GEMs) (25) provide a valuable resource for studying structured microbial metabolism. With GEMs, microbial metabolic capacity, microbe–microbe interactions (2627–28), microbial–diet interactions (12), and structural changes of two-species cocultures (29) are characterized using flux balance analysis (FBA). With rare exceptions, FBA requires a priori knowledge of metabolite uptake fluxes distributed among community members, with current limitations on these resources, faces challenges with modeling multispecies communities in a dynamic manner (30). Therefore, in adapting a computational framework that can simulate microbiome dynamics along the human gut, one encounters three challenges: 1) endogenously, the intrinsic dynamics not only emerge from the large number of microbiota components but also through the intricate and dynamic ways they interact (31, 32); 2) exogenously, the microbiota is exposed to a series of host–microbe metabolic axes (33), such as colonic physical forces (34), nascent colonization, and nutrient conditions; and 3) spatial structure of the in vivo microbiota localization plays a significant role impacting 1 and 2 (24).
Here, we bridge the current theoretical gap by developing a multiscale framework for COmputing the DYnamics of gut microbiota (CODY), which enables identification and quantification of spatiotemporal-specific variations of gut microbiome absolute and relative abundance profiles, without a prior knowledge of microbiome interactions. We evaluated CODY’s performance by comparing model simulations with longitudinal changes in the microbial composition in fecal samples and in plasma metabolomics of two cohorts: 1) long-term development of the gut microbiome in early infancy and 2) short-term variation patterns of the gut microbiome in obese adults experiencing diet intervention. Comparison of model simulations with experimental data demonstrated predictive strength of the CODY modeling framework and hence lays the foundation for performing design of microbiome-directed therapeutics or of precision nutrition based on CODY simulations. The source code of CODY is freely available together with full documentation at https://github.com/JunGeng-Sysbio-Chalmers/CODY1.0_SourceCode.
CODY is constructed relying on three multiscale modeling components that describe the species-level bacterial dynamics, higher-order microbial interactions, and colon physiology (Fig. 1; abbreviations are listed in SI Appendix, Table S1). A smaller-scale ecosystem representing the dominant microbial species is identified to perform CODY, following the typical way to reduce the high-dimension complexity of gut microbiota (12, 14). The first modeling component of CODY, namely, enzyme-centric metabolic framework (termed ECMF), is developed to characterize the dynamic metabolism for each species in the identified ecosystem (SI Appendix, Supplementary Method 1). The key concept of the ECMF framework relies on the “hybrid cybernetic” perspective (353637–38), which is achieved through two operations. First, we decomposed GEMs (SI Appendix, Table S2) to a unique set of feasible metabolic pathway modules (MPMs; Datasets S1–S8) using elementary flux modes and yield analysis (39, 40). The MPMs thus represented condensed metabolic pathways that transformed specific substrates to end products. Second, the regulation process, i.e., a distinct aspect of metabolism (41), was incorporated into ECMF, which endows the microbes to use different MPMs at different conditions. This is achieved by preferential controls on the levels and activities (i.e., u and v in Fig. 1A) of enzymes that catalyze the metabolic transformations. Hereby the uptake flux of microbes (Fig. 1A) could be viewed as being optimally distributed among MPMs in a regulated way. With the identified kinetic parameters, ECMF enables us to predict the dynamic substrate uptake of microbes, metabolic profiles of growth, and production of key metabolites. As ECMF enables dynamic use of different metabolic pathways that can resemble the metabolic capacity, it is different from constraint-based models that only used one metabolic mode represented by the objective function (30). Using ECMF, microbial adaptiveness and robustness are derived for the microbial system in response to diverse environmental changes. The reliance on enzyme-centric control renders ECMF to capture specific uptake rate as weighted sum of the corresponding time-specific uptake rates of MPMs, and this relieves the necessity of a priori knowledge on substrate uptake rates.

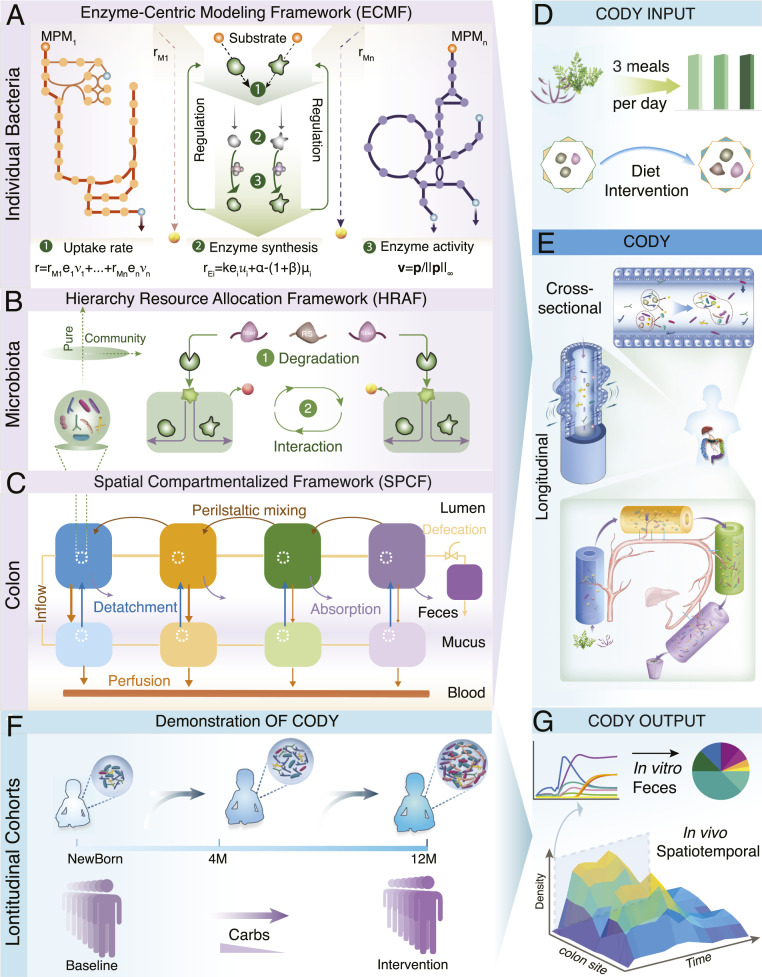
Pipeline paradigm of the multiscale framework for COmputing the DYnamics of microbiota (CODY). (A) Schematic of the ECMF for modeling the dynamic growth of individual bacterial (SI Appendix, Supplementary Method 1). Two components of ECMF include metabolism and regulatory processes. A repertoire of MPMs, MPM1 to MPMn, are used to represent bacterial metabolism. These are derived from genome-scale metabolite models. The regulatory process is shown as central green top-down arrows. Kinetic uptake rate of MPMi is shown as by which substrate is converted to products depending on the amount of enzyme assigned to the corresponding MPMi. In the temporal scale, the total uptake rate is distributed among all MPMs in a regulated way (equation 1). Regulation is incorporated by the control variable , which determines enzyme synthesis rate ( in equation 2) and hereby impacts enzyme concentration (), and by the control variable ( in equation 3), which regulates the uptake fluxes (). (B) Illustration of the HRAF for modeling dynamic metabolic behavior of a microbiota community (SI Appendix, Supplementary Method 2). Two interactive levels are shown, i.e., diet-derived microbial-accessible carbohydrate degradation (1) and microbial-microbial interactions (2), with dynamic bacterial biology characterized using ECMF. (C) Schematics of SPCF for biomimetically modeling the colon physiology, including cross-sectional structure with multilayer, water, and metabolite absorption and longitudinal peristalsis movement (SI Appendix, Supplementary Method 3). (D) Daily meals were translated as diet inputs to CODY. (E) Illustration of assembly of the three multiscale frameworks into CODY (SI Appendix, Supplementary Method 8). The nine regions of site-specific residence of the gut microbiota are shown by SPCF, which captures the structure and physiology of the colon. In each region of both longitudinal and cross-sectional directions the intrinsic dynamics of gut microbiota is characterized by microbial–microbial interactions and individual metabolism and impacted by specific colon physiological forces. (F) Evaluation of CODY prediction capacity by demonstrating two longitudinal clinical cohorts involving diet-intervention strategies. The first study involved a long-term gut microbiota dynamic development of Swedish children during early infancy, from neonate to colonization under breastmilk feeding. Afterward, the gut microbiota continued to develop until maturation at 12 mo, when the diet shifted to solid food. The second study involved a short-term gut microbiome dynamic development in response to diet intervention, where obese adults with hepatic steatosis experienced carbohydrate restriction for 14 d. (G) CODY enables predictions on the spatiotemporal dynamic variations of in vivo gut microbiota, in vitro microbiota composition in the feces, and associated metabolite changes.
Higher-order interactions are known to determine microbiota stability and community functions (31). Lacking a priori knowledge on interspecies interaction is a major hurdle for performing quantitative characterization of the emerging behavior of microbial consortia (42). To address this, we develop a hierarchical resource allocation framework (HRAF; SI Appendix, Supplementary Method 2) that combines an additional layer of dietary carbohydrate degradation with the dynamic microbial–microbial interactions through exchanging the common small molecules within the shared environment. Taken together, HRAF performs iterative multidimension resource allocation, resulting in calculation of uptake fluxes for each microbe in response to local environment changes (Fig. 1B).
The last modeling component in CODY is a spatial compartmentalized framework (SPCF; SI Appendix, Supplementary Method 3). Since the human large intestine hosts a large amount of bacteria that ferment indigestible dietary components escaping the stomach and small intestine, we sought to biomimetically characterize the structure and physical forces in both longitudinal and cross-sectional directions of the colon. Given that the human colon has an inverted U shape comprising four segments, the biogeographic-specific microbiota residence in the gut was represented by four connected regions of two parallel compartments, i.e., four regions for the lumen compartment and four regions for the mucus compartment. By employing the tank-in-series model concept, the metabolite exchange between different regions in the lumen compartment and from each region of the lumen compartment to the stagnant mucus compartment can be described. A ninth region of the model was added to represent rectum and feces storage, and this region was modeled as a fed-batch reactor that is emptied in connection with the defecation process (Fig. 1C and SI Appendix, Supplementary Method 3). Mass transport due to colon hydrodynamics was incorporated into SPCF by considering three major physical forces, i.e., peristaltic mixing, water absorption, and microbe detachment. Incorporation of a blood circulation system further enabled quantification of how microbial variations impact host metabolism via key microbial-specific metabolites. The SPCF model contains a total of 29 parameters that all have physiological meanings, and the values of the parameters could be obtained from literature describing colon anatomy and physiology.
The step-by-step CODY workflow is described in detail in SI Appendix, Fig. S1. With defined composition and frequency of specific dietary inputs (Fig. 1D), CODY was assembled by integrating microbiota dynamics described by ECMF and HRAF into the colon environment described by SPCF (Fig. 1E). We wanted to use CODY to predict the in vivo and in vitro spatiotemporal dynamics of the human gut microbiota (Fig. 1 F and G) for two longitudinal cohorts, i.e., healthy infants and obese adults. However, first we evaluated the individual modeling components separately.
First, we evaluated the ECMF for monocultures of the representatives of microbial ecosystem members that are also in vitro culturable, i.e., Bacteroides thetaiotaomicron (Bth), Bacteroides fragilis (Bfr), Bifidobacterium longum (Blg), Bifidobacterium breve (Bbv), Bifidobacterium adolescentis (Bad), Eubacterium hallii (Ehal), Faecalibacterium prausnitzii (Fpr), and Roseburia intestinalis (Rint) (SI Appendix, Supplementary Method 4). These species were selected to represent the gut microbiota in a cohort of Swedish children following three criteria: 1) They represent not only the most abundant species, but also all members of the dominant phyla; 2) the main metabolic capacity should be well characterized, which thus allowed us to investigate how microbial variations affect host metabolism; and 3) the effect of other community members should also be taken into account by a scaling process. The detailed process is described in SI Appendix, Supplementary Method 4 and Fig. S1B. Employing ECMF operations, the dynamics of each microbial ecosystem member was characterized. Experimental metabolite profiles at 0 h were taken as the initial condition, by which ECMF enables us to simulate subsequent time-coursed metabolic profiles. The kinetic parameters for each microbial ecosystem member were estimated (∼10 on average), by minimizing the sum of squares of residuals between model simulations and experimental data (Datasets S9 and S10). We evaluated the ECMF performance using coefficient of determination (R2) between model simulation results and in vitro experimental data (SI Appendix, Table S3), showing ∼95% of experimental data could be explained by our model (SI Appendix, Fig. S2). To examine the robustness of the ECMF simulation we performed a sensitivity analysis and found that the model simulations are relatively invariant to small variations of the kinetic parameters (5%) (SI Appendix, Fig. S3). ECMF simulations also suggested that these representatives can resemble key metabolic features of the gut microbiota (SI Appendix, Table S4); e.g., acetate is produced by Bacteroides and Bifidobacterium, succinate and propionate are produced by Bacteroides, and butyrate is produced by Firmicutes (SI Appendix, Fig. S4).
Next, we evaluated HRAF with a two-species coculture, Bth and Bad, employing a reference dataset (43). ECMF accounting for multiple substrate usage for these two species was first developed and evaluated (SI Appendix, Supplementary Method 5 and Table S5). Model simulation results showed that ECMF captured the metabolic shifts among multiple substrates (R2 ranging from 0.94 to 0.98; SI Appendix, Fig. S5). With the identified parameters and using the coculture metabolite profiles at 0 h (from the same dataset) as model input, HRAF predictions associated with dynamic nutrient utilization profiles, total microbial density profiles were compared with the in vitro reference dataset, and the accuracy was measured by the determination of coefficient of R2 (0.89, as shown in Fig. 2A). Similarly, the model predictions on dynamic microbial metabolite production profiles could be achieved with R2 of 0.95 (Fig. 2B). More importantly, HRAF enabled quantitative predictions of time-coursed contributions of individual bacteria to the coculture and the interspecies interactions, consistent with the measurement of qPCR data from the same dataset (R2 of 0.93), as shown in Fig. 2C. This clearly demonstrates the predictive strength of the HRAF as all kinetic data were obtained from the individual bacterial models.
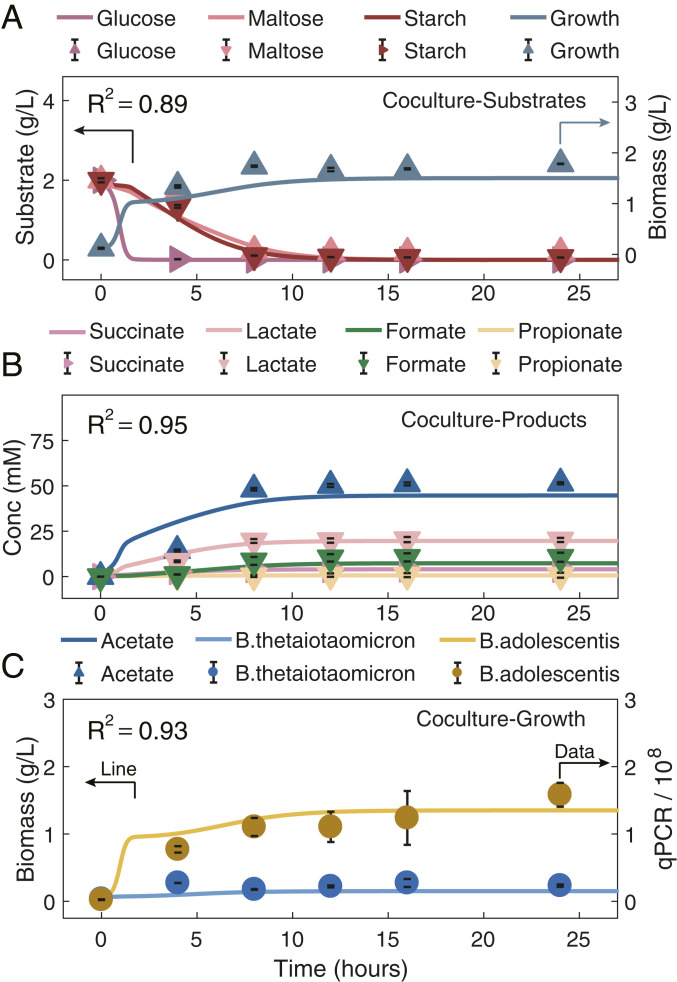
Evaluation of HRAF prediction capacity in characterizing dynamic microbial–microbial interactions and growth dynamics of the synthetic microbial coculture, through comparing pure model predictions on dynamic nutrient utilization profiles, dynamic growth profiles, and microbial–microbial interaction profiles of the two-species coculture with experimental data. Evaluation of HRAF’s prediction capacity in characterizing the dynamic nutrient profiles (A), dynamic growth profiles (B), and individual microbial growth capacity of a two-species cocultures, i.e., Bth and Bad, with the use of an experimental dataset (C). In each panel, the HRAF prediction results are shown as solid lines, and experimental data are shown as symbols. Different microbial-associated metabolite and growth profiles are denoted by specific colors presented above each panel. A shows the comparison results between the HRAF predictions on the dynamic growth profiles and utilization profiles of three substrates, glucose, maltose, and starch, and the experimental dataset for the two-species cocultures. B indicates the comparison results between HRAF predictions and experimental dataset on associated dynamic metabolite profiles for the two-species cocultures. C exhibits the comparison results between HRAF predictions and experimental data on individual microbial growth profiles of the two-species coculture. The comparison results between model predictions and experimental data are evaluated and measured by the coefficient of determination (R2; the calculation equation can be found in Methods) in each panel ranging from 0.89 to 0.95.
We next applied HRAF to predict ecological interactions between all the species considered in our ecosystem (SI Appendix, Supplementary Method 6 and Dataset S11). To this end, the dynamic behaviors of synthetic cocultivations of two-species coculture were predicted adopting the HRAF framework, for all possible pairwise combinations from the representative ecosystem members. The predicted growth rates in coculture conditions of each combination were compared to those obtained for monoculture conditions to calculate an interaction index (SI Appendix, Fig. S6). In total, 21 out of 28 pairs were predicted to compete (−/−) with each other due to nutrient requirement overlap, supporting the notion that competition is the prevalent interaction in microbial ecosystems (24, 44). For example, competitions were predicted between members of Bacteroides and Bifidobacterium groups, consistent with previous reports (45, 46). Moreover, the outcompeting capacity of Bacteroides to Roseburia was predicted from our results and agrees well with literature reports (47, 48). Prediction of commensalism (+/0) interaction between Bifidobacterium and Eubacterium mediated through cross-talking via lactate was also consistent with literature reports (4950–51). Acetate-mediated cross-feeding between Bacteroides and Eubacterium has also been reported (52). These results confirm that HRAF provides a generalized approach to capture the indigenous microbial dynamics and enables investigation of system-level interspecies interactions.
To evaluate the feasibility of SPCF (SI Appendix, Fig. S7) in capturing colonic physiology we compared model simulations with data from the TNO intestine model (TIM), a reliable in vitro experimental setup used to simulate colon physiology (53) (SI Appendix, Supplementary Method 7). With identical inflow rate and volume settings, SPCF could predict the spatiotemporal profiles with different nutrition signals as model input (SI Appendix, Figs. S8–S10), and consistent predictions on the outflow rate and transit time with TIM performance could be observed (SI Appendix, Table S6). Additionally, time-coursed SCFA production (SI Appendix, Fig. S11) and composition (SI Appendix, Fig. S12) with four complex carbohydrates by SPCF prediction showed good agreement with measurements from TIM experiments.
To predict the dynamic response of in vivo site-specific gut microbiota to life events such as diet intervention, the three evaluated and functional frameworks were assembled into CODY, by incorporating the microbial ecosystem models (HRAF and ECMF) into the colon model (SPCF). The predictive power of CODY was evaluated by employing it to simulate gut microbiota variations in two clinical studies (11, 54), i.e., a Swedish healthy infant cohort, where neonatal gut microbiota colonized under breastfeeding from newborn to the fourth month and successively maturated toward the 12th month with a diet switched to solid food (54), and the Helsinki obesity adult cohort, where obese individuals were subjected to an isocaloric carbohydrate-restricted diet for 14 d (11) (SI Appendix, Supplementary Method 8).
To model a real-life dietary scenario, we employed different feeding strategies, i.e., with six meals per day for breastfed infants and three meals per day for adults. The amount and composition of diet- and host-derived macronutrients, i.e., human breastmilk oligosaccharides, fiber, resistant starch, and mucins were determined according to condition-specific cohort (SI Appendix, Table S4) and translated to aggregated microbial-accessible carbohydrates (MACs) as CODY input.
We first demonstrated CODY prediction capacity for the infant cohort. By applying microbial abundance of representatives of the dominant phyla at newborn as the initial condition (baseline) of infant gut microbiota (SI Appendix, Fig. S13) and employing the total amount of MACs fed the gut microbiota dependent on the average breastmilk intake, we sought to simulate the dynamic colonization of infant gut microbiota under the breastmilk-feeding regime (SI Appendix, Figs. S14–S15). The microbial profiles were predicted converging to stable configurations after 12 d. The poststabilized microbial and metabolic profiles were used as the new baseline for subsequent simulations for successive maturation dynamics, under the solid-food regime, which shows converging to a new stability after 25 d. To evaluate its fidelity, CODY predictions of the poststabilized feces-specific microbiota composition at colonization and maturation stages were compared to the reference data taken from the in vitro fecal metagenomics measurements of early infancy, i.e., fourth month and 12th month (Fig. 3A), showing excellent agreement with R2 ranging between 0.83 and 0.96 (SI Appendix, Fig. S16). Moreover, CODY correctly captured the dynamic changes of relative abundance for each microbial member in response to diet switch from breastmilk to solid food, through comparing to that observed from 68 infants (Fig. 3B). For example, the dramatic variations of Blg was accurately predicted, which showed significant increase (P < 10−7, Wilcoxon test) under breastmilk feeding due to the “bifidogenic factor” (55) and significant decrease (P < 10−3, Wilcoxon test) along with diet switch to solid food. Additionally, CODY enabled quantitative predictions of SCFA production over the two periods (Fig. 3C). The poststabilized SCFA levels predicted in the feces compartment show good agreement with age-matched SCFA reports (56). Furthermore, the total SCFA amount (12.02 mmol/d) of predictions in the feces and SCFA alternation predicted in the plasma (SI Appendix, Fig. S17) agrees well with the expected adult level (57, 58).
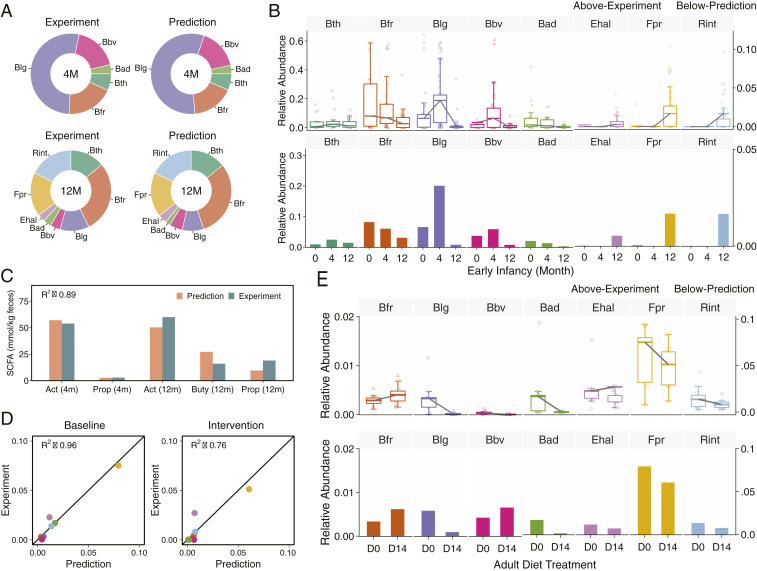
Validation of CODY by comparing model simulation results of the fecal microbiota variations and plasma metabolite changes in response to diet intervention for two cohorts, a Swedish healthy infant cohort during the first year and a Helsinki adult cohort with diet intervention. (A) Evaluation of CODY predictions on fecal microbiota configurations for the infant cohort. Pie charts show the comparison of CODY predictions on fecal microbiome composition to metagenomics measurement of fecal samples (Top) of neonatal infants during breastmilk-feeding period, and that for afterward shifting to solid-food feeding period (Bottom). (B) Evaluation of CODY predictions on dynamic variations of individual bacterium by comparing to experimental data for the infant cohort. Box plots (Top) show the dynamic variations of infant microbiota configurations from newborn (0) to fourth month (4) and then until the 12th month (12), from the metagenomics measurements of 68 infant fecal samples. The data are shown as relative abundance. The dynamic changes for individual bacteria are shown by the gray lines which connect mean relative abundance at the three stages. Bar plots (Bottom) show model simulation results of relative abundance profiles in the feces, obtained by converting CODY predictions on the absolute microbial abundance profiles to relative abundance profiles, which was further scaled by the total proportion of the representative microbial ecosystem. (C) Evaluation of CODY predictions on fecal metabolite changes for the infant cohort. Bar plot shows comparison between model predictions on SCFA profiles in the feces and age-matched reference data taken from the experimental measurements (54), with coefficient of determination (R2) shown for the assessment of explanatory power of model predictions (R2 equation is given in Methods). Orange bars denote predictions and green bars denote experimental data. Metabolite abbreviations: Act, acetate; Buty, butyrate; Prop, propionate; 4m, fourth month; 12m, 12th month. (D) Validation of CODY predictions on microbiota relative abundance for the adult cohort. The coefficient of determination (R2), ranging from 0.76 to 0.96, is shown for the assessment of explanatory power of CODY by comparing to reference data taken from metagenomics measurements (11), at baseline (D0) and intervention (D14) for the obese adult cohort. (E) Evaluation of CODY predictions on the dynamic changes of individual bacteria by comparing to metagenomics profiling of fecal samples for the adult cohort (11). Box plots (Top) show the dynamic variations of adult microbiota bacteria from baseline (D0) to 14 d after diet intervention (D14), from the metagenomics measurements. The dynamic changes for individual bacteria are shown by the gray lines which connect the two different stages. Bar plots show the CODY predictions on the dynamic changes of the individual bacteria.
Next, we demonstrate CODY prediction capacity for a hepatic steatosis adult cohort, where a control and an isocaloric carbohydrate-restricted diet (SI Appendix, Table S4) were used as model input before and after diet intervention. The accuracy of CODY predictions was validated by comparing the model predictions of adult poststabilized microbiota compositions in the feces to reference data from experimental metagenomics measurements, with R2 ranging from 0.76 to 0.96 (Fig. 3D). The accuracy of CODY predictions was further validated by comparing time-coursed dynamic variations for individual bacteria between CODY predictions and experimental data, which exhibited consistent patterns (Fig. 3E). These results evidently presented CODY’s capability to quantify how the microbiota configuration in feces and the plasma levels of SCFA were altered in response to diet-intervention manipulation.
Besides predicting gut microbiota dynamics in feces, CODY also enables insight into the microbiome dynamics along the gut axis, and hence information about how exogenous factors drive in vivo microbiome adaptation and establish stability—which is hardly measurable or predictable.
The prediction results related with the site- and temporal-specific microbiota profiles (SI Appendix, Figs. S18–S22 and Fig. 4A) suggest that phylogenetically related bacteria tend to coevolve together. Among the infant gut microbial ecosystem, Bth and Bfr are found to increase simultaneously when shifting to a solid-food regime (Fig. 4 A and B). Intriguingly, the dynamic trajectories of three Actinobacteria species (Blg, Bad, and Bbr) exhibited concomitant patterns, i.e., increasing in short periods followed by a gradual decrease. Moreover, the concurrent increase of Fpr and Rint resulted in their sequential blooming patterns with the other two phyla. These results support the recent ecological observations in nature, i.e., the phylogenetically more related microbial species tend to co-occur and diverge in different ecological niches (27, 59). Thus, CODY predictions explore the significant effects of diet regime, host physiological factors and spatial structure, which collectively determined the higher-order microbial interactions and further shaped diversification, upon which CODY enables characterizing the in vivo gut microbiota dynamics that cannot be achieved by previous computational-based approaches.
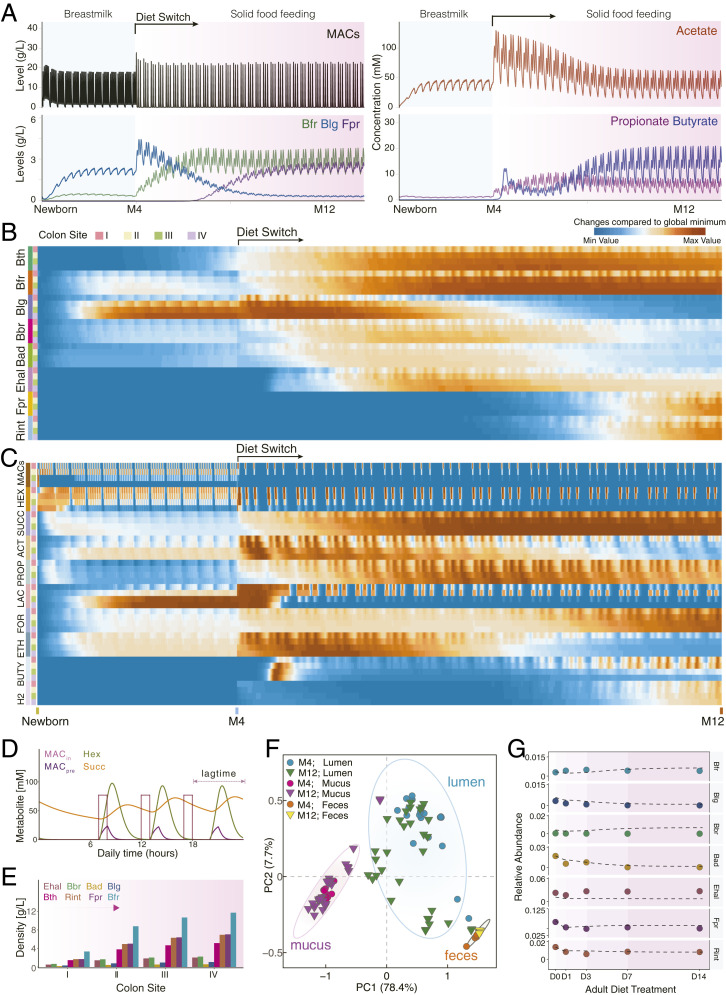
CODY output shows quantitative predictions on how exogenous factors shape dynamic in vivo biogeographic-specific microbial variations within different colon regions, as well as in vitro plasma metabolic shift in response to the diet intervention. (A) Line plot shows the in vivo dynamic profiles of selective species and metabolites (MACs, acetate, butyrate, and propionate) in response to diet switch from breastmilk to solid food in ascending lumen compartment. (B) Heat maps show the biogeographic-specific microbiota changes along longitudinal luminal colon regions from newborn to 12th month. Each four rows denote one bacterium, annotated by colored bars on the left of the heat map. Colon site annotations: I, ascending; II, transverse;, III, descending; IV, sigmoid. (C) Heat maps show the biogeographic specific metabolite changes along longitudinal luminal colon regions. Each four rows denote one metabolite; a total of 10 metabolites are shown. Hex, hexose; Succ, succinate; Act, acetate; Prop, propionate; Lac, lactate; For, formate; Eth, ethanol; Buty, butyrate; H2, hydrogen. (D) Line plots show the CODY output associated with human digestion transit time, as the lag phase shown with time difference between model diet input under real-life scenario (MACin) and model output of selected metabolites in the ascending lumen region (carbohydrate, hexose, and succinate). Metabolite annotation: MACin, diet input; MACpre, model prediction of feeding diet; Hex, hexose; Succ, succinate. (E) Bar plots show CODY output associated with model predictions of biogeographic-specific microbial abundance profiles within the in vitro colon site-specific regions in the longitudinal direction. Model output is shown on the poststabilized microbial configurations during solid-food feeding period. (F) Identification of biogeographic heterogeneity by performing principle component analysis with the hctsa toolbox (SI Appendix, Supplementary Method 9) on the CODY output of model predictions of dynamic microbial abundance profiles that are distributed along the longitudinal direction, i.e., the dynamic development trajectories of microbes residing within the ascending, transverse, sigmoid, and descending colon regions associated with the luminal/mucus compartments, as well as the dynamic microbial development in the feces compartments. (G) Evaluation of CODY output with respect to model predictions on the poststabilized microbial abundance profiles in the feces compartment by comparing model predictions and metagenomics measurements across the time-series scales during short-term diet-restriction treatment for the hepatic steatosis adult patients, i.e., 0, 1, 3, 7, and 14 d after diet intervention. Lines are shown for CODY predictions on the time-coursed microbiota dynamic variations. Symbols are shown for representing metagenomics measurements at 0, 1, 3, 7, and 14 d after diet intervention.
The quantitative predictions on the spatiotemporal-scale microbial (Fig. 4B) abundance profiles and metabolite absolute abundance profiles (Fig. 4C) further allowed insights into how host–microbiota interactions promote stability. Rhythmic oscillation was explored as a distinct pattern among dynamic responses of microbe and metabolite to diet intake at different meal times during the day. Interception of 24-h data on metabolite variations responding to the diet input (Fig. 4D) exhibited a time-coursed lag phase with respect to the longitudinal transportation, further illustrating how CODY can reflect the human digestion transit time. Importantly, the magnitude and absolute levels of oscillated dietary macronutrients, MACs, dampened along the longitudinal colon, rigorously reflecting the in vivo extrinsic constraints imposed by the host capacity during establishment of microbial populations. Hence, the absolute microbial abundances increase longitudinally by twofold in the proximal site, while gradually becoming stable when moving toward the distal regions (Fig. 4E and SI Appendix, Fig. S23A). The prediction results on absolute SCFA abundance profiles showed that SCFA production increased in the proximal colon (70∼220 mmol/kg feces) and decreased in the distal colon due to their continuous absorption into plasma (60∼120 mmol/kg feces) (SI Appendix, Fig. S23B). These results suggested the proximal region as the main fermentation site, consistent with physiological studies (60, 61). Thus, by incorporating host physiology factors mimicking the colon function, CODY enables mechanistic envision of how individual-based microbiota development is determined, as well as emergent stability is promoted.
To obtain further insights into the biogeography of microbiota dynamics and spatiotemporal variations, we employed the hctsa toolbox (62) to hierarchically cluster (SI Appendix, Supplementary Method 9) the dynamic trajectories of each of the representative microbial ecosystem members residing in the site-specific regions of colon in both the longitudinal and cross-sectional directions (SI Appendix, Fig. S24). The time-coursed microbial abundance profiles with respect to different colonic sites were mapped into three distinct clusters (Fig. 4F) corresponding to lumen, mucus, or feces, respectively, strongly suggesting biogeographical heterogeneity of the microbiota in the colon. Furthermore, the dominant features that significantly classified the three clusters (adjusted P < 10−10; SI Appendix, Fig. S25) were identified as being linked to stationary property (SI Appendix, Table S8), illustrating that mucus was less impacted than lumen by the physical forces. This could be inferred by less mobility in the mucus membrane structure. Spatial structure was then envisaged as a potential route to promote stability, especially for those bacteria that cannot counteract the flow rate due to poor growth, which were instead rescued from extinction through replenishing from the mucus layer.
CODY is a dynamic framework adopting a bottom-up modeling approach that establishes the dynamic interface upon which intrinsic dynamics of microbiota ecosystem adapt to extrinsic host impacts and environment perturbations (e.g., diet intervention), through comprehensively integrating multidimensional frameworks. CODY serves as a computational instrument to quantitatively visualize spatiotemporal microbial absolute abundances profiles and response to perturbations, across biogeographic-specific regions in the gut, which is impractical to observe in vivo. Evidently, incorporation of feces and plasma compartments allows for evaluating CODY predictions on consequential changes in fecal microbial abundance profiles and plasma metabolites for two cross-sectional cohort datasets, which confirms the predictive power and hence utility of CODY in facilitating clinical diagnosis.
CODY provides a computational platform to quantify how nutritional and host factors shape microbial–microbial interactions and thus landscape development of the gut microbiota ecosystem. A first step toward this endeavor (12) provided statistic predictions of a diet modulation effect based upon a constraint-based approach, with predefined objective function and a priori knowledge of community-level flux distribution. Since the predefined exchange flux distribution and community-level objective function are usually impractical to obtain in vivo, the computational platform proposed here removes the necessity of acquisition of associated knowledge, thus facilitating the potential to investigate higher-order microbial interactions (63), as can be seen from the metabolic shift among multiple substrates, which is accurately predicted for the consortia. This represents an advancement compared with other computational methods such as the Computation of Microbial Ecosystems in Time and Space (COMET) approach that solely relies on FBA (32). This offers new opportunities for quantifying condition-dependent ecological niches and exploring how microbiota variations in the gut impact human physiology. For example, as can be seen from CODY predictions on microbial profiles for the obese adult cohort, the in vivo variation patterns among three actinobacteria, Blg, Bbv, and Bad, follow an asynchronous trend (SI Appendix, Figs. S26–S28). Moreover, our approach points to the possibility to understand mechanisms by which the microbial ecosystem respond to exogenous perturbations. Different numbers of microbial species used for demonstration of two cohorts suggest the promising future of expanding CODY to study restoration of gut microbiota through introduction of novel probiotics or removal of specific species, and how diversity, stability, and resilience of microbial ecosystem are fostered (2). Although a limited number of species are employed in the current format of framework, the conceptual framework itself is scalable and we foresee more species would be integrated when data from more culturable gut microbiota species become available.
The robustness of CODY in characterizing the spatiotemporal microbial variations and its flexibility can be assessed by comparison of model predictions with metagenomics microbial relative abundance profiles of two clinical cohort studies with distinct phenotypes. Despite the advancement of sequence-based approaches, profiling microbial structure as fractions of sequence library ignored the overall microbiota abundance itself, which could be a key indicator of specific disease (17). One compelling application of CODY relied on the advancement in predictions of spatiotemporal absolute abundance profiles in the gut. For example, CODY not only accurately predicts the decreased relative abundance of Bth and Bfr from the fourth month to the 12th month that is consistent with other infant studies (10) but also predicts their increased absolute abundance due to diet intake increase (SI Appendix, Fig. S14). CODY could also be used to simulate variations among individuals in a cohort, but this would require information about dietary intake for the individuals, and as we did not have this information for the studied cohorts we did not exploit this further. The ability of CODY to predict absolute changes of microbial and SCFA profiles along the longitudinal colon sites is an additional strength of the modeling framework. Together with incorporation of colon spatial heterogeneity, CODY provides insights into how distinct patterns of time-coursed microbiota profiles develop in the lumen and mucus in response to probiotics intervention, which could potentially promote the development of metabolic diseases treatment (64).
As a proof of concept, we employed CODY to predict the in vitro microbiota changes for the hepatic steatosis adults and compared model predictions with time-coursed measurements of fecal samples, at 0, 1, 3, 7, and 14 d after diet intervention (Fig. 4G). Consistently, we found the decrease of Blg, Bbr, Bad, Rint, and Fpr and increase of Bacteroides agree well with the marked microbiota variations that contribute to liver metabolism improvement of the hepatic steatosis patients via diet intervention. Consequent changes on fecal SCFA are predicted coincidently with the recent reports (8). In addition, CODY’s predictions on changes in the plasma concentration of SCFAs (SI Appendix, Fig. S29) further assisted prognosis. The consistency between CODY predictions and experimental observations for the adult cohort possessing a microbial ecosystem structure very different from that of the infant cohort demonstrates the promising scalability of CODY in enabling simulation of various scenarios.
Collectively, CODY can be readily applied to explore and visualize biogeographic-specific long-term and short-term patterns of microbial responses, upon defined diet-intervention strategies (https://github.com/JunGeng-Sysbio-Chalmers/CODY), and thus investigate precision-nutrition outcomes. Quantitative understanding of physiological and environmental factors determined absolute microbial activities at longitudinal and site-specific scales broaden its utility for designing strategies that will ensure stable colonization of desired probiotics, and hereby points to its utility in facilitating the advancement of precision medicine.
Details on methods and collection of data used in this study are provided in SI Appendix, but a brief summary is provided below.
The colon hydrodynamic environment where the gut microbiota resides was described by an SPCF which accounts for the colon structure and physical forces in axial and cross-sectional directions (SI Appendix, Supplementary Method 3). All SPCF parameters were determined based on literature-based knowledge of the colon physiology. The gut microbial ecosystem was described by eight bacteria that reside within each region of the colon compartment. The intrinsic dynamics of the gut microbial ecosystem was described by an HRAF (SI Appendix, Supplementary Method 2) and an ECMF (SI Appendix, Supplementary Method 1). The governing system equations of the microbes and metabolites in CODY were described as follows:
where k and t denote the position of colon and simulation time. denotes the state variable of dynamic profiles for Jth member of microbiota ecosystem in kth site-specific region. denotes the state variable of dynamic profiles of ith metabolite in kth site-specific region. denotes tank volume of kth site-specific lumen region. and are to-and-from bulk flows for the kth lumen region site. The back flow due to axial back-mixing in the kth lumen region site is indicated as . represents mass transfer coefficient between lumen and mucus. and represent the state variable of dynamic profiles for ith metabolite associated with the microbiota ecosystem. and denote the stoichiometric matrix related with MPMs of the Jth member of microbiota ecosystem. represents the regulated kinetic uptake rate vector of the Jth member of microbiota ecosystem in the kth site-specific region, which is dependent on the metabolite vector of . The symbol “” represents the gradient between microbial ecosystem members residing in mucus and lumen compartments through mucus associated bacterial detachment. Thus, the first term in both equations denotes luminal flow that is described by the convection effect, the second term denotes effective peristaltic movement that is described by a back-mixing effect, the third term denotes the microbial dynamics that is collectively contributed by all ecosystem members (J = 1, … N, with n = 8 in this context). The “+” sign before the third term is applied due to the net effect of microbial growth/metabolic production has been incorporated into the stoichiometric matrix of . The last term in Eq. 1 denotes the cross-talk between mucus and lumen compartments via detachment. The last term in Eq. 2 denotes the perfusion effect in the cross-sectional direction of colon, via mass transport between lumen and mucus compartment, or between mucus and blood compartment. The system-level overall equations are detailed as SI Appendix, Eqs. 16–36.
Experimental data for evaluation of both ECMF and HRAF were collected from the literature (SI Appendix, Table S2). For ECMF evaluation, datasets were taken from monoculture experiments involving monosubstrate as the main carbon source. For Bth, Bfr, Blg, Bbv, and Bad, time-series experimental data for each species were obtained with hexose as the carbon source. Data for Ehal were based on using both acetate and lactate as carbon sources. For Fpr and Rint, the experimental data were obtained using hexose and acetate as carbon sources. For evaluation of HRAF, experimental data were taken from published data that involved multiple carbon sources. More detailed description of each experimental dataset used for evaluation of model simulations is provided in SI Appendix, Supplementary Method 4.
The dynamic ECMF for the eight bacteria was evaluated employing experimental fermentation data from various literature reports (SI Appendix, Table S3). To evaluate how HRAF could predict a two-species consortium, we employed a published experimental dataset (SI Appendix, Table S3), which comprised both time-series fermentation data of the monoculture and similar data from a coculture using three different carbohydrates. To evaluate HRAF in predicting pairwise interactions, kinetic parameters for the eight species determined from their ECMF were adopted for each species. Initial substrate concentrations were normalized to be at the same level. Monoculture simulations were performed for each species and used as reference. Coculture simulations were performed and compared to the monocultures to calculate the interaction index, following SI Appendix, Eq. 37. Both monoculture and coculture data are shown in Dataset S11. SPCF was evaluated by using TIM observations, both for reported colon transit time and short-chain fatty acid production observed from TIM experiments.
To evaluate CODY two clinical studies, one involving an infant cohort and the other involving and obese adult cohort (SI Appendix, Supplementary Method 8), were used. Evaluation was done by comparing model simulations with the two longitudinal metagenomics datasets measured from fecal samples (SI Appendix, Table S3).
Data points shown in Fig. 3 B and E use relative abundance data, which were obtained by normalizing the metagenomics measurements for each sample, based on the published data (SI Appendix, Table S3). The initial condition of the microbial ecosystem was considered as the same configurations as the baseline condition, i.e., newborn fecal composition was used for the infant cohort and baseline composition profiles were used for the adult cohort. The presented microbial relative abundance profiles in Fig. 3 were calculated based on model prediction results on the absolute microbial abundances, which were further scaled by the total proportion of the smaller scale ecosystem following SI Appendix, Eq. 45.
We thank Professor Fredrik Bäckhed for his many valuable comments on our work and our paper. We thank Professor Jan Borén for providing the dataset for the adult cohort. We thank Hao Wu, Filip Buric, Iván Domenzain, and Yu Chen for their valuable discussions and suggestions. This work was supported by the Bill & Melinda Gates Foundation, the Novo Nordisk Foundation (Grants NNF10CC1016517 and NNF15OC0016798), and the Knut and Alice Wallenberg Foundation.
All three frameworks (i.e., ECMF, HRAF, and SPCF) were developed with MATLAB 2016b. The construction process of ECMF involves the software package of Metatool (https://pinguin.biologie.uni-jena.de/bioinformatik/networks/metatool). The coefficient of determination (i.e., R2) was calculated based on its definition (i.e., ). All predictions of dynamic microbiota reprogramming for the infant and adult cohort were performed with MATLAB 2016b. The results were visualized using MATLAB 2016b, R (v3.5.1), and RStudio (v1.1.442). All source codes are freely available at https://github.com/JunGeng-Sysbio-Chalmers/CODY1.0_SourceCode. The toolbox package can be accessed at https://github.com/JunGeng-Sysbio-Chalmers/CODY. All other study data are included in the article and/or supporting information.
1
2
3
4
5
6
7
8
9
10
11
12
13
14
15
16
17
18
19
20
21
22
23
24
25
26
27
28
29
30
31
32
34
35
36
37
38
39
40
41
42
43
44
45
46
47
48
49
50
51
52
53
54
55
56
57
58
59
60
61
62
63
 CODY enables quantitatively spatiotemporal predictions on in vivo gut microbial variability induced by diet intervention
 Facebook
 Twitter
 Linkedin
 Whatsapp

