
 ,
Jesús J. Bosque,
David Molina-García,
Álvaro Martínez,
Julián Pérez-Beteta,
Gabriel F. Calvo,
Víctor M. Pérez-García
,
Jesús J. Bosque,
David Molina-García,
Álvaro Martínez,
Julián Pérez-Beteta,
Gabriel F. Calvo,
Víctor M. Pérez-García
Edited by Michael E. Phelps, University of California, Los Angeles School of Medicine, Los Angeles, CA, and approved January 4, 2021 (received for review August 26, 2020)
Author contributions: G.F.C. and V.M.P.-G. designed research; J.J.-S., J.J.B., D.M.-G., Á.M., C.O.-S., and G.F.C. performed research; J.J.-S., J.J.B., G.A.J.L., D.M.-G., Á.M., J.P.-B., A.F.H.M., A.M.G.V., G.F.C., and V.M.P.-G. analyzed data; J.J.-S., J.J.B., G.F.C., and V.M.P.-G. wrote the paper; and G.A.J.L., J.P.-B., A.F.H.M., A.M.G.V., and V.M.P.-G. collected and processed the data and analyzed the medical implications.
1J.J.-S. and J.J.B. contributed equally to this work.
2G.F.C. and V.M.P.-G. contributed equally to this work.
Through the use of different in silico modeling approaches capturing tumor heterogeneity, we postulated that areas of high metabolic activity would shift toward the periphery as tumors become more aggressive. To confirm the hypothesis and provide clinical value for the finding, we collected 18F-FDG PET images of breast cancers and non–small-cell lung cancers, where we measured the distance from the point of maximum activity to the tumor centroid, normalizing it by a surrogate of the volume. The metric, NHOC, showed higher prognostic value than other classical PET-based metabolic biomarkers used in oncology, evidencing that the shift of the hotspot of activity from the center of the tumor to its periphery correlates with a poor prognosis.
Human cancers are biologically and morphologically heterogeneous. A variety of clonal populations emerge within these neoplasms and their interaction leads to complex spatiotemporal dynamics during tumor growth. We studied the reshaping of metabolic activity in human cancers by means of continuous and discrete mathematical models and matched the results to positron emission tomography (PET) imaging data. Our models revealed that the location of increasingly active proliferative cellular spots progressively drifted from the center of the tumor to the periphery, as a result of the competition between gradually more aggressive phenotypes. This computational finding led to the development of a metric, normalized distance from 18F-fluorodeoxyglucose (18F-FDG) hotspot to centroid (NHOC), based on the separation from the location of the activity (proliferation) hotspot to the tumor centroid. The NHOC metric can be computed for patients using 18F-FDG PET–computed tomography (PET/CT) images where the voxel of maximum uptake (standardized uptake value [SUV]max) is taken as the activity hotspot. Two datasets of 18F-FDG PET/CT images were collected, one from 61 breast cancer patients and another from 161 non–small-cell lung cancer patients. In both cohorts, survival analyses were carried out for the NHOC and for other classical PET/CT-based biomarkers, finding that the former had a high prognostic value, outperforming the latter. In summary, our work offers additional insights into the evolutionary mechanisms behind tumor progression, provides a different PET/CT-based biomarker, and reveals that an activity hotspot closer to the tumor periphery is associated to a worst patient outcome.
Human cancers are genetically and morphologically heterogeneous (1, 2). This is generally attributed to the evolutionary dynamics of different clonal cell populations coexisting in the tumor ecosystem and undergoing stochastic branching processes over time (34–5). Successively acquired driver mutations, somatic alterations, and nongenetic modifications may confer increased fitness on certain cancer cell phenotypes, which subsequently outcompete those that do not experience such selection benefits within their microenvironment (4, 6, 7). Cells with specific advantageous traits may not show uniform spatial distribution across the tumor, particularly in large tumors. In fact, trade-offs exist that preclude the occurrence of optimal phenotypes, as exemplified by the hallmarks of cancer (8), and thus only local selection is expected to take place. This produces the spatial phenotypic diversity found in primary tumors and distant metastases (9).
Sustained metabolic reorganization during tumor progression, due to bioenergetically very demanding processes such as rapid proliferation, is a major hallmark of cancer (8, 10). This gives rise to a global metabolic plasticity and fitness optimization that confers evolutionary advantages under specific selective pressures, such as hypoxia (11). Positron emission tomography (PET) has been proposed as a way to assess macroscopic tumor heterogeneity in human patients (12). The technique is used in clinical practice with the radiotracer 18F-fluorodeoxyglucose (18F-FDG) (13), which is an analog of glucose and thus a marker of glycolysis (14). The altered tumor metabolism leads to an up-regulation of glycolysis and an increase in glucose consumption (15). This happens even in the presence of oxygen and is referred to as the Warburg effect. Even though this process is energetically inefficient (16), cancer cells may find it beneficial to satisfy the biomass demands required by their high proliferation rates (17). This is confirmed by studies that relate the uptake of 18F-FDG in PET images to proliferation markers (18, 19). Therefore, the spatial map of glucose consumption provided by 18F-FDG PET images, as measured at each voxel by the standardized uptake value (SUV), is of great utility in portraying the spatial distribution of proliferation within the tumor.
The degree and impact of intertumor diversity and intratumor heterogeneity in patients has driven the need for quantitative frameworks to account for this variability (20). We considered how the metabolic activity might be distributed inside the tumor and how that information could be related to 18F-FDG PET images. Specifically, we looked at whether the location of prominent proliferation hotspots, as measured by the voxel of maximum radiotracer uptake (SUVmax), could convey information about patient prognosis. We did this by analyzing how these spots changed over time and space within the tumor in silico using two mathematical models of different levels of complexity. The implications of these results, embodied in the definition of a prognostic biomarker named NHOC, were tested on datasets of breast and lung cancer patients.
To describe the emergence of metabolic heterogeneity, we studied in silico a simple biological scenario assuming the tumor to be composed of a clonal population of cells that can migrate, proliferate until the physical space is full, and die. To account for phenotypic heterogeneity, a transition probability that a cell proliferating at a rate could increase or decrease its rate was introduced. The mathematical model used was a continuous nonlocal Fisher–Kolmogorov-type equation (21) which considered the tumor cell population to be structured both by a spatial position vector , inside a domain , and a proliferation rate , where is a maximum proliferation rate. Let denote the cell density function, such that represents the number of tumor cells that, at time , have a proliferation rate at point . We modeled the dynamics of via the following migration–proliferation integro-differential equation:
A number of quantities are useful for summarizing the information contained in Eq. 1. The first one is the marginal cell density , with typical radially symmetric profiles as shown in Fig. 1A. The second one is the proliferation density (Eq. 9 in Materials and Methods), which gives the spatiotemporal proliferation map and allows the tumor regions with high metabolic activity to be identified. Fig. 1B depicts and shows how the location of the highest activity shifts from the tumor centroid toward the boundary as it grows in silico. This observed displacement, which was found to be linear with time, was quantified using two metrics. The first one was the distance from the highest activity, corresponding to the point of maximum proliferation, to the tumor centroid. We named this metric the distance from the metabolic hotspot to the tumor centroid (HOC). To make HOC independent of size, so that it can be compared among different tumors, we conceived a second metric, normalized HOC (NHOC), defined as the ratio between HOC and the mean metabolic radius of the tumor, (Fig. 1C and Eq. 10 in Materials and Methods). Simulations of Eq. 1 showed that, during the early stages of the natural history of the tumor, the metric HOC was found to be zero or very small. However, as the inner regions were filled with cells, HOC increased linearly with time (Fig. 1D). NHOC changed steadily from zero to one, since the maximum proliferation spot can only occur between the tumor center and its edge, indicating that this spot will move from the central regions of the tumor to its boundaries (Fig. 1 D, Inset).

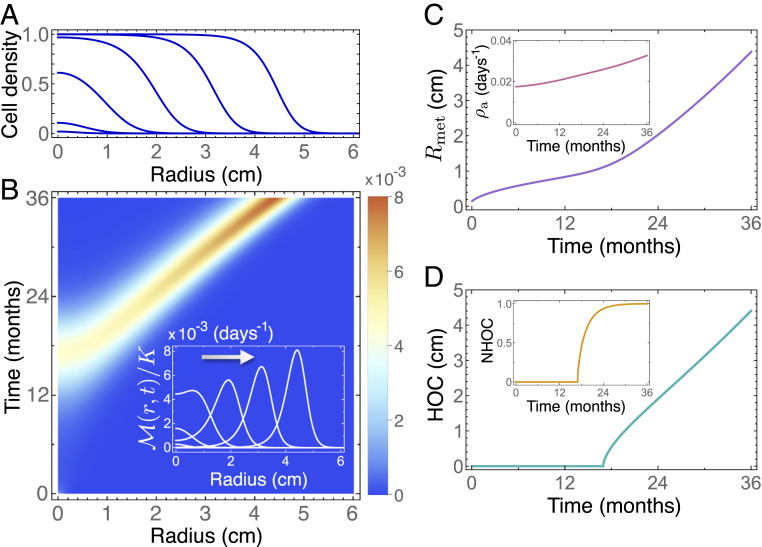
Nonlocal Fisher–Kolmogorov model 1 predicts a drift of the highest metabolic activity from the tumor centroid to the periphery with time. (A) Normalized cell density at 6, 12, 18, 24, 30, and 36 mo (from left to right) for a radially symmetric tumor. (B) Pseudocolor plots of the normalized spatiotemporal proliferation density and profiles (Inset) of calculated at 6, 12, 18, 24, 30, and 36 mo. (C) Mean metabolic radius and (Inset) average proliferation rate . (D) Variation over time of the distance from the tumor centroid to the hotspot of proliferation (HOC) and (Inset) normalized HOC by the mean metabolic radius (NHOC). Simulation parameters are listed in Materials and Methods.
The simulations of Eq. 1 revealed other noteworthy effects. First, the amplitude of the maximum activity in grew with time, meaning that tumors at later stages of their evolutionary history show increasing hotspot activity values. This was in line with the frequently observed association between SUVmax and prognosis for different tumor histologies (22, 23). Second, the distribution of the proliferation rates displayed sustained growth toward higher values of , reflected in the average proliferation rate (Fig. 1 C, Inset). The growth of the tumor proliferation rate with time (size) has been experimentally observed in other studies (24).
We next resorted to a more complex and realistic biological scenario accounting for genotypic alterations. We did this by considering a stochastic discrete model based on fundamental cell features. At the cellular level, cancer cells can be characterized by four deregulated processes: proliferation, migration, mutation, and death. These processes can be easily implemented as rules in a discrete mathematical model to mimic the main characteristics of the real system, with the drawback of facing high computational cost, especially when simulating clinically relevant volumes (25). To overcome this problem, we developed a hybrid stochastic mesoscale model of tumor growth that allowed clinically relevant tumor sizes to be simulated while retaining the basic cancer hallmarks (24).
The model was parameterized for two of the most prominent cancer types, namely breast and lung cancer (non–small-cell lung carcinoma [NSCLC]). A summary of our available data can be seen in Table 1. Mutational landscapes were constructed based on a simplification of their known mutational spectra. Alterations in EGFR and ALK, which are strongly associated with nonsquamous lung adenocarcinoma, were considered to model NSCLC, while driver mutations in PIK3CA and TP53 were considered for breast cancer (262728–29). Therefore, the mutational tree in both types of tumors simulated had two possible altered genes, leading to four possible combinations or “genotypes” that define four different clonal populations. Basal rates associated a characteristic time to each basic cell process, and mutation weights determined how these basal rates were affected once a given alteration was acquired. Mutation weights were taken to contribute equally for all alterations, and their effect was cumulative, so that a cell carrying two alterations simultaneously would perform basic processes with a double advantage. Thus, the stochastic mesoscopic model provided a richer scenario to explore intratumoral heterogeneity during tumor growth.

| Parameter | Meaning | Value | Ref. |
| No. of voxels per side | 80 | — | |
| Voxel side length (mm) | 1 | (62) | |
| Time-step length (h) | 24 | — | |
| Carrying capacity per voxel (cells) | (63) | ||
| Threshold cell number | 0.2 K | ||
| Initial population (cells) | 1 | — | |
| Maximum reachable tumor volume () | 50 (breast) | ||
| 120 (lung) | (64) | ||
| Tumor volume at diagnosis () | 0.3 to 5 (breast) | (65) | |
| 0.2 to 15 (lung) | (66) | ||
We ran 100 simulations of breast cancer and 100 simulations of NSCLC with random parameters uniformly sampled from the ranges in Tables 1 and 2 (Materials and Methods). Cell number, activity (number of newborn cells), and most abundant clonal population were calculated for each voxel and time step (Fig. 2). Tumor volumes were measured from the number of voxels containing more than a threshold number of cells (Table 1), and the mean spherical radii (MSR) were computed from these.
| Processes | Proliferation | Migration | Death | Mutation |
| Breast basal rates () | 0.0133 to 0.04 | 0.02 to 0.0303 | 0.01 to 0.02 | 0.01 to 0.02 |
| TP53/PIK3CA (%) | 20 to 40 | 25 to 45 | (−30) to (−10) | 25 to 40 |
| Lung basal rates () | 0.04 to 0.2 | 0.03 to 0.2 | 0.03 to 0.1205 | 0.03 to 0.1205 |
| TP53/KRAS (%) | 20 to 40 | 25 to 45 | (−30) to (−10) | 25 to 40 |
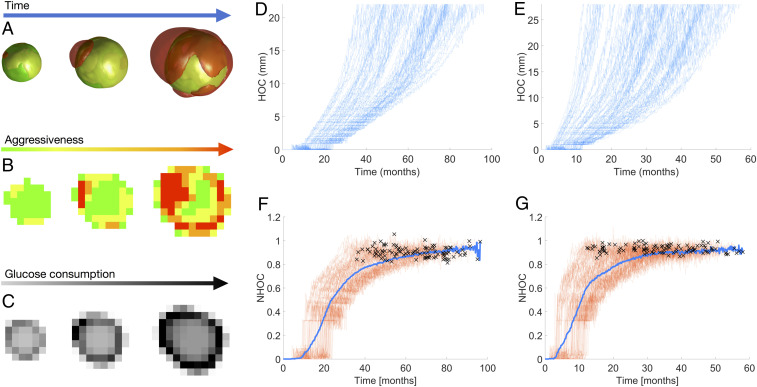
Hybrid stochastic mesoscale model shows that competition among progressively more aggressive phenotypes is pushed to the edge. (A) Three-dimensional volume renderings at different time frames (from left to right: 78, 85, and 92% of simulation) of a simulation of breast cancer growth depicting clonal populations within the tumor. Color of cell populations ranges from green (less aggressive) to red (more aggressive). Rates are proliferation 0.0315 , death 0.0157 , mutation 0.0160 , and migration 0.0235 . (B) Central section for the same simulation and time frames as in A showing the most abundant clonal population per voxel. (C) Central section of tumor activity for the same time frames as in A. (D and E) HOC progression for every simulation of breast cancer (D) and NSCLC (E). (F and G) Longitudinal NHOC dynamics for simulations of breast cancer (F) and NSCLC (G) growth, with individual runs colored in reddish orange and all-simulation averaged NHOC in blue; crosses depict the time points at which each simulation ended.
As cells mutated in silico, new clonal populations emerged with higher, more advantageous migration and proliferation rates. These new clones increased their relative abundance in the tumor, eventually becoming fixed in the system. As the tumors grew larger, cell division occurred preferentially at the tumor periphery. This was as expected, since inner voxels became progressively filled with cells that prevented them from proliferating. Voxels where the most aggressive clonal population was more abundant were associated with hotspots of maximum proliferation. Therefore, evolution was pushed toward the tumor edge: Cells with higher fitness (especially those having higher proliferation rates) appeared farther from the tumor center as they grew. At each time step, the maximum proliferation spot was identified as the voxel with the largest number of cell births, and its distance to the tumor centroid (HOC) was calculated. Fig. 2 D and E shows a monotonic increase of HOC with time for both histologies. Normalizing with respect to the MSR to get the NHOC showed that the point of maximum proliferation was displaced toward the boundary (Fig. 2 F and G) in all of the simulations performed. The only difference between simulations was the time that the maximum proliferation spot took to reach the edge. Thus, NHOC was predicted to be a robust property related to the evolutionary state of the disease.
The computational results suggested that NHOC might contain meaningful prognostic information. In the clinical setting, the metabolic activity distribution of the tumor can be evaluated by means of 18F-FDG PET, which reflects the biological processes taking place at a lower level (30) and is frequently used on newly diagnosed breast cancer and NSCLC patients. To confirm or refute the theoretical predictions, we performed a study on our patient cohort (Materials and Methods). For each patient, the tumor was delineated in the images and the locations of centroids and SUVmax were obtained computationally from the segmented distribution, as detailed in Materials and Methods. The metabolic tumor volume (MTV), total lesion glycolysis (TLG) (integral of the SUV distribution over the volume), and NHOC metrics were calculated for all tumors for both histologies. Two typical examples of 18F-FDG PET images from breast cancer patients are shown in Fig. 3 A and B, respectively. Small values of NHOC, with SUVmax close to the tumor centroid as in Fig. 3 B and I, were expected to correspond to less developed disease, in accordance with the previous theoretical framework. In contrast, the cases shown in Fig. 3 C and J with SUVmax displaced in relation to the centroid would correspond to tumors with a poorer prognosis.
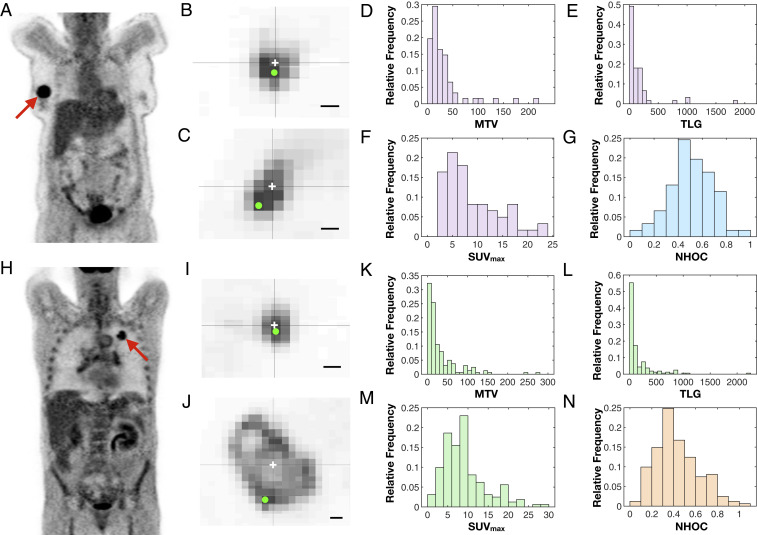
Analysis of NHOC in 18F-FDG PET images reveals well-behaved distributions with prognostic potential. (A and H) Examples of PET images for breast cancer (A) and NSCLC (H) patients in our dataset. (B, C, I, and J) Two-dimensional slices from patients with small (B and I) and large (C and J) NHOC values for breast cancer (B and C) and NSCLC (I and J) patients. The centroid of each segmented lesion and the voxel of SUVmax are marked with a white cross and a green dot, respectively. (Scale bars, 1 cm.) (D–G and K–N) Histograms showing the distributions of metabolic tumor volume (D and K), total lesion glycolysis (E and L), SUVmax (F and M), and NHOC (G and N) for breast cancer (D–G) and NSCLC (K–N) patients in our datasets.
The histograms in Fig. 3 D–G and K–N depict the distributions of MTV, TLG, SUVmax, and NHOC for both histologies. It is noteworthy that the NHOC has a more regular distribution than the other PET-based measures, with definite values between 0 and 1 and a centered mean (breast cancer, , median 0.50; NSCLC, , median 0.39). It is clear from Fig. 3 G and N that at the time of diagnosis the point of maximum uptake is typically located away from the geometrical center of the tumor. To inspect the relationships between the PET variables, we calculated a correlation matrix analysis (SI Appendix, Fig. S1). The results show that NHOC does not strongly correlate with the conventional measures and can therefore be considered as an independent metric.
The classical measures (MTV, TLG, SUVmax) are known to be prognostic biomarkers in breast cancer and NSCLC (22, 23). For these variables we performed Kaplan–Meier analyses on overall survival (OS) and disease-free survival (DFS) (SI Appendix, Figs. S3 and S4). All of the variables had prognostic value in the breast cancer cohort, but only MTV returned significant results (P value < 0.05) in the NSCLC cohort.
We then tested the prognostic value of NHOC by Kaplan–Meier analyses with OS and DFS as endpoints (Materials and Methods). Results for the best splitting thresholds are shown in Fig. 4. For the breast cancer cohort, NHOC showed robust results in terms of OS, with a best splitting threshold in both OS and DFS of NHOC = 0.499 (Fig. 4 A and C). Interestingly for OS, the most relevant metric, the C index, reached an outstanding value of 1 (for DFS it was 0.899). Thus, no patients with tumors having their SUVmax closer than half the radius ( = 30) died from the disease. In NSCLC, NHOC separated the patients well, and the best splitting threshold, NHOC = 0.64, led to a C index of 0.875 for OS. The separation in median OS between groups was 57.33 mo, while in DFS it was 36.62 mo. Therefore, patients for whom the 18F-FDG hotspot displays an increasing shift from the tumor centroid are associated to a worst outcome.
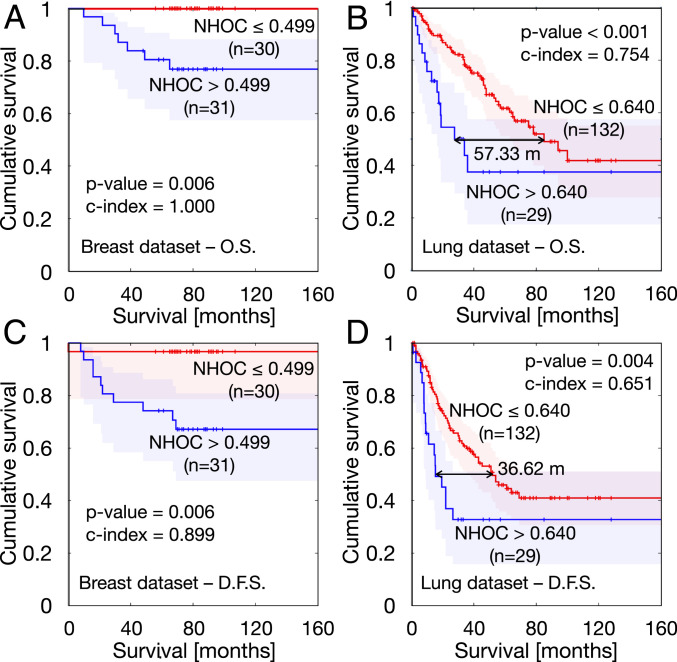
Kaplan–Meier curves obtained for best splitting thresholds corresponding to the NHOC metric. (A) Overall survival in breast cancer cohort. (B) Overall survival in NSCLC cohort. (C) Disease-free survival in breast cancer cohort. (D) Disease-free survival in NSCLC cohort.
To determine whether the prognostic value of NHOC might be related to possible necrotic regions, we evaluated the presence of hypometabolic voxels inside the delineated tumor, i.e., those situated inside the tumor that have a lower SUV value than the segmentation threshold. We found that these regions are present only in 7 of the 61 patients of our breast cancer cohort and in 13 of the 161 patients of our NSCLC cohort. Moreover, tumors where hypometabolic voxels are detected account on average for only 1.63% of the total voxels in the breast cancer cohort and 2.68% of the voxels in the NSCLC cohort. Consequently, in our cohorts, the NHOC significance is not associated to the occurrence of necrotic regions assessed by the manifestation of hypometabolic voxels in the images.
The presence of lymph node metastases is a strong predictor of outcome in breast and lung cancers, with nodal metastases having negative prognostic significance. We evaluated whether there was a significant difference in the NHOC value for the group of patients which showed nodal metastases on diagnosis and those who did not (Mann–Whitney test; SI Appendix, Fig. S9). The P values were 0.4683 for the breast cancer dataset and 0.1071 for the NSCLC, thus discarding any significant difference across groups and indicating that the information carried by NHOC is independent of the existence of lymph node metastases.
These results show the strength of NHOC as a prognostic biomarker in comparison with the classical metrics. For OS in the breast cancer cohort, only MTV approached the performance of NHOC; however, the C index for NHOC (C index = 1) outperformed the result for MTV (C index = 0.875). For DFS, none of the classical variables showed nonisolated thresholds leading to a statistically significant association between subgroups. In the lung cancer cohort, the NHOC metric outperformed, once again, the prognostic value of the classical variables. Regarding OS, there were ranges of thresholds of MTV, TLG, and SUVmax leading to statistically significant results with best C indexes of 0.736 (MTV), 0.682 (TLG), and 0.658 (SUVmax) still substantially lower than the value obtained for NHOC (0.875). Results for DFS were again similar, with only MTV and TLG achieving significance, with best values of 0.638 (MTV) and 0.607 (TLG), but still underperforming NHOC, with a C index of 0.651.
Heterogeneity is one of the hallmarks of tumor malignancy (1, 2). Many mathematical models have been constructed accounting for different aspects of the development of heterogeneity through evolutionary dynamical processes in a number of cancer types (3132–33). We did not intend here to develop a universal mathematical model to describe every aspect of tumor growth progression, but rather to focus on understanding the basic dynamics of the hotspot of metabolic activity, due to the potential applicability of the results. Different levels of complexity were considered in each of the two complementary models constructed, and both led to the same conclusions: 1) Tumors would evolve toward higher proliferation rate values, and 2) maximum metabolic activity would move toward the tumor edge as the tumor evolves with time.
It is interesting to note that conclusion 2 (but not conclusion 1) would have been arrived at through the use of a “classical” local Fisher–Kolmogorov model (34). In the context of that mathematical model, proliferation is inhibited in areas of high cell density and higher proliferation areas would switch from the tumor core to the periphery, as predicted also by the nonlocal model Eq. 1. This is, therefore, a robust finding of the study, and it is likely to be anticipated by other mathematical approaches. Conclusion 1 does not come as a surprise, since the maximum metabolic activity obtained from PET images (e.g., as measured by the SUVmax) has been known to contain prognostic information in different cancer types (22, 23). Thus, the fact that possesses a prognostic value in the clinical setting is compatible with the results of our models, where the activity grows with time over the tumor’s natural history until a maximum value is reached.
Many studies have correlated either classical PET-derived metrics such as MTV and TLG (35, 36) or complex spatial features of the distribution of SUV values (37) with the outcome of the disease. However, no study has analyzed the prognostic value of metrics derived from the location of the highest metabolic activity. The fact that this simple biomarker has a high prognostic value is remarkable and probably related to the robustness of the biological assumptions behind the mathematical models used to substantiate it. In fact, it is natural to expect that the presence of more aggressive glucose-avid cells, that might be unable to progress when located in saturated areas near the center of the tumor, may be a risk factor when placed in regions with much more capacity to settle and invade.
In our study we chose to take the voxel bearing the SUVmax as the location of maximum metabolic activity to compute NHOC. We could also have used SUVpeak (the maximum SUV appearing in the distribution when all of the voxels are averaged with their 26 neighbors), which is thought to be more stable and to better define an extended region of high uptake (38). However, SUVmax is often placed in the area defined by SUVpeak, thus leading to equivalent metrics (39). SUVmax is also easier to identify visually and is therefore easier to use in clinical practice, besides being the simplest option.
The fact that NHOC provides an accessible and powerful prognostic metric could be extended in different ways. First, it would be valuable to look at whether changes in this biomarker might provide a robust indication of an increase in malignancy for initially indolent tumors (e.g., benign lung nodules, low-grade gliomas, etc.) undergoing a malignant transformation. Second, an intriguing open question would be to determine whether the rate at which NHOC changes during patient follow-up correlates with the occurrence and fixation of specific mutations. Finally, it may be the case that changes with time of this metric, after different treatment modalities, could help in assessing the response through sequential PET studies as a measure of how much NHOC is reduced.
Hotspots in staging 18F-FDG PET–computed tomography (PET/CT) have previously been reported as preferential sites for relapse after chemoradiotherapy in several types of cancer, including NSCLC (40, 41). Some authors have found that these hotspots colocalize with hypoxic regions as inferred from HIF-1 tumor immunostaining (42) and are thus very relevant in the context of radioresistance (40, 43, 44). Furthermore, these hotspots have also been linked to the occurrence of somatic mutations in lung cancer (45, 46) similarly to what is described in this work. Although further research is needed, this rationale has led some authors to assert that patients may benefit from hotspot-based dose escalation (43, 47). The voxel of SUVmax, hence, has a preeminent significance both in prognosis and in therapy and, as it is now shown here, its relative position has a direct bearing on its relevance. In addition to NHOC tracking throughout the disease, NHOC estimation in hypoxia-specific PET imaging, employing other radiotracers such as fluoromisonidazole (18F-MISO) or fluoroazomycin arabinoside (18F-FAZA), could provide valuable information complementary to that of 18F-FDG PET/CT images.
Mathematical and computational models are progressively gaining their place among the tools that are used to study cancer (48). In silico models based on evolutionary dynamics may capture relevant aspects of tumor growth and have proved helpful in understanding tumor clonal heterogeneity, one of the main hallmarks of cancer (49). Mechanistic mathematical models of different levels of complexity have been shown to provide biomarkers of clinical significance (24, 50515253545556–57). This type of approach provides a rational alternative to radiomic and deep-learning studies, where a mechanistic explanation is often missing. The study described in this paper falls into the former category, demonstrating that an informed understanding of the system’s emergent properties can shed light on the deeper roots of its working.
It is worth mentioning that our mathematical approach, beyond its fundamental interest, has led to the proposal of a simple metric with high prognostic value that can be obtained from 18F-FDG PET studies. The NHOC biomarker was able to separate patients with breast cancer and non–small-cell lung cancer into two groups with significantly different survival (both overall and disease-free) and proved to be more powerful than traditional 18F-FDG PET/CT biomarkers (MTV, TLG, SUVmax) currently used in clinics. This demonstrated that the geometric location of the maximum metabolic activity, and not only its value, contains information of clinical significance: Tumors in which the hotspot is located farther from the center are found to have a worst prognosis.
This study opens many further avenues for research. The first one is the search for other biomarker definitions accounting for the location of highest metabolic activity. Second, it would be interesting to test our findings in other tumor histologies, such as lymphoma or melanoma (58, 59). PET is a mainstream technique, increasingly employed in clinics and in many imaging studies for which a broad spectrum of tumor histologies is available. Thus, the applicability of NHOC to other cancer types would be an interesting extension of our work.
In conclusion, by using two mathematical models incorporating evolutionary dynamics, we have shown that the maximum metabolic activity is expected to increase in magnitude and to move toward the tumor boundary as human solid tumors progress. On the basis of the theoretical predictions we have defined a metric, the NHOC, representing the normalized distance from the point of maximum activity to the tumor centroid and validated it as a prognostic biomarker in lung and breast cancer patients using PET imaging datasets. The biomarker NHOC outperformed classical PET-based biomarkers such as TLG, MTV, and SUVmax and provides a notable example of mathematically grounded research with applicability in oncology.
Our study was based on data from two different studies, both of them approved by the Institutional Review Board (IRB) of Ciudad Real University General Hospital (HGUCR). Breast cancer patients were participants of a multicenter prospective study, and written informed consent was obtained from all patients. The inclusion criteria were 1) newly diagnosed locally advanced breast cancer with clinical indication of neoadjuvant chemotherapy, 2) lesion uptake higher than background (i.e., those having a SUVmax larger than twice the background activity readings), 3) absence of distant metastases confirmed by other methods prior to the request of PET/CT for staging, and 4) breast lesion size of at least 2 cm. Sixty-one patients (18% lobular carcinoma, 82% ductal carcinomas, 100% women, age rank 25 to 80 y, median 50 y) were included in this dataset. The TNM data were 54% T2, 18% T3, 28% T4; 28% N0, 55% N1, 6% N2, 11% N3; 100% M0.
One hundred seventy-five patients (153 men, 22 women, age rank 41 to 84 y, median 65 y) were included in the study from a dataset of lung cancer patients who received surgery in the period June 2007 to December 2016. Histologies were 63 squamous-cell carcinomas and 112 adenocarcinomas. Staging information was 69 stage I, 70 stage II, 33 stage III, 3 stage IV. The N staging was 107 patients N0, 46 N1, and 22 N2. All patients had M0. PET protocol and machine were as in subgroup 1. The inclusion criterion was established that minimal lesion size should be greater than 2.0 cm. From those initial patients, 14 were removed due to the unavailability of survival data.
The PET machine was a dedicated whole-body PET/CT scanner (Discovery SDTE-16s; GE Medical Systems) in three-dimensional (3D) mode. Image acquisition began 60 min after intravenous administration of approximately 370 MBq (10 mCi) of 18F-FDG; the images obtained had a voxel size of 5.47 5.47 3.27 , with no gap between slices, and a matrix size of . The inclusion criteria considered only newly diagnosed patients with availability of pretreatment PET/CT examination and a lesion uptake higher than background (SUVmax larger than twice the background), absence of distant metastases, and a lesion size of at least 2 cm.
PET images in DICOM format were loaded into MATLAB for the image analysis. In each image, the tumor was manually selected and subsequently delineated in 3D by an automatic algorithm. The result of the delineation is a 3D matrix with the SUV values () of the voxels of the tumor. Occasionally, there might be hypometabolic voxels enclosed by the active ones, which could be assigned to necrotic regions; these are used here only for geometric considerations. For all delineated tumors in PET images, we evaluated the following metrics:
MTV, i.e., volume of the delineated tumor, computed as the number of selected voxels multiplied by the volume of one voxel :
TLG, calculated as the sum of the SUV value multiplied by the volume of the voxel for all of the N voxels in the tumor:
SUVmax, maximum value of SUV in the tumor:
We refer to the SUVmax voxel position by its coordinates , , and use it as a location for the 18F-FDG hotspot.
MSR, the radius of a hypothetical sphere having the same volume as the MTV and serving as a linear surrogate of volume:
Centroid: As a reference point for the center of the tumor that is independent of the observer and computable for any delineated tumor, we use the geometrical centroid of the 3D shape defined by the segmented tumor and all its interior points, including the hypometabolic ones. Its coordinates are computed by the mathematical definition
HOC, distance from 18F-FDG hotspot (voxel with SUVmax) to tumor centroid measured as the Euclidean distance between both points:
NHOC, normalized distance from 18F-FDG hotspot to tumor centroid. To make the HOC size independent, we normalize it by the MSR as a linear measure of volume. Consequently, we get a metric for the shift of the 18F-FDG hotspot that is comparable along all tumors:
Even though all of the images were taken with PET/CT coregistration, only data from positron emission tomography were used in this work.
We performed Kaplan–Meier analyses over these two cohorts of patients, using the log-rank and Breslow tests to assess the significance of the results. These methods compare two populations separated in terms of one parameter and study their statistical differences in survival. Specifically, OS and DFS Kaplan–Meier analyses were performed. A two-tailed significance level with P value lower than 0.05 was applied. The hazard ratio (HR) and its adjusted 95% confidence interval (CI) were also computed for each threshold using Cox proportional hazards regression analysis.
For each variable, we searched for every value splitting the sample into two different subgroups, satisfying the condition that none of them be more than five times larger than the other. We then tested each of them as splitting thresholds through Kaplan–Meier analyses, obtaining the significance results shown in SI Appendix, Figs. S5–S8. The best splitting threshold was chosen as the nonisolated significant value giving the lowest P value in both log-rank and Breslow tests, as described in ref. 52.
To assess the accuracy of prognostic models, Harrell’s concordance index score was also computed (60). This method compares the survival of two populations of patients (best prognosis versus worst prognosis) by studying all possible combinations of individuals belonging to different groups. Then, the percentage of right guesses is the reported result. Concordance indexes were computed using the noncensored sample and ranged from 0 to 1, with 1 indicating a perfect model (a purely random guess would give a concordance index of 0.5).
Spearman correlation coefficients were used to assess the dependencies between pairs of variables. We considered significant correlation coefficients above 0.7 or below −0.7 as strong (direct or inverse, respectively) correlations between variables. In this way we were able to exclude possible confounding effects in our analysis.
SPSS (v. 22.0.00), MATLAB (R2018b; The MathWorks, Inc.), and R (3.6.3) software were used for all statistical analyses.
The migration–proliferation integro-differential Eq. 1 in radial coordinates was solved numerically using the method of lines (61) combined with Newton–Cotes integration formulas to deal with the nonlocal term. In the simulations displayed in Fig. 1, the computational domain consisted of a radial variable , where cm was the maximum radius, and the proliferation rate , where the maximum proliferation rate was . The number of nodes in the discretized - mesh was . Additional parameters were /d, , , and cells/. The initial condition consisted of a highly localized lesion with a radius of 1 mm containing tumor cells and having a mean proliferation rate and standard deviation .
The general expression for the proliferation density is
In Fig. 1C, the mean metabolic radius was defined as
This research has been supported by grants awarded to V.M.P.-G. by the James S. Mc. Donnell Foundation, United States of America, 21st Century Science Initiative in Mathematical and Complex Systems Approaches for Brain Cancer (collaborative award 220020560) and by the Junta de Comunidades de Castilla-La Mancha, Spain (grant number SBPLY/17/180501/000154). V.M.P.-G. and G.F.C. thank the funding from Ministerio de Ciencia e Innovación, Spain (grant number PID2019-110895RB-I00). This research has also been supported by a grant awarded to G.F.C. by the Junta de Comunidades de Castilla-La Mancha, Spain (grant number SBPLY/19/180501/000211). J.J.-S. received support from Universidad de Castilla-La Mancha (grant number 2020-PREDUCLM-15634). J.J.B received support from the University of Castilla-La Mancha (grant number 2018-CPUCLM-7798). A.M. received support from Asociación Pablo Ugarte (http://www.asociacionpablougarte.es). C.O.-S. received support from Asociación Española Contra el Cáncer (grant number 2019-PRED-28372).
All study data are included in this article and/or SI Appendix. The data extracted by PET imaging processing of all of the patients are accessible in our group’s webpage: http://matematicas.uclm.es/molab/EvolutionaryDynamicsAtTheTumorEdge_DATA.xlsx.
July 6, 2021: The Acknowledgments have been updated.
1
2
3
5
6
7
9
10
11
12
13
14
16
17
18
19
20
21
22
23
24
25
28
29
30
31
32
33
34
35
36
37
38
39
40
41
42
43
44
45
46
47
48
49
50
51
52
53
54
55
56
57
58
59
60
61
62
63
64
65
 Evolutionary dynamics at the tumor edge reveal metabolic imaging biomarkers
 Facebook
 Twitter
 Linkedin
 Whatsapp
