
 ,
Sergio Covarrubias,
Daisy Kuang,
Justin Iwuagwu,
Sol Katzman,
Edward Wakeland,
Susan Carpenter
,
Sergio Covarrubias,
Daisy Kuang,
Justin Iwuagwu,
Sol Katzman,
Edward Wakeland,
Susan Carpenter
Edited by Ruslan Medzhitov, Yale University, New Haven, CT, and approved December 18, 2020 (received for review August 6, 2020)
Author contributions: A.C.V., S. Covarrubias, and S. Carpenter designed research; A.C.V., S. Covarrubias, D.K., J.I., R.S., K.V., and S. Carpenter performed research; C.V. contributed new reagents/analytic tools; A.C.V., S. Covarrubias, A.S., S.K., E.W., and S. Carpenter analyzed data; and A.C.V. and S. Carpenter wrote the paper.
Inflammation has largely been studied in the context of protein-coding genes. Recent studies have uncovered lncRNAs as important regulators of immunity. The functional characterization of these genes remains an active area of research. In this study, we identify GAPLINC as a functionally conserved lncRNA between human and mouse. GAPLINC depletion results in enhanced expression of immune response genes that are direct NF-κB targets. Astoundingly, we observe that Gaplinc knockout mice show resistance to LPS-induced endotoxic shock and find that basal expression of inflammatory genes prevents clot formation to protect against multiorgan failure and death. These findings have implications in the treatment of sepsis, in which new therapies targeting lncRNAs can contribute valuable information in understanding inflammation and improving patient outcome.
Recent studies have identified thousands of long noncoding RNAs (lncRNAs) in mammalian genomes that regulate gene expression in different biological processes. Although lncRNAs have been identified in a variety of immune cells and implicated in immune response, the biological function and mechanism of the majority remain unexplored, especially in sepsis. Here, we identify a role for a lncRNA—gastric adenocarcinoma predictive long intergenic noncoding RNA (GAPLINC)—previously characterized for its role in cancer, now in the context of innate immunity, macrophages, and LPS-induced endotoxic shock. Transcriptome analysis of macrophages from humans and mice reveals that GAPLINC is a conserved lncRNA that is highly expressed following macrophage differentiation. Upon inflammatory activation, GAPLINC is rapidly down-regulated. Macrophages depleted of GAPLINC display enhanced expression of inflammatory genes at baseline, while overexpression of GAPLINC suppresses this response. Consistent with GAPLINC-depleted cells, Gaplinc knockout mice display enhanced basal levels of inflammatory genes and show resistance to LPS-induced endotoxic shock. Mechanistically, survival is linked to increased levels of nuclear NF-κB in Gaplinc knockout mice that drives basal expression of target genes typically only activated following inflammatory stimulation. We show that this activation of immune response genes prior to LPS challenge leads to decreased blood clot formation, which protects Gaplinc knockout mice from multiorgan failure and death. Together, our results identify a previously unknown function for GAPLINC as a negative regulator of inflammation and uncover a key role for this lncRNA in modulating endotoxic shock.
Sepsis is a life-threatening illness caused by an overreaction of the body to the presence of infection, which can rapidly lead to multiorgan failure and death. The immune system is essential in providing protection against infection; however, uncontrolled activation can have serious consequences for the host. According to the Centers for Disease Control and Prevention, one in three patients who die in a hospital have sepsis (1), and yet we still do not understand the underlying molecular mechanisms that lead to fatality. Clinical options for the treatment of sepsis are limited to the delivery of fluid, antibiotics, and supportive care and have remained largely unchanged for decades. Though early diagnoses and rapid treatment have improved sepsis outcomes (2), there is a critical need to develop new therapies. Although gene expression studies have been performed to examine potential therapeutic targets for sepsis, these targets remain largely uncharacterized (3). We have identified a long noncoding RNA (lncRNA) with roles in controlling the immune response and endotoxic shock that provides avenues for novel drug development to target sepsis.
As lncRNA expression can regulate the immune response by affecting immune cell differentiation and their respective function (456–7), we wanted to investigate the role of lncRNAs in macrophages. Macrophages are important innate immune cells that can be derived from monocytes and are critical for pathogen recognition through the use of Toll-like receptors (TLRs). Upon activation, TLRs initiate complex signaling pathways that activate key transcription factors such as NF-κB, leading to the transcription of hundreds of immune response genes (8).
To identify lncRNAs involved in macrophage differentiation and function, we conducted RNA sequencing (RNA-Seq) in both human primary monocyte-derived macrophages (MDMs) and the monocytic cell line THP-1s (Fig. 1A and SI Appendix, Fig. S1). We identified gastric adenocarcinoma predictive long intergenic noncoding RNA (GAPLINC) as the most up-regulated lncRNA during monocyte to macrophage differentiation (Fig. 1B). GAPLINC levels were detectable by day 1 and increased to ∼300 copies per cell (Fig. 1C). Using RNA-profiling technology (nCounter, Nanostring), we validated GAPLINC as one of the top 10 mRNAs expressed in differentiated primary MDMs and THP-1s (Fig. 1D). We also confirmed that GAPLINC is highly expressed in MDMs but not expressed in the closely related cell type monocyte-derived dendritic cells (MDDCs) (Fig. 1E), suggesting that expression of GAPLINC is cell-type specific. By performing a cell fractionation experiment and measuring GAPLINC levels in the cytoplasmic and nuclear compartments of macrophages using qPCR, we found GAPLINC is predominantly localized in the cytosol when compared to CD14, a cytoplasmic mRNA, and NEAT1, a nuclear lncRNA (Fig. 1F). This is consistent with findings in cancer cells, in which GAPLINC is mainly localized to the cytoplasm (9). To ensure GAPLINC is noncoding, we performed polysome profiling, a method used to analyze whether a gene is actively translated into protein. In contrast to CD14, neither NEAT1 nor GAPLINC were found in the high-polysome fraction, suggesting that GAPLINC is not translated (Fig. 1G).

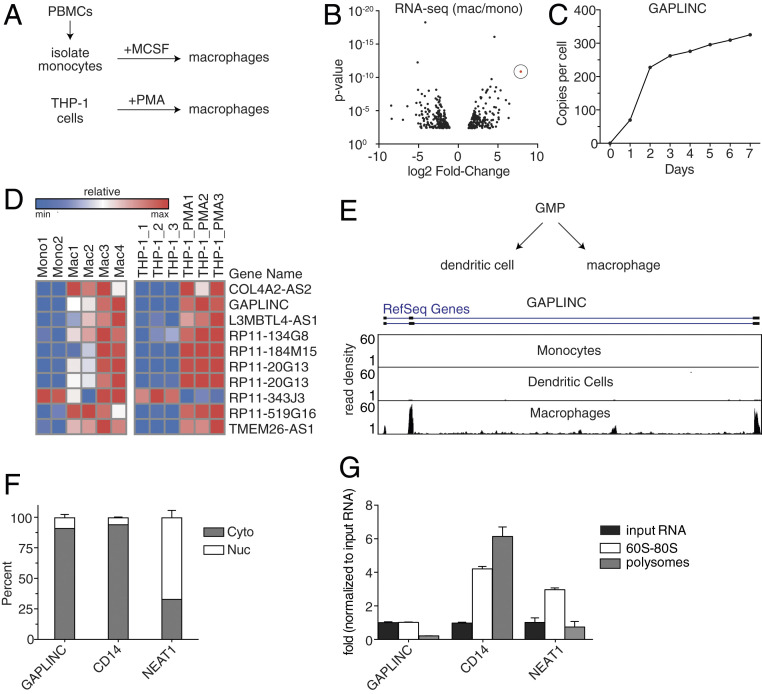
Identification and characterization of macrophage-specific lncRNA GAPLINC. (A) A schematic for macrophage differentiation in vitro using primary human cells or immortalized THP-1 cells. Isolated monocytes from human PBMCs are differentiated into macrophages using recombinant macrophage colony-stimulating factor. THP-1 cells are differentiated into macrophages by treatment with PMA (100 nM). (B) RNA-Seq analysis on macrophages differentiated from monocytes isolated from human PBMCs (n = 4 donors). Results are represented in a volcano plot. GAPLINC (shown in red) is the most up-regulated lncRNA (>1,000-fold). (C) RNA-Seq analysis of GAPLINC expression during monocyte to macrophage differentiation for the indicated time points. GAPLINC expression is represented as copies per cell (FPKM). (D) Heat map represents gene expression from a custom Nanostring panel, which shows the top 10 differentially expressed lncRNA comparing monocytes to macrophages in primary human cells and THP-1 cells. Data from Nanostring were performed in biological duplicates. (E) A schematic for granulocyte-monocyte progenitor cells that give rise to two distinct populations: 1) MDDCs and 2) MDMs. UCSC genome browser track displays RNA-Seq reads from monocytes, macrophages, and dendritic cells at the GAPLINC locus. (F) qPCR analysis of RNAs purified from nuclear (white) and cytoplasmic (gray) fractions in MDMs. (G) qPCR analysis of RNAs isolated from different polysome fractions of MDM lysates (10 to 50% sucrose gradient, SW41, 40 K rpm, for ∼1.5 h).
Next, we investigated the effect of GAPLINC silencing on differentiating macrophages. As GAPLINC levels increased during differentiation, we hypothesized that GAPLINC knockdown (kd) would impact genes involved in differentiation. Using pooled small interfering RNA (siRNA), we achieved ∼55 to 65% kd of GAPLINC in primary MDMs (SI Appendix, Fig. S2). We performed RNA-Seq and identified a number of genes that were dysregulated upon GAPLINC kd (Fig. 2A). We confirmed the top hits using Nanostring (SI Appendix, Fig. S3). Gene Ontology (GO) enrichment analysis showed that immune response genes were significantly overrepresented in genes up-regulated upon GAPLINC kd and not genes involved in macrophage differentiation, contrary to our original hypothesis. (Fig. 2B). Notably, differentially expressed genes in GAPLINC-kd cells include proinflammatory cytokines and chemokines (IL6, CXCL10, and TNFSF10), IFN-stimulated genes (ISGs) (IFIT2 and RSAD2), and guanylate-binding proteins (GBPs) (GBP3 and GBP5) (Fig. 2C and SI Appendix, Fig. S4). To verify that macrophage differentiation was unaffected by GAPLINC kd, levels of CD11B, CD16, and CD14 were measured in control and siGAPLINC-treated macrophages and found to be similar (SI Appendix, Fig. S5). Next, we used an additional kd approach utilizing CRISPR inhibition (CRISPRi) to target the transcriptional start site of GAPLINC using three different guide RNAs (gRNAs) in THP-1 cells stimulated with phorbol 12-myristate 13-acetate (PMA). We achieved over 80% kd of GAPLINC and again observe increased expression of the proinflammatory cytokine IL6 when GAPLINC is knocked down at baseline (SI Appendix, Fig. S6 A and B). Interestingly, following lipopolysaccharide (LPS) activation, the levels of IL6 were similar in the control versus GAPLINC kd THP-1 cells (SI Appendix, Fig. S6C). Since the baseline levels differ, the overall fold induction of IL6 is reduced when GAPLINC is removed. (SI Appendix, Fig. S6D).
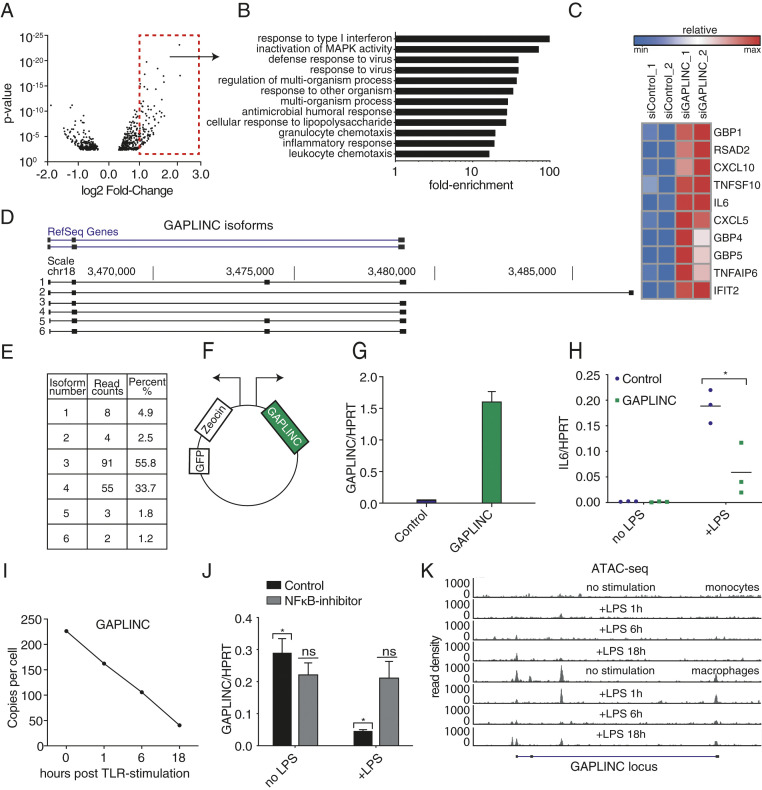
GAPLINC is a negative regulator of inflammation and dependent on NF-κB signaling. Monocytes isolated from human PBMCs and differentiated into macrophages were transfected with control or GAPLINC siRNA. (A) RNA-Seq analysis on GAPLINC kd or control siRNA MDMs. RNA-Seq was performed in biological duplicates. Results are represented in a volcano plot. Significantly up-regulated genes with fold change ≥ 2 are boxed in red. (B) GO-Term analysis on significantly up-regulated genes. (C) Heat map represents gene expression of top immune-related genes up-regulated upon GAPLINC kd. Data from RNA-Seq was performed in biological duplicates. (D) GAPLINC isoforms in MDMs as determined by Nanopore-based R2C2 sequencing. Data from Nanopore sequencing was performed in biological duplicates (raw data are available at SRA under Bioproject PRJNA639136). (E) A table representing read counts and percent of each GAPLINC isoform. (F) Bidirectional vector expressing GFP-Zeocin on one side and GAPLINC on the other side. (G and H) qPCR analysis of GAPLINC expression in THP-1 cells expressing ectopic GAPLINC or empty-vector control. Levels of IL6 were quantified following stimulation with LPS (200 ng/mL) for 6 h; data were pooled from three independent experiments. *P < 0.05. (I) RNA-Seq analysis of MDMs stimulated with LPS (200 ng/mL) for the indicated time points. Data from RNA-Seq was performed in biological duplicates. GAPLINC expression is represented as copies per cell (FPKM). (J) qPCR analysis of GAPLINC in MDMs (n = 3) pretreated with DMSO or BAY-7082 (10 μM), followed by LPS stimulation (200 ng/mL) for 6 h; data were pooled from three independent experiments. *P < 0.05. (K) ATAC-seq analysis of monocytes and macrophages, untreated and treated with LPS (200 ng/mL) for 1, 6, and 18 h. UCSC browser track displays ATAC-Seq reads at the GAPLINC locus.
As GAPLINC kd resulted in the up-regulation of immune response genes, we generated a THP-1 cell line overexpressing GAPLINC to determine if it mediates the opposite effect. Using long-read sequencing data, we identified the dominant isoforms of GAPLINC expressed in MDMs (Fig. 2D). The most abundant isoform, which matches the Reference Sequence (RefSeq) gene annotation, was incorporated into our construct (Fig. 2E). We utilized a lentiviral vector containing a bidirectional promoter to drive green fluorescent protein (GFP)/Zeocin and GAPLINC in parallel (Fig. 2F). We confirmed using qPCR that GAPLINC was stably expressed in THP-1s compared to control (Fig. 2G). Overexpression of GAPLINC reduced IL6 at the RNA level compared to control following stimulation with LPS, a component of gram-negative bacteria (Fig. 2H). These observations suggest that GAPLINC acts as a negative regulator of the inflammatory response.
Next, we examined GAPLINC levels in primary MDMs in response to inflammation. Upon LPS stimulation, we found that GAPLINC was rapidly down-regulated (Fig. 2I). Additionally, using qPCR we show that GAPLINC is also down-regulated following activation with a variety of TLR ligands (SI Appendix, Fig. S7A). Induction of positive-control inflammatory genes TNF-α, IL6, and CCL5 was confirmed (SI Appendix, Fig. S7B). These data suggest that GAPLINC expression must be reduced following stimulation in order for optimal inflammatory gene induction to occur. To evaluate the role of NF-κB in controlling the expression of GAPLINC, MDMs were pretreated with dimethyl sulfoxide (DMSO) or BAY11-7082, an NF-κB inhibitor, followed by stimulation with LPS for 6 h. In BAY11-7082-treated MDMs, the down-regulation of GAPLINC was impaired relative to control (Fig. 2J), which suggests the regulation of GAPLINC is dependent on NF-κB signaling. Induction of positive-control inflammatory genes TNF-α and IL6 upon LPS stimulation was confirmed (SI Appendix, Fig. S7C). To understand how GAPLINC is being regulated, we utilized Assay for Transposase-Accessible Chromatin using sequencing (ATAC-seq) in MDMs to assess chromatin accessibility of the GAPLINC locus. We found that GAPLINC is actively transcribed in resting macrophages but tightly shut down following LPS stimulation (Fig. 2K), suggesting that GAPLINC is regulated at the level of transcription.
To explore the conservation of GAPLINC between human and mouse, we sought to identify syntenic loci, in which genes are positionally conserved between the same two protein-coding genes, followed by an assessment for functional conservation. Here, we show that Gaplinc is positionally conserved, locating a transcript between genes Dlgap1 and Tgif1 (Fig. 3A). To confirm cell-type specificity, we utilized the Mouse Cell Atlas (MCA) (10) to assess transcript levels across immune cells in the bone marrow (BM) and found it highest expressed in macrophages, with lower levels of expression in neutrophil progenitors (Fig. 3B). Next, to determine if expression patterns were conserved during macrophage differentiation in both human and mouse, we performed RNA-Seq comparing BM cells to bone marrow derived macrophages (BMDMs), completed de novo transcript assembly, and found mouse Gaplinc levels increased following differentiation (SI Appendix, Fig. S8A). We validated this by qPCR, comparing Gaplinc levels in BM cells to BMDMs (Fig. 3C). Comparable to human GAPLINC, mouse Gaplinc is rapidly down-regulated in LPS-stimulated BMDMs (Fig. 3D). As a control, we confirmed the induction of inflammatory genes Tnf-α and Il6 (SI Appendix, Fig. S8B). Mouse Gaplinc is also rapidly down-regulated following activation with various TLR ligands. Induction of the positive-control genes Il6 and Ccl5 were also confirmed (SI Appendix, Fig. S8C).
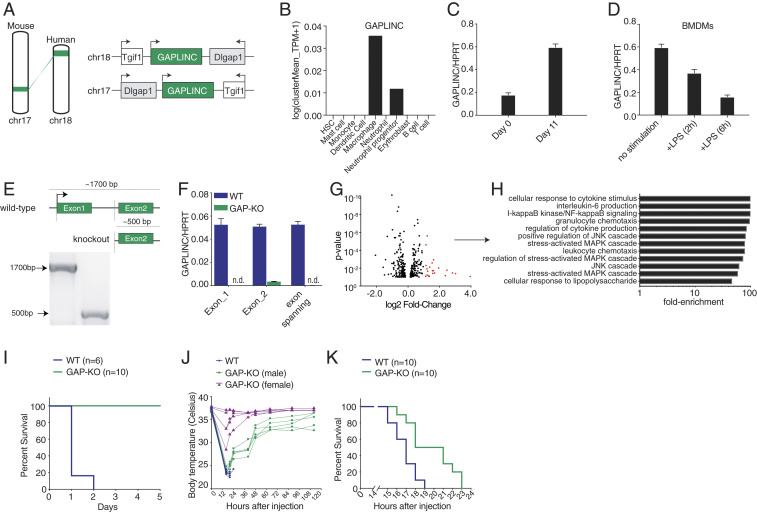
GAPLINC is conserved in mice and regulates response to endotoxic shock. (A) GAPLINC is conserved in synteny. GAPLINC is located on Chr18 in humans and on Chr17 in mice, between protein-coding genes Dlgap1 and Tgif1. Dlgap1 is not expressed in macrophages. (B) MCA shows distribution of Gaplinc levels in various immune cell types (BM). (C) qPCR analysis of Gaplinc expression in BM cells and BMDMs; these data (mean ± SD) are representative of three independent experiments. (D) qPCR analysis of Gaplinc expression in BMDMs stimulated with LPS (200 ng/mL) for 6 h; these data (mean ± SD) are representative of three independent experiments. (E) Schematic of Gaplinc locus before and after CRISPR/Cas9 mediated deletion. Dashed lines indicate the approximate region of deletion. Gel represents PCR amplification of genomic data. Amplicon lengths are compared for WT and Gaplinc KO mice. (F) qPCR analysis of Gaplinc expression in WT and Gaplinc-KO BMDMs using a combination of primers to detect Exon1, Exon2, and exon-spanning regions of the Gaplinc transcript; these data (mean ± SD) are representative of three independent experiments. (G) RNA-Seq analysis in BMDMs from WT and Gaplinc KO mice (n = 3). Results are represented in a volcano plot. Significantly up-regulated genes with a fold change ≥ 2 are shown in red. (H) GO-Term analysis on significantly up-regulated genes. (I and J) Survival data of WT and Gaplinc KO mice are shown in response to E. coli LPS challenge (5 mg/kg/mice) (n = 6 to 10). The statistical test of differences was calculated using the log-rank (Mantel-Cox) test. ***P < 0.001. Changes in body temperature of WT and Gaplinc KO mice were recorded at the indicated time points. (K) Survival data of WT and Gaplinc KO mice are shown in response to E. coli LPS challenge (20 mg/kg/mice) (n = 10). The statistical test of differences was calculated using the log-rank (Mantel-Cox) test. ***P < 0.001.
Using CRISPR, we generated a Gaplinc knockout (KO) mouse in which Exon 1 and the majority of the first intron were removed (Fig. 3E). Gaplinc KO mice bred normally and displayed no obvious developmental defects. The deletion of Gaplinc was confirmed by PCR amplification of genomic DNA in wild-type (WT) and Gaplinc KO mice, with amplicon sizes ∼1,300 bp for WT and ∼500 bp for Gaplinc KO mice (Fig. 3E). The full genotyping strategy to confirm WT and Gaplinc KOs is highlighted in SI Appendix, Fig. S9. We also confirmed Gaplinc deficiency in BMDMs using qPCR (Fig. 3F). To assess whether Gaplinc deficiency affected differentiation, we stained WT and Gaplinc-KO BMDMs for CD11B and F4/80; staining patterns were similar, suggesting normal macrophage differentiation (SI Appendix, Fig. S10A). To assess whether Gaplinc KO disrupted macrophage function, we compared phagocytosis activity in WT and Gaplinc-KO BMDMs and found no differences (SI Appendix, Fig. S10B).
To assess the global impact of Gaplinc deficiency in macrophages, we performed RNA-Seq on WT and Gaplinc-KO BMDMs; both were untreated and LPS stimulated for 6 h. In Gaplinc-KO BMDMs, the expression of 23 genes (shown in red, Fig. 3G) were significantly up-regulated at baseline. These genes include proinflammatory cytokines and chemokines (Il6, Il1-α, Il1-β, and Cxcl10), ISGs (Ifit1bl1), GBP-family members (Gbp5 and Gbp10), and cell-surface markers specific for activated macrophages (Cd69). GO analysis confirmed that genes involved in the immune response are overrepresented in Gaplinc-KO BMDMs at baseline (Fig. 3H). These genes are typically up-regulated following LPS stimulation (SI Appendix, Fig. S11). Similar to data obtained from our human studies, these data suggest that GAPLINC is functionally conserved across species to basally control the expression of inflammatory-response genes (IRGs). There was no major difference in the genes that were up-regulated following LPS stimulation between the WT and Gaplinc-KO BMDMs (Dataset S1).
Numerous studies have shown the ability of lncRNAs to regulate the transcription of neighboring genes (11). As such, we explored potential cis-regulatory roles for Gaplinc as its neighboring gene, Tgif1, has been previously implicated in modulating macrophage activation (12). Using our RNA-Seq data, we confirmed that in GaplincKO BMDMs, the expression of Tgif1 relative to WT cells was not affected (SI Appendix, Fig. S12A). We further confirmed by qPCR that Tgif1 was unaltered in Gaplinc-KO BMDMs (SI Appendix, Fig. S12B). Next, we explored the possibility that disruption of the Gaplinc locus could remove an important regulatory element, such as an enhancer. We utilized ATAC-seq data from WT BMDMs to assess transcriptionally active regions in the Gaplinc locus (13). We did not identify signals within the Gaplinc deletion region, only those corresponding to the Gaplinc promoter (SI Appendix, Fig. S13). Collectively, these data suggest that up-regulation of IRGs upon Gaplinc deficiency is not due to effects on neighboring genes or removal of a regulatory element.
As Gaplinc KO in BMDMs up-regulates the expression of IRGs under basal conditions, we next wanted to challenge Gaplinc KO animals in vivo to observe differences in host response. We employed an “endotoxic shock” model, in which Escherichia coli LPS was intraperitoneally (i.p.) injected into WT and Gaplinc KO mice to measure differences in survival. At a dose of 5 mg/kg/mouse, WT mice showed 0% survival after 2 d (Fig. 3I). However, 100% of Gaplinc KO mice survived, suggesting that Gaplinc KO mice have resistance to LPS-induced endotoxic shock (Fig. 3I). Notably, significant temperature differences between WT and Gaplinc-deficient mice are observed (Fig. 3J). Even when utilizing a much higher dose of LPS of 20 mg/kg, the Gaplinc-deficient mice display a significant survival advantage (Fig. 3K). Collectively, these data show Gaplinc plays an important role in regulating the immune response in vivo.
From our human studies, we know that GAPLINC can regulate immune genes at baseline. While there is no difference in cytokine expression following inflammatory activation, there is a difference in the magnitude of the response since the baseline levels differ. Therefore, to better understand these survival differences in vivo, we assessed for changes in cytokine expression at baseline. We utilized a multiplexed cytokine array to simultaneously measure biomarkers associated with the immune response, sepsis, and cancer. At baseline, key immune genes including MDC, MIP-1a, IL-13, IL-5, and M-CSF were significantly elevated in the serum of Gaplinc KO mice compared to WT (Fig. 4A). These cytokines are implicated in cell recruitment; however, using flow cytometry, we confirmed the percentage of neutrophils, T cells, B cells, eosinophils, monocytes, and macrophages were comparable between WT and Gaplinc KO mice at baseline (SI Appendix, Fig. S14). Interestingly, these percentages were also comparable post-LPS challenge at the 6 h and 18 h time points (SI Appendix, Figs. S15 and S16). Furthermore, serum from WT and Gaplinc KO mice tested for clinical features of sepsis, including lactate and C-reactive protein (CRP) (SI Appendix, Fig. S17), showed no differences.
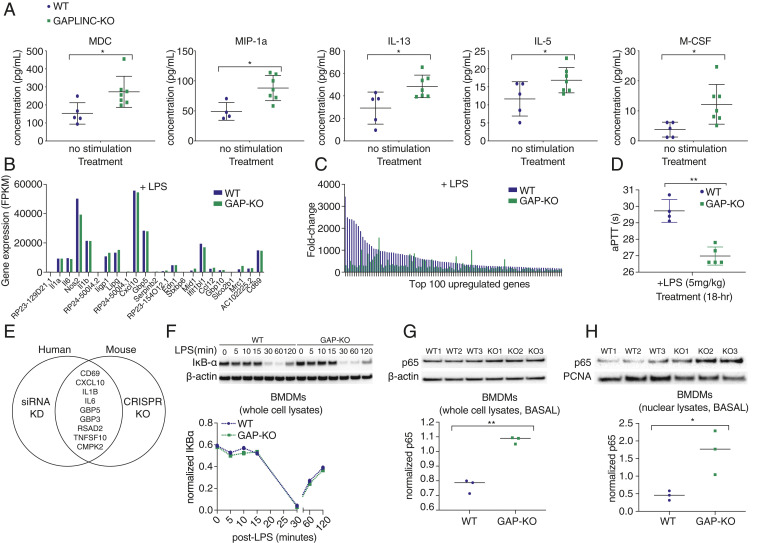
Gaplinc KO up-regulates IRGs and shows increased levels of p65 in the nucleus at baseline. (A) Cytokine levels in serum of WT and Gaplinc KO mice at basal. n = 4 to 7, *P < 0.05. (B and C) RNA-Seq analysis in BMDMs from WT and Gaplinc KO mice stimulated with LPS (200 ng/mL) for 6 h (n = 3). The 23 genes up-regulated in Gaplinc KO–only condition are compared to WT and Gaplinc-KO BMDMs stimulated with LPS. The resulting fold change upon LPS stimulation is shown for WT and Gaplinc-KO BMDMs. Genes are ranked according to their fold change in WT. (D) Coagulation parameters assessed for WT and Gaplinc KO mice challenged i.p. with E. coli LPS (5 mg/kg/mice) (n = 4 to 5). Plasma was collected 18 h post-LPS injection. aPTT was measured. (E) Genes up-regulated upon siRNA kd of human GAPLINC in MDMs are compared to genes up-regulated upon CRISPR/Cas9 knockout of mouse Gaplinc in BMDMs (fold change ≥1.5). Up-regulated genes overlapping in both human and mouse are shown in the middle. (F) Western blot of I-κB-α in WT and Gaplinc-KO BMDMs at the indicated time points following stimulation with LPS (200 ng/mL); these data are representative of three independent experiments. (G) Western blot of p65 in WT and Gaplinc-KO BMDMs (n = 3) at basal. **P < 0.01. (H) Western blot of p65 in nuclear fraction of WT and Gaplinc-KO BMDMs (n = 3).
As increased levels of MDC or IL-13 (Fig. 4A) have been previously characterized to play protective roles against endotoxic shock through modulation of proinflammatory cytokines (14, 15), we next examined for differences in proinflammatory cytokine levels, including Il6, Il1-α, Il1-β, and Cxcl10, following inflammatory activation. While WT and Gaplinc KO levels are the same at both the transcript (Fig. 4B) and protein level (SI Appendix, Fig. S18 A–C), the magnitude of change is much lower (Fig. 4C), suggesting that this reduced fold change may play a role in preventing the susceptibility of Gaplinc KO mice to LPS-induced endotoxic shock.
Along with the rampant production of cytokines, another clinical aspect of endotoxic shock that can lead to mortality is the formation of blood clots in the smaller vessels, leading to multiorgan failure (16, 17). To address this, we analyzed the serum of LPS i.p.-treated mice to assess differences in coagulation. Using an activated partial thromboplastin time (aPTT) assay that measures time to clot formation, we find that WT mice show a significantly prolonged aPTT time compared to Gaplinc KO mice upon LPS challenge (Fig. 4D). Prolonged aPTT times suggests WT mice have already undergone coagulation and depleted key coagulation factors, such that at the time of testing, initiating clotting, and measuring, time to clot formation is increased. The data suggest that differences in survival upon LPS challenge are due to WT mice undergoing increased clotting, leading to eventual organ failure and death.
Next, we tried to mechanistically understand how Gaplinc is mediating this effect. First, we confirmed its localization and analyzed Gaplinc levels in both the cytoplasmic and nuclear compartments of BMDMs by qPCR. Similar to human GAPLINC, mouse Gaplinc was predominantly cytoplasmic (SI Appendix, Fig. S19). Next, we performed modified Comprehensive Identification of RNA-binding proteins (ChIRP), coupled with mass spectrometry and small RNA sequencing, as GAPLINC has been previously shown to interact with micro RNAs (18). We did not observe interactions with previously identified targets (SI Appendix, Fig. S20).
As we could not identify a direct binding partner, we focused on the conserved function between human and mouse, specifically the conserved genes impacted in our human GAPLINC kd and mouse Gaplinc KO studies, the majority of which are NF-κB regulators (Fig. 4E). The most abundant form of NF-κB activated by LPS is the p65:p50 heterodimer, and seven out of the nine conserved genes are direct p65 targets (19). We used native RNA immunoprecipitation (RIP) and showed that there is no direct interaction between Gaplinc and p65 (SI Appendix, Fig. S21). In the classical NF-κB signaling pathway, the p65:p50 subunits are located in the cytosol and bound to inhibitory I-κB-α in resting cells. Upon activation, I-κB-α is degraded, allowing p65:p50 to translocate into the nucleus and activate target genes (20). In WT and Gaplinc-KO BMDMs, we measured the degradation of I-κB-α using Western blot and found no differences (Fig. 4F). Next, we compared total p65 levels in BMDMs. In our RNA-Seq data, p65 (RelA) transcript levels in both the basal and LPS-stimulated conditions for WT and Gaplinc-KO BMDMs are comparable (SI Appendix, Fig. S22). However, when we compared total p65 protein levels by Western blot, we found significantly increased p65 levels in Gaplinc-KO cells compared to WT (Fig. 4G). This suggests that Gaplinc regulates total p65 levels at the translational level. Additionally, we assessed p65 levels in the cytoplasmic and nuclear compartments and found that nuclear p65 is more abundant in Gaplinc-deficient cells compared to WT (Fig. 4H). Combined, these data suggest a mechanistic role for GAPLINC in priming the activation of critical IRGs.
Here, we have identified GAPLINC as a conserved cytosolically expressed lncRNA in humans and mice that functions to control inflammatory gene expression through regulation of NF-κB. In comparison to reported cytosolic lncRNAs that impact translational efficiency by modulating protein expression or ribosome assembly (2122–23), we find Gaplinc is cytosolically contributing to p65 translational ability; however, the mechanism of interaction, either direct or indirect, remains to be determined. Our findings provide insights into how a functionally conserved lncRNA regulates the immune response and provide avenues of investigation for the development of therapeutics for endotoxic shock.
Pam3CSK4, PolyI:C, R848, and E. coli LPS were obtained from InvivoGen. NF-κB inhibitor (Bay 11-7082) was obtained from Millipore Sigma. Customized nCounter gene-expression code sets were obtained from Nanostring Technologies. β-actin and PCNA antibodies were obtained from Santa Cruz Biotechnology, Inc. I-κB-α and NF-κB p65 antibodies were obtained from Cell Signaling. IgG1 and NF-κB p65 IP antibodies were obtained from Santa Cruz Biotechnology, Inc.
Peripheral blood mononuclear cells (PBMCs) were isolated from the buffy coats of healthy blood donors (Stanford Blood Center) by Ficoll-Paque PLUS (GE Healthcare) density gradient centrifugation. The cells were washed three times in Hank's Balanced Salt Solution (HBSS) (Sigma Aldrich, H6648), resuspended in complete RPMI-1640 (Gibco, 11875093) supplemented with 5 mL penicillin/streptomycin (100×, Gibco, 15140122), 10% fetal calf serum (FCS) (Gibco, 16140-071), 12.5 mL Hepes (1 M, Gibco, 15630-080), 5 mL nonessential amino acids (NEAAs) (100×, Life Sciences, SH3023801), 5 mL GlutaMax (100×, Gibco, 35050-061), 5 mL Na-pyruvate (100 mM, Gibco, 11360-070), 500 μL ciprofloxacin (10 mg/mL, Acros, AC456880050), and plated onto 10-cm dishes. Nonadherent cells were aspirated after 2 h of incubation at 37 °C in 5% CO2. The remaining cells were expanded and cultivated in the presence of 50 ng/mL recombinant human M-CSF (R&D, 216-MC-025) to generate MDMs or recombinant human GM-CSF (R&D, 215-GM-050) to generate MDDCs. Cells were cultivated for 6 to 8 d, with the replacement of culture medium every 2 to 3 d.
THP-1s were cultured in complete RPMI 1640, supplemented with 5 mL pen/strep (100×), 10% FCS, and 2-mercaptoethanol (0.05 mM, Sigma-Aldrich, M6250). To induce differentiation, cells were seeded (1E6 cells/mL) with 100 nM PMA (Sigma-Aldrich) for 24 h.
BMDMs were generated by culturing erythrocyte-depleted BM cells in DMEM supplemented with 10% FCS, 5 mL pen/strep (100×), 500 μL ciprofloxacin (10 mg/mL), and 10% L929 supernatant for 7 to 12 d, with the replacement of culture medium every 2 to 3 d.
Cells were stimulated at the following concentrations: LPS, 200 ng/mL; Pam3CSK4, 200 ng/mL; poly(I:C), 50 μg/mL; R848, 1 μg/mL; and BAY 11-7082, 10 µM.
Cell lysates were prepared in RIPA buffer (150 mM NaCl, 1.0% Nonidet P-40, 0.5% sodium deoxycholate, 0.1% SDS, 50 mM Tris-HCl [pH 7.4], and 1.0 mM EDTA) containing protease-inhibitor mixture (Roche, 5892791001) and quantified using Pierce Bicinchoninic Acid Assay assay (Thermo Fisher, 23225). When indicated, the NEPER kit (Thermo Fisher Scientific, 78833) supplemented with protease inhibitor mixture (Roche) or 100 U/mL SUPERase-In (Ambion, AM2694) was used for cellular fractionation prior to Western blotting or qPCR analysis. Equivalent amounts (3 μg) of each sample were resolved by SDS-PAGE and transferred to polyvinylidene difluoride membranes using Trans-Blot Turbo Transfer System (Bio-Rad). Membranes were blocked with PBS, supplemented with 5% (wt/vol) nonfat dry milk for 1 h, and probed with primary antibodies overnight with either I-κB-α (1:1,000, Cell Signaling, L35A5) or NF-κB p65 (1:1,000, Cell Signaling, L8F6). Horseradish peroxidase-conjugated β-actin (1:500, Santa Cruz Biotechnology, sc-47778) or PCNA (1:1,000, Santa Cruz Biotechnology, sc-56) were used as loading controls. Horseradish peroxidase-conjugated goat anti-mouse (1:10,000, Bio-Rad, #1721011) or anti-rabbit (1:10,000, Bio-Rad, #1706515) secondary antibodies were used. Western blots were developed using Amersham enhanced chemiluminescence (ECL) Prime chemiluminescent substrate (GE Healthcare, 45-002-401) or Pierce ECL (Life Technologies, 32106). ImageJ (rsbweb.nih.gov/ij/) analysis was performed to quantify band intensities for each Western blot.
Total RNA was purified from cells or tissues using Direct-zol RNA MiniPrep Kit (Zymo Research, R2072) and TRIzol reagent (Ambion, T9424) according to the manufacturer’s instructions. RNA was quantified and assessed for purity using a nanodrop spectrometer (Thermo Fisher). Equal amounts of RNA (500 to 1,000 ng) were reverse transcribed using iScript Reverse Transcription Supermix (Bio-Rad, 1708841), followed by qPCR using iQ SYBR Green Supermix reagent (Bio-Rad, 1725122) with the following parameters: 50 °C for 2 min and 95 °C for 2 min, followed by 40 cycles of 95 °C for 15 s, 60 °C for 30 s, and 72 °C for 45 s, followed by melt-curve analysis to control for nonspecific PCR amplifications. Oligos used in qPCR analysis were designed using Primer3 Input version 0.4.0 (https://bioinfo.ut.ee/primer3-0.4.0/). Primer sequences are provided in SI Appendix, Table S1.
Gene expression levels were normalized to Gapdh or Hprt as housekeeping genes.
RNA-Seq was performed in monocytes, MDMs, and MDDCs. The data are accessible at the National Center for Biotechnology Information (NCBI) Gene Expression Omnibus (GEO) database, accession GSE147310.
RNA-Seq was performed in biological duplicates in MDMs treated with siRNA nontargeting control and pooled GAPLINC siRNAs. Total RNA (1 μg) was used to generate libraries using the NEXTflex Rapid Directional RNA-Seq kit (Bioo Scientific, 5138-07). Samples were quality assessed using Bioanalyzer (Agilent) and read on a High-SEq 4000 (Illumina) as single-end 50-bp reads. Transcripts were aligned to the human genome (assembly GRCh37/hg19) using Spliced Transcripts Alignment to a Reference (STAR). Differential gene-expression analyses were conducted using DESeq2. GO enrichment analysis was performed using PANTHER. Data were submitted to GEO, accession GSE150572.
RNA-Seq was performed in biological duplicates in THP-1 cells untreated and treated with PMA (100 nM) for 24 h. Total RNA (1 μg) was used to generate libraries using the Bioo kit. Samples were quality assessed using a Bioanalyzer and read on a High-SEq 4000 as single-end 50-bp reads. Transcripts were aligned to the human genome (assembly GRCh37/hg19) using STAR. Differential gene-expression analyses were conducted using DESeq2. Data were submitted to GEO, accession GSE150571.
RNA-Seq was performed in biological triplicates in WT BM and BMDM cells. Total RNA (1 μg) was used to generate libraries using the Bioo kit. Samples were quality assessed using TapeStation (Agilent) and read on a High-SEq 4000 as paired-end 150-bp reads. De novo transcript assembly was performed using SPAdes. Transcripts were aligned to the mouse genome (assembly GRCm38/mm10) using Minimap2. Visualization of the alignments was prepared using custom scripts. For differential expression analysis, sequencing reads were aligned to the mm10 mouse genome and analyzed using DEseq2. Data were submitted to GEO, accession GSE150573.
RNA-Seq was performed in biological triplicates in WT and Gaplinc-KO BMDMs at 0 and 6 h after LPS treatment (200 ng/mL). RNA-Seq libraries were generated and quality assessed as described above and read on a High-SEq 4000 as paired-end 150-bp reads. Sequencing reads were aligned to the mouse genome (assembly GRCm38/mm10) using STAR. Differential gene-expression analyses were conducted using DESeq2. GO enrichment analysis was performed using PANTHER. Data were submitted to GEO, accession GSE150574.
ATAC-Seq was performed in MDMs stimulated with LPS and R848 for 0, 2, 6, and 18 h. Data are accessible at NCBI GEO database, accession GSE147310.
RNA was isolated as described previously. The nCounter analysis multiplex system was used to directly measure mRNA levels using a custom code set for 136 lncRNAs. Total RNA (100 ng) was hybridized overnight with the custom code set and analyzed on an nCounter Digital Analyzer (Nanostring Technologies). RNA hybridization, data acquisition, and analysis were performed in accordance with the manufacturer’s specifications. RNA counts were processed to account for hybridization efficiency, and mRNA expressions across each condition were normalized to the geometric mean of five housekeeping genes. Heatmap analysis of normalized mRNA counts was prepared using Gene-E (https://www.broadinstitute.org/cancer/software/GENE-E/).
On day 3 of differentiation, human MDMs were transfected with 25 nM siRNA using Lipofectamine 2,000 (Life Technologies, 11668027). Silencer Select Negative-Control siRNA (Life Technologies) was used as a control. Transfection was allowed to proceed for 72 h, and then RNA was isolated as previously described to create sequencing libraries and assess kd efficiency by qPCR. The siRNA sequences are as follows: siGAPLINC_1, GAAGAAAACCUGGAAGUUATT; siGAPLINC_2, GAACAAUGAAGAAACCAAATT; and siGAPLINC_3, GGAUUAUGUGGUUUGUAAATT; >GAPLINC (ENST00000579007.5): AGCCAATGCCTGAAATAATGAACTCCTCCAAGGCAAGAAATCTGTTTTGAAGCTTCTCTGCGTTCACACACAGCAGCCTGGTTTCCTGGAAGGGCATTTTCCACATTGTGCGTTATGGATGATCATCCCAGGCATCAGGTGTGAAGCCCTGCATCCACATCCAGGGGCTATCAAATCTCTCTGCAAAAGGAGAAGCTGGACTCAGGCACGTTTACAGTGATGTGTATGCAGTTCTGTGAAGGAAGCTGCAGAAGAAAAAGGTGAAAGAGGTG.
AGGAAGCTGCAGAAGAAAACCTGGAAGTTAGCAGAGCTTGATCCAGAGGTTTAAGGAAAGAAGCCATCTCCATAACATAAAAGTGCAAGGTGAAGCAGCAAGTGCTGATGGGGAAGCTGCAGCAAGTCATCCAGAAGATCTTGCTAAGGGTATGCACAGATGTGGAAACAGGAACTGATGTGTCCATTACACCACTAGGAC.
AGAGGCCAGAACAATGAAGAAACCAAATACTTGGAAGAGGGTAGAGATAATGAATGGAGTCCAAGA.
GCCCTGATTGTGCCATAAATGTCCAGATAATTCCATACCTGAGGATTATGTGGTTTGTAAACTTGGCACTTAGAAGAACCAATAAAATCATGTTATAGTTTCAA.
We designed three single guide RNAs (sgRNAs) to target the transcription start site of GAPLINC and one control gRNA as follows: control (CTL) gRNA, GCCATGGACACTCCCCTTTG; GAPLINC gRNA1, GAGTTCATTATTTCAGGCAT; GAPLINC gRNA2, TGAAATAATGAACTCCTCCA; and GAPLINC gRNA3, AAACAGATTTCTTGCCTTGG.
sgRNA oligos were obtained from Integrated DNA Technologies (IDT) with the following format: forward oligo TTGG-N20, reverse oligo AAAC-N20 (reverse complement). The destination vector was digested overnight with AAR1 (Thermo Fisher). Oligos were diluted to 100 μM, and 50 μL forward and reverse oligos were annealed with 900 μL buffer (10 mM Tris, pH 7.5) and placed at 98 °C for 3 min, then room temperature for 10 min. Oligos (8μL) were then ligated into the digested vector (1 μL) using T4 ligase (1 μL) and transformed into DH5alpha cells. Colonies were selected, DNA was prepared, and the sequences were confirmed.
Human embryonic kidney (HEK293T) cells were seeded at 6,000,000 cells per plate in 15-cm dishes in 20 mL media (DMEM, 10% fetal bovine serum [FBS]) and incubated overnight at 37 °C, 5% CO2. The next morning, 8 µg sgRNA library plasmid, 4 µg psPAX2 (Addgene #12260), 4 µg pMD2.G (Addgene #12259), and 80 µL lipofectamine 2000 (Invitrogen) were mixed into 1 mL serum-free OptiMEM (Gibco), vortexed, and incubated for 20 min at room temperature and added to the cells. At 72 h post-transfection, supernatant was harvested and passed through 0.45-μm filters (Millipore, Stericup), and aliquots were stored at −80 °C. THP-1-Cas9/Krab cells were infected with indicated guide-expressing lentivirus and stimulated with PMA (1 μM) for 24 h prior to harvesting for RNA. Total cellular RNA from THP-1 cell lines was isolated and qPCR was performed as outlined above.
The sequence of GAPLINC (Gene ID: 100505592) was cloned into pSico bidirectional vector for stable expression in mammalian cells. The GAPLINC overexpression construct contains an EF1a promoter expressing zeocin resistance and GFP as a selection marker. Sequences were verified by DNA sequencing (Sequetech). HEK293T (4 × 10⁵ cells) in 6-well plates were transfected with pSico vector expressing GAPLINC (0.5 µg) and packaging plasmids psPAX (0.5 µg) and pMD2.G (0.5 µg), using Lipofectamine per manufacturer’s instructions (Life Technologies). Viral supernatants were collected 72 h post-transfection and filtered through a 0.45-µM nitrocellulose filter (Millipore). THP-1 cells were transduced, and stable integrants were selected with zeocin (200 µg/mL) or based on GFP expression.
The concentration of IL-6 in the supernatant of THP-1 cells was determined using the DuoSet ELISA kit (R&D, DY206) according to the manufacturer’s instructions. The concentration of CRP, IL-6, and IL-1β levels in the serum of WT and Gaplinc-KO mice was determined using the DuoSet ELISA kits (R&D, DY1829, DY406, and DY401) according to the manufacturer’s instructions. The concentration of lactate levels in the serum of WT and Gaplinc-KO mice was determined using l-Lactate Assay Kit (Abcam, ab65331).
Prior to lysis, MDMs were treated with cycloheximide (100 mg/mL) for 10 min at 37 °C in 5% CO2. Cells were washed three times with ice-cold PBS and lysed in buffer containing 0.5% Nonidet P-40, 20 mM Tris-HCl (pH 7.5), 100 mM KCl, and 10 mM MgCl2. Lysates were passed three times through a 23G needle and incubated on ice for 7 min. Extracts were centrifuged at 10,000 rpm for 7 min at 4 °C. The supernatant was collected as crude cytosolic extract. Cytosolic extracts were overlaid on 10 to 50% sucrose gradients (Gradient Station, Biocomp Instruments), prepared in 20 mM Tris-HCl, 100 mM KCl, and 10 mM MgCl2 buffer, and ultracentrifuged at 40,000 RPM for 1 h 20 min at 4 °C using an SW41 rotor in a Beckman ultracentrifuge. Individual polyribosome fractions were subsequently purified using a Gradient Station (Biocomp Instruments). Total cellular RNA from MDMs was isolated as previously described, followed by qPCR.
C57BL/6 mice were purchased from the Jackson Laboratory (Bar Harbor, ME) and bred at the University of California, Santa Cruz (UCSC). Mouse strains were maintained under specific pathogen-free conditions in the animal facilities of UCSC and protocols performed in accordance with the guidelines set forth by UCSC and the Institutional Animal Care and Use Committee.
Gaplinc-KO mice were produced at the Gladstone Institute (San Francisco, CA) using CRISPR/Cas9 on a C57BL/6 background. Superovulated females (∼4 wk old) were mated to C57BL/6 stud males, and fertilized zygotes were collected from oviducts. In vitro–transcribed sgRNAs (15 to 30 ng/μL) and Cas9 protein (15 to 30 ng/μL) were mixed and coinjected into the pronucleus of fertilized zygotes. After the injection procedure, zygotes were implanted into oviducts of pseudopregnant CD1 female mice.
The single guide RNA (sgRNA) constructs were constructed from a pSico lentiviral backbone driven by an EF1a promoter expressing T2A flanked genes, puromycin, and mCherry. sgRNAs were expressed from a mouse U6 promoter. Cloning of 20 nucleotide sgRNA spacer forward/reverse oligos were annealed and cloned via the AarI site. The sgRNA oligos were designed by inserting a T7 promoter sequence upstream of the gRNA template by PCR amplification. The PCR product consisting of a T7 gRNA sequence was purified with solid phase reversible immobilization (SPRI) beads and used as the template for in vitro transcription. In vitro transcription was performed using MEGAshortscript T7 Transcription Kit (Thermo Fisher) following the manufacturer’s instructions. The gRNAs were purified using MEGAclear Transcription Clean-Up Kit (Thermo Fisher) and resuspended in elution buffer followed by an additional ammonium acetate precipitation to concentrate the RNA. The concentrated gRNA was resuspended in nuclease-free water and prepared at a concentration approximate to 2 μg/μL.
The sgRNA target sequences are as follows: gRNA 1, CAGATTTCTTCGTCCAGAGG; gRNA 2, ACTCAGATTTCTTCGTCCAG; gRNA 3, TGTTAATTTGAGCCCGCAAA; gRNA 4, TTCCCAGGCAGGTGCTGCGC; gRNA 5, ACTATAAATTGCGAAATGAT; and gRNA 6, AAATGATTGGATTGAGCTTA.
The offspring mice were examined by genotyping PCR. Genomic DNA was extracted from mouse tails using Chelex (Bio-Rad, #143-2832), supplemented with Tween-20 (Thermo Fisher) and Proteinase K (ProK) (Thermo Fisher), followed by an incubation at 50 °C for 1 h. ProK was heat inactivated at 70 °C for 15 min. PCR analysis was conducted using 1 μL the Chelex mix as DNA template, genotyping primers (0.5 μM), and 2× KAPA-TAQ master mix (KAPA biosystems) using the standard PCR protocol. PCR products were gel purified and confirmed by sequencing (Sequetech).
Genotyping primer sequences are as follows: FP, TCACATCACCTTCCGCCAGC; RP, CCAAAGTTACATGCATGACATATCC; Ex1R, AAGATGAGCCGGTTTGCTGTG; and FPV2, CCGAGATTACAGTCGGTTGTG.
Flow cytometry analysis of nontargeting control and siGAPLINC-treated MDMs stained with CD11B FITC (Thermo Fisher), CD16 PE (Thermo Fisher), and CD14 FITC (Biolegend).
Blood was collected immediately postmortem by cardiac puncture, and single-cell suspensions prepared from the spleen of WT and Gaplinc-KO mice were depleted of red blood cells (RBCs) prior to staining. Fragment, crystallizable (Fc) receptors were blocked (anti-CD16/32, BD Pharmingen) prior to staining with LIVE/DEAD Fixable Aqua Dead Cell Stain (Thermo Fisher), anti–CD11b-AlexaFluor 700, anti–LY6G-BV421, anti–LY6C-AlexaFluor 488, anti–CD19 PerCP-Cy5.5, anti–CSF-1R APC (BioLegend), anti–CD3-PE (BD), anti–SiglecF BV650 (BD OptiBuild), and anti–F4/80 PE-eFluor 610 (eBioScience).
Flow cytometry analysis of peritoneal fluid isolated from WT and Gaplinc-KO mice (24) challenged with LPS i.p. for 18 h was performed; cells were stained with anti–CD11b-AlexaFluor 700 and anti–F4/80 PE-eFluor 610 (eBioScience).
Flow cytometry analysis of BMDMs harvested from WT and Gaplinc-KO mice was performed; cells were stained with anti–CD11b-AlexaFluor 700 and anti–F4/80 PE-eFluor 610 (eBioScience).
Data acquisition was performed using Attune NxT (Thermo Fisher). Analysis was performed using FlowJo analysis software (BD Biosciences).
WT and Gaplinc-KO BMDMs were cultured as described above. Cells were then administered with pHrodo Green E. coli BioParticles (Invitrogen) conjugates for 0, 15, 30, and 60 min at 37 °C. pHrodo green fluorescence, a measure of E. coli in an acidified phagosome, was examined by flow cytometry.
Age- and sex-matched WT and mutant mice (10 to 12 wk old) were i.p. injected with PBS as a control or E. coli LPS (5 mg/kg/animal or 20 mg/kg/animal). For gene expression and cytokine analysis, mice were euthanized 6 h or 18 h postinjection. Blood was collected immediately postmortem by cardiac puncture. Serum was submitted to Eve Technologies for cytokine analysis.
Age- and sex-matched WT and Gaplinc-KO mice (∼10 wk old) were i.p. injected with PBS as a control or E. coli LPS (5 mg/kg/animal). Mice were euthanized 18 h postinjection. Blood was collected immediately postmortem by cardiac puncture. Citrated plasma was submitted to the UC San Diego Murine Hematology and Coagulation Core Laboratory to perform aPTT tests.
Anti-sense probes 20 nt in length targeting GAPLINC and nonspecific LacZ were designed using Stellaris with default parameters (https://www.biosearchtech.com/support/tools/design-software/stellaris-probe-designer). These probes were synthesized with a 3′ biotin-TEG modification by IDT.
Oligonucleotide sequences targeting human GAPLINC are as follows: Probe 1, AAGAGGATGTGTCAGATCCT; Probe 2, TCAAAACAGATTTCTTGCCT; Probe 3, CTCCTTTTGCAGAGAGATTT; Probe 4, CCTGGGATGATCATCCATAA; Probe 5, ATCACTGTAAACGTGCCTGA; Probe 6, TGGTTTCTTCATTGTTCTGG; Probe 7, CCACATAATCCTCAGGTATG; Probe 8, TATTGGTTCTTCTAAGTGCC; and Probe 9, TAATGGACACATCAGTTCCT.
Oligonucleotide sequences targeting mouse Gaplinc are as follows: Probe 1, CTTTGATCAACGTGCTCACAG; Probe 2, TGTTAATTTGAGCCCGCAAAG; Probe 3, CAAGGTTCATTTCCAAATACTC; Probe 4, ATGACTCCAAGCGTTCTTAAAG; Probe 5, AGAATAGGAGTTGGGTGTGGTT; Probe 6, AATCCTGGATAGCAGTGAAATG; Probe 7, CCAATCATTTCGCAATTTATAG; and Probe 8, AAGCTTTAATACCTTAAGCTCA.
Oligonucleotide sequences targeting LacZ are as follows: Probe 1, TTCAGACGGCAAACGACTGT; Probe 2, TGATGCTCGTGACGGTTAAC; Probe 3, TCAGTTGCTGTTGACTGTAG; Probe 4, CCAGTGAATCCGTAATCATG; Probe 5, AATGTGAGCGAGTAACAACC; and Probe 6, GTAGCCAGCTTTCATCAACA.
Modified ChIRP was conducted (25, 26) by cross-linking macrophages (10 to 20 × 106 cells) with 3% formaldehyde and lysing cells in buffer containing 50 mM Tris-HCl (pH 7.0), 0.5 M EDTA, 2% SDS, protease inhibitor mixture (P.I.) (1:200, Roche), PMSF (1:100), and SUPERase-In (100 U/mL, Ambion). Cell lysates were sonicated in a 4 °C water bath at the highest setting with 30 s on/45 s off pulse intervals for 12 cycles. Each run was performed twice. The lysates were spun at 4 °C at 16,100 relative centrifugal force (RCF) for 10 min, and cleared lysates were flash-frozen in liquid nitrogen and stored at −80 °C.
Thawed lysate was added to hybridization buffer containing 50 mM NaCl, 1% SDS, 50 mM Tris-Cl (pH 7.0), 1 mM EDTA, 15% formamide, P.I. (1:200), PMSF (1:100), and SUPERase-In (100 U/mL). Probes (1 μL of 100 μM probe mix) were added to each tube and shaken for 4 h at 37 °C for hybridization. Prewashed Dynabeads MyOne Streptavidin C1 (Thermo Fisher, 65001) were added to each tube (50-μL beads) and incubated with shaking for an additional 30 min at 37 °C. Next, the beads were washed five times in buffer containing saline-sodium citrate (SSC) (1×, GBiosciences, 786-023) and 0.5% SDS (Thermo Fisher, 15553027).
For RNA extraction, beads and control input samples were resuspended in ProK buffer (10 mM Tris-HCl, pH7.0, 100 mM NaCl, 1 mM EDTA, 0.5% SDS), supplemented with ProK (5 μL in 100 μL ProK Buffer), and incubated at 50 °C for 45 min, followed by 95 °C for an additional 10 min on a heat block. Samples were removed to ice and then isolated with TRIzol. RNA fraction was used to confirm efficiency of pulldown with qPCR or construct small RNA libraries using RealSeq preparation kit (SomaGenics). Libraries were quality assessed using TapeStation (Agilent) and read on a NextSeq System (Illumina). Sequencing data are provided as an Excel file (muChIRP_small_RNA_lib_quantification).
For protein elution in human macrophage samples, the beads were resuspended in Bolt LDS/Sample Reducing Agent loading buffer (Life Technologies) supplemented with 200 mM NaCl, vortexed at 1,200 rpm, then incubated at 65 °C for 1 h followed by 95 °C for 10 min. Protein samples were size separated in SDS-PAGE gels followed by Pierce silver staining (Life Technologies). Unique bands present in the experimental lane were extracted along with the corresponding region in the control lane and submitted to the Stanford University Mass Spectrometry Laboratory for mass-spectrometry identification.
For protein elution in mouse macrophage samples, the beads were resuspended in biotin elution buffer (12.5 mM D-biotin, 7.5 mM Hepes, 75 mM NaCl, 1.5 mM EDTA, 0.15% SDS, 0.075% sarkosyl, and 0.02% Na-deoxycholate). Proteins were eluted from beads at room temperature with mixing for 20 min, followed by an incubation at 65 °C for 10 min.
Trichloroacetic acid (TCA) (25% vol/vol) was added to the clean eluent to precipitate overnight at 4 °C. Proteins were pelleted at 16,000 RCF at 4 °C for 30 min, washed with cold acetone, and pelleted again at 16,000 RCF at 4 °C for 5 min. Protein pellets were resuspended in 5% SDS and 50 mM Ammonium bicarbonate and submitted to the UC Davis Proteomics Core (https://proteomics.ucdavis.edu/) for mass-spectrometry identification.
We thank A.J. Crawford for help with generating Circos plots to visualize RNA-Seq data and all members of the Carpenter Laboratory. We thank Dr. Judith Hellman for her helpful insights into mechanisms occurring during sepsis. This work was supported by the NIH (R21AR070973, R01AI148413, to S. Carpenter). A.C.V. was supported by the NIH Predoctoral Training Grant (T32 GM008646), the Ford Predoctoral Fellowship, and the Howard Hughes Medical Institute Gilliam Fellowship.
Anonymized RNA-Seq and ATAC-Seq data have been deposited in Sequence Read Archive and GEO (PRJNA559668 [SRA], GSE150572 [GEO], GSE150573 [GEO], GSE150574 [GEO], and GSE147310 [GEO]).
1.
2
3
4
5
6
7
8
9
11
12
13
14
15
16
17
18
19
20
21
22
23
25
 A conserved long noncoding RNA, GAPLINC, modulates the immune response during endotoxic shock
 Facebook
 Twitter
 Linkedin
 Whatsapp
