 Phyllotactic patterning of gerbera flower heads
Proceedings of the National Academy of Sciences of the United States of America


Edited by Dominique C. Bergmann, Stanford University, Stanford, CA, and approved February 22, 2021 (received for review August 2, 2020)
Author contributions: T.Z., P.E., and P.P. designed the project; T.Z., T.H.T., P.E., and P.P. designed the experiments; S.K.B. and T.H.T. cloned the DR5 construct; F.W. cloned the GhCLV3 construct and conducted the in situ hybridization; T.Z. carried out all other experiments; M.C., A.O., and P.P. constructed computational and mathematical models; T.Z., M.C., P.E., and P.P. analyzed experimental data and modeling results; and T.Z., M.C., A.O., P.E., and P.P. wrote the paper.
1T.Z. and M.C. contributed equally to this work.

- Altmetric
Flower heads, such as those of gerbera or sunflower, comprise hundreds of bracts and florets. They are organized into conspicuous spiral patterns with intriguing mathematical properties: For example, the numbers of left- and right-winding spirals are typically consecutive Fibonacci numbers. We examined auxin reporter lines of gerbera and combined diverse microscopy and modeling techniques to understand how these patterns develop. The critical process is the early patterning of bracts, which emerge in a specific order and guide the placement of the subsequent bracts and florets. This process, controlled by expansion and contraction of the organogenetic zone during head growth, is different from the extensively studied phyllotactic patterning in the model plants Arabidopsis and tomato.
Phyllotaxis, the distribution of organs such as leaves and flowers on their support, is a key attribute of plant architecture. The geometric regularity of phyllotaxis has attracted multidisciplinary interest for centuries, resulting in an understanding of the patterns in the model plants Arabidopsis and tomato down to the molecular level. Nevertheless, the iconic example of phyllotaxis, the arrangement of individual florets into spirals in the heads of the daisy family of plants (Asteraceae), has not been fully explained. We integrate experimental data and computational models to explain phyllotaxis in Gerbera hybrida. We show that phyllotactic patterning in gerbera is governed by changes in the size of the morphogenetically active zone coordinated with the growth of the head. The dynamics of these changes divides the patterning process into three phases: the development of an approximately circular pattern with a Fibonacci number of primordia near the head rim, its gradual transition to a zigzag pattern, and the development of a spiral pattern that fills the head on the template of this zigzag pattern. Fibonacci spiral numbers arise due to the intercalary insertion and lateral displacement of incipient primordia in the first phase. Our results demonstrate the essential role of the growth and active zone dynamics in the patterning of flower heads.
The most common type of phyllotaxis—spiral phyllotaxis—is observed across the plant kingdom from algae to angiosperms (1). Its distinctive feature is the arrangement of organs in left- and right-winding spirals called (contact) parastichies (2). At the remarkable intersection of biology and mathematics, the numbers of parastichies are typically two consecutive elements of the Fibonacci sequence 1, 2, 3, 5, 8, 13, 21, 34, 55,....
The development of phyllotactic patterns has been the subject of extensive experimental and theoretical studies (3456–7). It is particularly well understood, down to the molecular level, in Arabidopsis and tomato (8, 9). In these plants, organ primordia emerge sequentially at the periphery of a dome-shaped meristem located at the tip of a growing shoot, giving rise to a spiral pattern with low parastichy numbers, e.g., 3/5 in the flowering shoot of Arabidopsis (10). In contrast, florets in the heads of the Asteraceae family are arranged in patterns with much higher parastichy numbers, up to 89/144 in the sunflower (11). As observed by Kuhlemeier (12), the development of these patterns has not been fully understood.
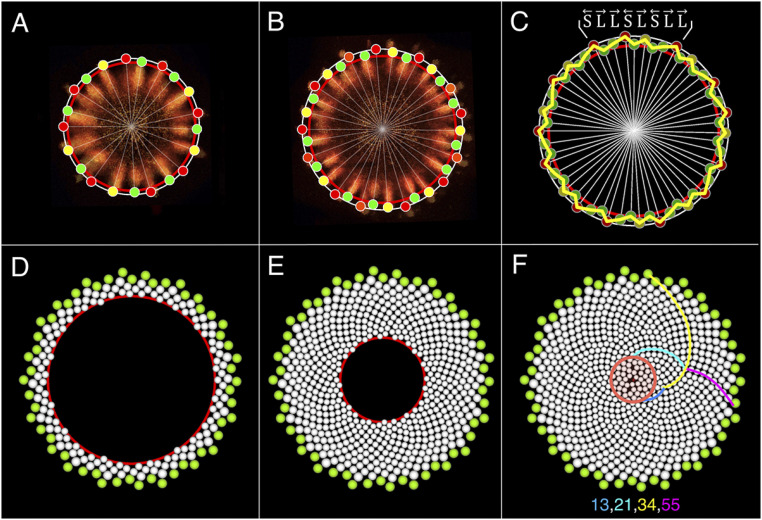
The seminal idea behind explanations of phyllotaxis is due to Hofmeister (13), who proposed that new primordia emerge at locations that are sufficiently distant from the primordia formed earlier. Snow and Snow (14, 15) refined this hypothesis by postulating that new primordia are inserted as soon as space becomes available for them within the growing apical meristem. The resulting process is commonly abstracted as an iterative addition—also referred to as accretion (16, 17) or stacking (7, 18)—of new elements at the distal boundary of a spiral lattice (Fig. 1A). van Iterson (19) showed that, if the circumference of this lattice compared to the size of the added organs gradually increases, the number of parastichies will progress according to the Fibonacci sequence. This observation lies at the base of current theories explaining the prevalence of Fibonacci numbers in phyllotaxis, cf. refs. 7 and 2021–22. In the flower heads of some species in the Aster family, however, patterns with relatively high Fibonacci parastichy numbers emerge outside the context of a gradually built-up lattice (Fig. 1B). Previous attempts to capture this process required an a priori assumption of the golden divergence angle between consecutive primordia (2324–25) or produced whorls rather than spirals (26), leaving open the question of how the observed patterns arise.

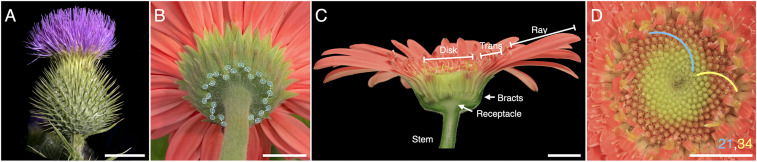
Problem position and the model system. (A) Example of a spiral phyllotactic lattice. Bracts in the flower head of Cirsium vulgare (common thistle) are arranged into a circular lattice that originates at the stem, possibly continuing the pattern of leaves, and extends by the addition of new elements at its distal boundary. The development of such patterns is largely understood. Image credit: Jouko Rikkinen, University of Helsinki/Finnish Biodiversity Information Facility, licensed under CC BY-NC 4.0 (B) The arrangement of bracts in gerbera. A pattern with a relatively high Fibonacci number of visible parastichies (13) is not preceded by a lattice. The development of such patterns has remained an open problem. (C and D) Gerbera head morphology. (C) Longitudinal section of the head. The head resembles a solitary flower, but comprises three types of florets (ray, trans, and disk) attached to a receptacle and surrounded by bracts. (D) The disk florets are arranged in a spiral phyllotactic pattern, with parastichies (representatives highlighted) occurring in Fibonacci numbers. (Scale bars: 1 cm.)
Looking for an explanation, we selected Gerbera hybrida as a model plant due to its susceptibility to genetic transformation. A mature gerbera head comprises 600 to 700 individual florets of three different types, attached to a large receptacle (1.5 cm in diameter) surrounded by 80 to 90 leaflike involucral bracts (Fig. 1C). The florets are arranged in spirals (Fig. 1D), with up to 34/55 parastichies near the head rim. The head is supported by a leafless stem (scape), which may appear in a terminal or lateral position in the shoot (SI Appendix, Fig. S1). In the latter case, the scape constitutes the whole growth axis, which suggests that the phyllotactic pattern in the heads develops de novo. The separation of the head from the vegetative part of the plant and the large number of parastichies add to the usefulness of gerbera as a model system for studying phyllotaxis.
Results
Head Development.
To understand how the phyllotaxis in gerbera emerges, we obtained high-resolution X-ray microcomputed tomography (micro-CT), scanning electron microscopy (SEM), and confocal microscopy images of gerbera heads at different stages of development. The growing receptacle can be divided into the outer zone, in which bract and floret primordia have already differentiated, and the still-undifferentiated central zone. The boundary between the two zones is the pattern front (Fig. 2A). Initially, the receptacle is “naked,” with no visible primordia (Fig. 2 A and B, stage I). Up to 13 bract primordia then emerge approximately simultaneously* near the receptacle rim (stage II). As the head grows, subsequent primordia are inserted between those initiated earlier, positioned slightly inward with respect to their older neighbors (stages III to V). The pattern front then gradually moves away from the head rim, initiating a lattice with visible parastichies (stage VI), and eventually contracts, extending the lattice to the head center (stages VII to IX). The number of parastichies decreases in discrete steps, following the reversed Fibonacci sequence. Near the center, the pattern becomes chaotic (stage IX). With the entire head surface consumed by primordia, the pattern front and the central zone disappear. Beginning at stage III, the receptacle changes shape from a dome to a flattened form overhanging the stem. This change carries bracts from the upper to the lower side of the receptacle. The overall dynamics of gerbera head development and patterning is thus similar to that of sunflower (11, 27), except that the sunflower receptacle is concave rather than convex.
![Development of gerbera flower heads from an early (I) to the fully patterned (IX) stage. (A) Micro-CT cross-sections. Arrows and colors indicate different zones within the head. (B) SEM images. Black lines on red background highlight parastichies (stages VI to VIII); black dots mark primordia chaotically distributed near the head center (stage IX). [Scale bars: 1 mm (A); 500 μm (B).]](/dataresources/secured/content-1766004901385-41dd6e8e-8758-4d67-b1d2-e101fffb206c/assets/pnas.2016304118fig02.jpg)
Development of gerbera flower heads from an early (I) to the fully patterned (IX) stage. (A) Micro-CT cross-sections. Arrows and colors indicate different zones within the head. (B) SEM images. Black lines on red background highlight parastichies (stages VI to VIII); black dots mark primordia chaotically distributed near the head center (stage IX). [Scale bars: 1 mm (A); 500 m (B).]
Pattern Initiation.
An intriguing element of the developmental sequence is the approximately simultaneous emergence of up to 13 primordia at the receptacle rim in stage II. To analyze processes leading to this emergence, we focused on the plant hormone auxin, which plays a key patterning role in Arabidopsis and tomato (8, 282930–31). Hypothesizing that this role is conserved in Asteraceae, we created transgenic gerbera plants expressing the DR5rev::3XVENUS-N7 auxin reporter (28) and confirmed that it is responsive to auxin in gerbera (SI Appendix, Fig. S2). As in Arabidopsis and tomato, the DR5 signal localizes to incipient organ primordia (initia) in gerbera before their outgrowth (Fig. 3). To investigate how the DR5 pattern develops, we analyzed confocal images of 56 randomly chosen heads with up to 34 DR5 maxima (SI Appendix, Fig. S3A). Our data show that, setting differences in the chirality of heads aside, relative positions of DR5 maxima in images with the same number of maxima are similar. This indicates that the early patterning of gerbera heads is stereotypical, and the developmental sequence can be reconstructed from superimposed (SI Appendix, Fig. S3B) or representative (Fig. 4A) images of different heads.
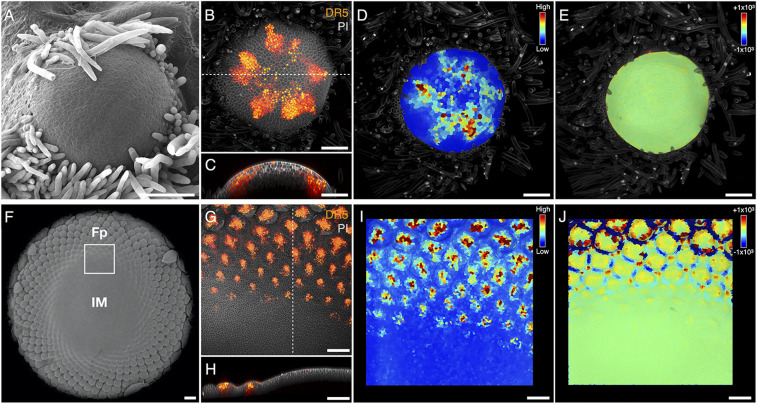
Patterning of primordia precedes their outgrowth. (A) SEM image of a head in an early developmental stage shows no visible organ primordia. (B) Confocal image of the head meristem in the same developmental stage shows eight DR5 maxima. The cell walls are highlighted using PI staining. (C) The optical section of meristem (B) confirms the absence of primordia outgrowth and the presence of DR5 maxima. (D and E) Visualization of DR5 signal intensity in the meristem epidermis (D) and Gaussian curvature of the meristem surface (m−2) (E) further demonstrates the presence of DR5 maxima in the absence of primordia outgrowth. (F–J) The images corresponding to A–E at a later developmental stage. Fp, outer zone with differentiated floret primordia; IM, undifferentiated inflorescence meristem (central zone). The white box in F indicates the magnified area visualized in G–J. A comparison of images I and J shows that morphological changes are significantly delayed with respect to the patterning of auxin maxima, as in D and E. (Scale bars: 100 m.)
![Analysis and model of early patterning in gerbera heads. (A) Confocal images of representative heads with up to 34 DR5 maxima indicating incipient primordia (initia). An expanding ring of maxima developing near the head rim reveals pattern progression not observed in SEM images (Fig. 2). Individual cells are stained by using PI. The initia are numbered by following the golden divergence angle; the numbers do not imply the exact order of emergence. (B–E) Analysis of pattern progression up to 13 initia. (B) Angular positions (mean values and standard deviations) of the initia in heads with Fibonacci initia numbers (SI Appendix, Fig. S3A). The angles are measured counterclockwise with respect to initium 1. Arrows indicate initia inserted in consecutive steps. (C) Normalized Gaussian kernel plots of the density of gap sizes between initia. (D) The developmental pattern represented as a lineage tree of short and long gaps between the initia. Arrows above the symbols point to the older neighboring initium. (E) The rules of pattern development represented as an L-system. (F) Details of DR5 pattern in the 13-initium stage. The newest initia tend toward their older neighbors. (G) Visualization of DR5 signal intensity in the meristem epidermis for initium P9 (boxed in F). Colors in the dashed wedge indicate the strength of the DR5 signal. (H) Schematic representation of the propagation of the DR5 signal toward the older neighbor. (I) Simulated distribution of the initia generated on the head rim, overlaid on superimposed DR5 images (as in SI Appendix, Fig. S3B). Color gradients on the rim (orange to red) relate the initia to their older neighbors, toward which they propagate. [Scale bars: 500 μm (A); 200 μm (F and G).]](/dataresources/secured/content-1766004901385-41dd6e8e-8758-4d67-b1d2-e101fffb206c/assets/pnas.2016304118fig04.jpg)
Analysis and model of early patterning in gerbera heads. (A) Confocal images of representative heads with up to 34 DR5 maxima indicating incipient primordia (initia). An expanding ring of maxima developing near the head rim reveals pattern progression not observed in SEM images (Fig. 2). Individual cells are stained by using PI. The initia are numbered by following the golden divergence angle; the numbers do not imply the exact order of emergence. (B–E) Analysis of pattern progression up to 13 initia. (B) Angular positions (mean values and standard deviations) of the initia in heads with Fibonacci initia numbers (SI Appendix, Fig. S3A). The angles are measured counterclockwise with respect to initium 1. Arrows indicate initia inserted in consecutive steps. (C) Normalized Gaussian kernel plots of the density of gap sizes between initia. (D) The developmental pattern represented as a lineage tree of short and long gaps between the initia. Arrows above the symbols point to the older neighboring initium. (E) The rules of pattern development represented as an L-system. (F) Details of DR5 pattern in the 13-initium stage. The newest initia tend toward their older neighbors. (G) Visualization of DR5 signal intensity in the meristem epidermis for initium P9 (boxed in F). Colors in the dashed wedge indicate the strength of the DR5 signal. (H) Schematic representation of the propagation of the DR5 signal toward the older neighbor. (I) Simulated distribution of the initia generated on the head rim, overlaid on superimposed DR5 images (as in SI Appendix, Fig. S3B). Color gradients on the rim (orange to red) relate the initia to their older neighbors, toward which they propagate. [Scale bars: 500 m (A); 200 m (F and G).]
Within the set of 56 heads, the distribution of initia numbers was highly nonuniform: 45 out of the 56 observed heads had a Fibonacci number of initia (SI Appendix, Fig. S3A). The probability that they were drawn from a set with uniformly distributed initia numbers is less than 0.001, according to the goodness-of-fit test. These data indicate that early initia in gerbera tend to emerge in discrete steps, jumping from one Fibonacci number to the next through bursts of concurrent meristematic activity. The intermediate stages with non-Fibonacci numbers occur transiently.
Up to the 13-initium stage, the initia are arranged near the head rim in an approximately circular pattern: The differences in their radial positions are small (Fig. 4A). In contrast, gaps between neighboring initia have a bimodal distribution and can be categorized as short (S) or long (L) at every developmental stage (Fig. 4 B and C). The progression of the pattern of gaps over time is summarized by the lineage tree in Fig. 4D. In each step of development, a new initium emerges in every gap L, dividing it into a new pair of gaps L and S. Meanwhile, short gaps S elongate and become long gaps L. From these observations we infer the following:
•Gap numbers progress in discrete steps (bursts) consisting of concurrent events of type S L and L L + S. This progression is analogous to the archetypal example of the Fibonacci sequence—the growth of an idealized rabbit population—and thus explains the progression of gap and initia numbers according to this sequence.
•The spatiotemporal pattern of gaps coincides with the idealized pattern of long and short cells resulting from the asymmetric cell division in vegetative filaments of cyanobacterium Anabaena catenula (32); consequently, the early patterning of bract initia in gerbera is characterized by the same set of rules [L-system (33, 34); Fig. 4E], which adds a spatial component to Fibonacci’s population-level model. Arrows above the symbols, referred to as polarities, point to the older neighbor within each interval (created in an earlier burst)† and control the order of gaps resulting from the insertion of a new initium: LS or SL.
•To achieve full synchrony of initia insertion within each burst, a gap S of length must grow to length , becoming a gap L, in the same time over which gap L will reach the threshold length and subdivide into gaps L and S through the insertion of a new initium. Assuming that all gaps grow at the same rate, this condition will be satisfied if the gap lengths satisfy the equation , which implies that a newly inserted initium should divide the space between its neighbors according to the golden ratio.
Analyzing the spacing of initia further, we considered streaks of the DR5 signal (Fig. 4 F and G). The orientation of these streaks suggests that an initium emerges approximately halfway between its neighbors, but subsequently extends toward the older neighbor as the ring of initia expands (Fig. 4H). To test this hypothesis, we obtained time-lapse images of five individual heads in the earliest developmental stage at which such imaging was experimentally feasible. The images showed a gradual propagation of the DR5 signal in both radial and lateral directions, tending toward the older neighbor (Fig. 5). We verified that the actual outgrowth occurs near the distal (farther from the head center) streak end (SI Appendix, Fig. S4). Although the initial DR5 signal is too weak and amorphous to be located precisely, our observations indicate that the lateral displacement of initia is either the sole or a contributing factor inducing the asymmetric position of primordia with respect to their neighbors.
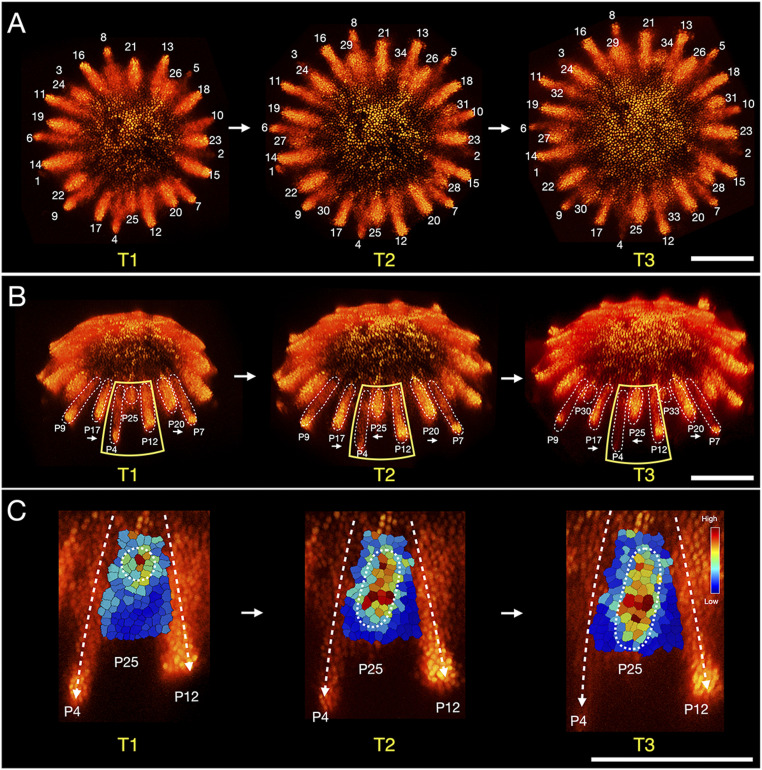
Propagation of incipient primordia. (A and B) Live images of a representative head at 48-h intervals. The emerging auxin maxima tend toward their older neighbors (white arrows in B) as the receptacle grows. (C) Visualization of the epidermal DR5 signal intensity for intium P25 in B. The signal propagates both radially and laterally in the epidermis, tending toward the older initium (P4). The peak of the signal has traveled as many as six to eight cells from its original position. The final image closely resembles that of initium P9 in Fig. 4G. (Scale bars: 200 m.)
To better understand the role of the lateral displacement of initia, we constructed a computational model operating on the receptacle rim approximated as a growing circle (SI Appendix, SI Text, Model 1). If each initium was inserted symmetrically between its neighbors and remained equidistant from them as the rim expands, initia numbers would increase in a geometric progression: 1, 2, 4, 8, 16… (SI Appendix, Fig. S5A). However, with a lateral displacement toward the older neighbor, initia numbers tend to the Fibonacci sequence for a range of displacement values (over 80% of simulation time for the displacement rates within the 20% range of the optimum value; SI Appendix, Fig. S5 B–D). The adherence to the Fibonacci sequence thus does not critically depend on any specific parameter value, such as the golden ratio. This property is conserved whether the threshold distance at which new initia emerge according to the Hofmeister/Snow and Snow rule is constant or changes over time. With the threshold distance decreasing by 85% in the course of a simulation from the 0- to 34-initium stage, the simulated pattern matches the angular displacement observed experimentally for all simulated stages, and coincides with initia positions up to the 13-initium stage (Fig. 4I and Movie S1).
Pattern Progression.
As patterning progresses beyond the 13-initium stage, new primordia are positioned visibly closer to the head center than their older neighbors (Figs. 4A and 5 A and B). To identify the cause and implications of differences in the radial position of primordia, we transiently inhibited the production of new primordia with the auxin transport inhibitor N-1-naphthylphthalamic acid (NPA) (Fig. 6 A–C). When the effect of NPA subsided, primordia production resumed at some distance from those formed earlier, showing that the morphogenetically competent zone does not necessarily coincide with the pattern front. We then examined the expression of GhCLV3, the gerbera homolog of the Arabidopsis CLAVATA3 (CLV3) gene. CLV3 defines the undifferentiated central zone in the Arabidopsis meristem (35) and positions the morphogenetically competent peripheral zone that surrounds it. We found that the GhCLV3 domain first expands and then contracts toward the head center (Fig. 6 D–H), in agreement with the observed primordia production (Figs. 2 A and B and 4A). By an analogy with Arabidopsis, we thus hypothesize that the morphogenetically competent zone—the active ring—in gerbera is positioned by GhCLV3.
![Dynamics of the morphogenetically competent zone. (A–C) Relation of the competent zone to the pattern front. (A) SEM image of a head with mock treatment, showing a normal phyllotactic pattern. (B) Head that underwent a 2-wk NPA treatment. The initiation of floret primordia has stopped at a circular pattern front (white circle). (C) Head of a plant that underwent a 2-wk NPA treatment followed by a 1-wk period without applied NPA. Production of primordia (marked with white dots) resumed at a distance from the previously formed pattern front. (D–H) Expansion (D–G) and contraction (H) of the GhCLV3 expression domain. (D) Vegetative shoot meristem. Lf, leaf primordium. (E) Naked head stage. (F) Bract (Br) patterning stage. (G) First floret primordium (Fp) stage. (H) Disk floret patterning stage. All images are light-microscopic sections of in situ hybridization. Black dotted lines accentuate the GhCLV3 expression domain; their endpoints indicate the presumptive position of the active ring. [Scale bars: 1 mm (A–C); 100 μm (D–H).]](/dataresources/secured/content-1766004901385-41dd6e8e-8758-4d67-b1d2-e101fffb206c/assets/pnas.2016304118fig06.jpg)
Dynamics of the morphogenetically competent zone. (A–C) Relation of the competent zone to the pattern front. (A) SEM image of a head with mock treatment, showing a normal phyllotactic pattern. (B) Head that underwent a 2-wk NPA treatment. The initiation of floret primordia has stopped at a circular pattern front (white circle). (C) Head of a plant that underwent a 2-wk NPA treatment followed by a 1-wk period without applied NPA. Production of primordia (marked with white dots) resumed at a distance from the previously formed pattern front. (D–H) Expansion (D–G) and contraction (H) of the GhCLV3 expression domain. (D) Vegetative shoot meristem. Lf, leaf primordium. (E) Naked head stage. (F) Bract (Br) patterning stage. (G) First floret primordium (Fp) stage. (H) Disk floret patterning stage. All images are light-microscopic sections of in situ hybridization. Black dotted lines accentuate the GhCLV3 expression domain; their endpoints indicate the presumptive position of the active ring. [Scale bars: 1 mm (A–C); 100 m (D–H).]
To explore the role of the active-ring dynamic, we extended the circular Model 1 (Fig. 4I) to a growing disk (SI Appendix, SI Text, Model 2 and Movie S2). The active ring was programmed first to coincide with the disk rim, then to expand more slowly, and eventually to contract and disappear in the disk center (SI Appendix, Fig. S6A). The initial stages of the simulation are indistinguishable from those obtained using Model 1 (Fig. 4I, stages 1–13). However, as the ring moves away from the rim, the incipient primordia become offset toward the disk center, compared to their older neighbors (Fig. 7 A and B). A zigzag pattern front results (Fig. 7C), with the rising and falling segments corresponding to gaps S and L in Model 1. The reason for this correspondence is that gaps S and L have opposite polarities at every stage of development (Fig. 4D) and, by definition, point to the older primordia, which are closer to the disk rim.
Model of the emergence and development of parastichies. (A and B) The active ring (red) gradually separates from the receptacle rim (gray), positioning younger initia (green) closer to the receptacle center than their older neighbors (red; color scheme as in Fig. 4I). (C) Differences in the radial position of initia result in a zigzag pattern front (yellow). The in and out positions of the initia are defined by polarities of gaps S and L. (D and E) A lattice of primordia develops on the zigzag template as the active ring continues to contract. Adjacent primordia delineate two families of spiral parastichies. (F) The final pattern. Colored lines highlight select parastichies. The red circle indicates the disorganized pattern at the center.
As the active ring continues to propagate centripetally, the zigzag pattern is elaborated into a lattice of primordia (Fig. 7 D and E), with the parastichies defined by the S and L elements of the zigzag template. Such elaboration was simulated previously using digitized (36) or algorithmically generated (37) zigzag patterns as the initial configuration of primordia. Our simulations show that the zigzag pattern resulting from the intercalary insertion of initia and their radial offset can initiate a lattice of primordia intrinsically. The opposite parastichies correspond to the rising and falling elements of the template. Fibonacci numbers of parastichies emerge robustly for a wide range of lateral displacement rates of the incipient primordia, although departures from the optimum value increase defects in the phyllotactic lattice (SI Appendix, Fig. S7). We have also verified that the model is robust with respect to changes of functions that control the patterning dynamics. For example, SI Appendix, Fig. S8 shows phyllotactic patterns obtained by modifying the magnitude and the rate of changes in the threshold distance for inserting new primordia.
As the active ring propagates further, extending parastichies toward the head center, parastichy numbers decrease in reversed Fibonacci sequence (Fig. 7F). This phase of patterning is well described by van Iterson’s model (19). Near the center, the pattern becomes disorganized due to the scarcity of available space.
The Integrative Model.
Investigating whether the described processes encompass the entire phyllotaxis of gerbera heads, we constructed a model driven by experimental data characterizing the receptacle shape and active-ring position in the course of head development, and compared it with patterning data. To model the receptacle, we analyzed profiles of heads in a sequence of developmental stages scanned using X-ray micro-CT (Fig. 2A; two earliest developmental stages not shown), as well as the positions of the pattern front (Fig. 8A and Movie S3; for details, see SI Appendix, Fig. S9 and SI Text, Model 3). By interpolating these data, we constructed a three-dimensional (3D) model of receptacle development using the keyframe method with B-splines (38) (Fig. 8B). Consistent with Fig. 3 I and J, we assumed that the active ring is positioned ahead of the observed pattern front. Given this input, we simulated the insertion of new primordia according to the Hofmeister/Snow and Snow hypothesis, with lateral displacement when conditions for it occur (Fig. 8C and Movies S4–S6). To facilitate the visual evaluation of the model, we enhanced it with a realistic 3D representation of growing floret primordia (SI Appendix, Fig. S10 and SI Text, Model 3) based on reported data (39). The resulting images (Fig. 8D and Movie S7) closely match the SEM image of a gerbera head (Fig. 2B).
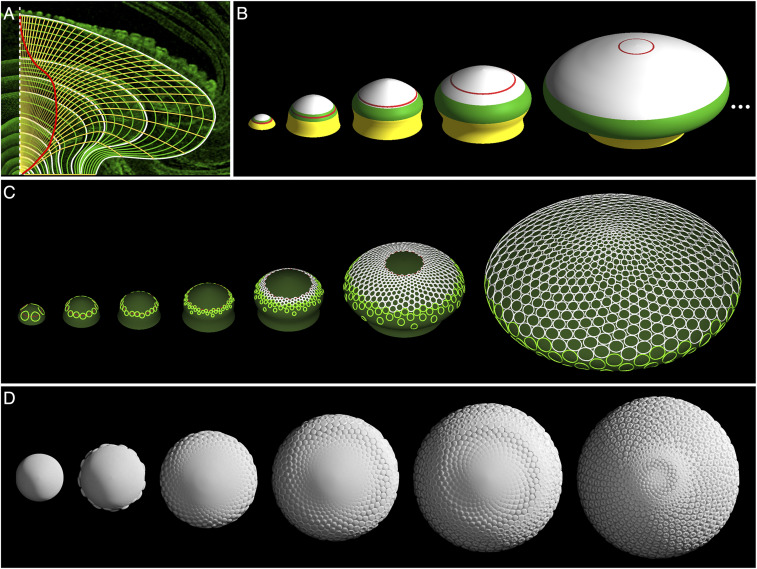
Phyllotactic patterning of gerbera heads. (A and B) Model construction. (A) Profiles of the receptacle are traced (white curves) and interpolated (green curves) to characterize the growth of the receptacle. Yellow curves show the trajectories of material points. The red curve is the trajectory of the active ring estimated from the positions of the youngest primordium (Fig. 2A and SI Appendix, Fig. S9), taking into account that DR5 maxima emerge before morphological changes (Fig. 3 I and J). (B) Snapshots of the receptacle model obtained by rotating the profile curves around the receptacle’s symmetry axis. Colors indicate the transitional zone between the stem and the receptacle (yellow), the bract zone (green), the floret zone (white), and the active ring (red). (C) Phyllotactic pattern generated on the receptacle model. (D) Simulated development of a gerbera head.
To validate the model, we first compared the DR5 signal in the early phase of patterning with the model’s predictions. The predicted positions closely matched maxima of DR5 expression observed experimentally. This agreement includes both the pattern of gaps along the rim (Fig. 9A) and the differences in the radial position of primordia forming the zigzag pattern front (Fig. 9B).
![Model validation. (A and B) Comparison of predicted and observed positions of DR5 maxima in the early patterning phase. (C–F) Comparison of predicted and observed intermediate patterning stages with circular (C and D) and elliptic (E and F) pattern fronts. Chl, chlorophyll. (G and H) Comparison of predicted (G) and observed (H) positions of the first 21 bracts on the lower side of a gerbera head. (I and J) Comparison of predicted (I) and measured (J) distances of bracts from the stem center. For the measured distances, mean values in a set of 12 heads (horizontal lines) and the standard errors (vertical bars) are shown. (K and L) Comparison of the simulated head (K) with the SEM of a real head (L). [Scale bars: 5 mm (H); 1 mm (L).]](/dataresources/secured/content-1766004901385-41dd6e8e-8758-4d67-b1d2-e101fffb206c/assets/pnas.2016304118fig09.jpg)
Model validation. (A and B) Comparison of predicted and observed positions of DR5 maxima in the early patterning phase. (C–F) Comparison of predicted and observed intermediate patterning stages with circular (C and D) and elliptic (E and F) pattern fronts. Chl, chlorophyll. (G and H) Comparison of predicted (G) and observed (H) positions of the first 21 bracts on the lower side of a gerbera head. (I and J) Comparison of predicted (I) and measured (J) distances of bracts from the stem center. For the measured distances, mean values in a set of 12 heads (horizontal lines) and the standard errors (vertical bars) are shown. (K and L) Comparison of the simulated head (K) with the SEM of a real head (L). [Scale bars: 5 mm (H); 1 mm (L).]
Due to local interaction between incipient primordia, the model can generate regular phyllotactic patterns with Fibonacci parastichy numbers using both circular and transiently noncircular active rings (Fig. 9 C and E and Movies S5 and S6). This feature is consistent with the observations of real heads, in which both circular and transiently noncircular active rings often occur (Fig. 9 D and F).
The model also captures the propagation of bract primordia from the upper to the lower side of the head due to the nonuniform expansion of the receptacle. This expansion amplifies the initially small differences in the radial position of the early bract primordia, which become visible when looking at the head from the bottom (Fig. 9 G and H). The distribution of bract distances from the stem center (Fig. 9I) is consistent with experimental data (Fig. 9J).
By the end of the simulation, the model reproduced spiral patterns with characteristics (34/55 parastichies near the rim, 84 bract primordia, and 634 floret primordia) within the range typically observed in gerbera heads. The reduction of parastichy numbers toward the head center, and the eventual disorganization of the pattern near the center, closely matched those observed experimentally (Fig. 9 K and L).
Discussion
Phyllotactic patterning is commonly described as a relatively homogeneous process, during which the pattern emerges by iterating the same basic process. Distinct modes of phyllotaxis were first recognized by Classen-Bockhoff and Bull-Hereñu (40) in the context of separate plant species. We observed that patterning of a single structure may also have phases with distinct characters. Specifically, in the phyllotactic patterning of gerbera, we distinguished three major phases: 1) formation of a circular pattern of incipient bract primordia on the rim of the head; 2) emergence of a radial offset between primordia, producing a zigzag template for a lattice of floret primordia; and 3) elaboration of this lattice into a spiral phyllotactic pattern filling the head. The progression through these phases is controlled by the dynamics of head growth and propagation of the active ring. Although the boundaries between these phases are not sharp, their differences give them a qualitatively distinct character.
The first phase occurs early in head development, when the active ring expands in concert with the receptacle rim. It takes place before the patterning process is clearly reflected by morphological structures, and therefore was not analyzed in previous studies. It is evident, however, in the spatiotemporal pattern of auxin maxima, which we revealed using transgenic DR5rev::3XVENUS-N7 reporter lines in gerbera. A crucial element of this pattern is the progression of the number of auxin maxima according to the Fibonacci sequence. This progression cannot be explained in terms of the widely used model of phyllotactic patterning by van Iterson (19) and its extensions, e.g., refs. 20 and 21, which focus on the numbers of parastichies rather than individual primordia. However, it is consistent with the work of Hirmer (23), followed by Battjes and collaborators (41, 42), who investigated phyllotaxis in connection with the numerical canalization of organs, i.e., their tendency to appear in specific numbers. Hirmer showed geometrically that if primordia of arbitrary fixed size were placed according to the golden divergence angle in a ring, precisely a Fibonacci number of primordia would fit before they start overlapping. A formal proof of this property, related to the three-gap theorem in mathematics (43), was given by Battjes and Prusinkiewicz (25). Our observations of the progression of DR5 signal in the early stages of head patterning reveals an almost perfect match with Hirmer’s model (ref. 23, figures 12–16). However, in contrast to Hirmer and previous models based on his ideas (24, 25), we explain this pattern without assuming a constant, golden divergence angle between consecutive primordia. Instead, we attribute its emergence to the intercalary insertion of initia on the expanding rim and the asymmetric posititoning of initia with respect to their neighbors. The local character of these interactions, as opposed to the divergence angle relating distant primordia across the undifferentiated central zone of the head, and the robustness with respect to parameter changes (SI Appendix, Figs. S7 and S8) make our model mechanistically plausible.
Historically, asymmetry in the placement of primordia was postulated by Church (ref. 44, pp. 91–93), who proposed to extend the Hofmeister rule with the statement that “the new member falls asymmetrically into the next largest gap” and constructed plausible diagrams of phyllotactic patterns in which new primordia were tangent to only one of their neighbors (ref. 44, figure 37). In the context of the gerbera head rim, this asymmetry is the key to the progression of primordia numbers according to the Fibonacci sequence. Our simulations show that a preference toward Fibonacci numbers occurs for a large range of displacement rates of incipient primordia toward their older neighbors, although a strict adherence to the Fibonacci sequence only occurs when the incipient primordia partition the space between their neighbors according to the golden ratio exactly.
The idea that primordia may be displaced after initiation also has a rich history. Primordia displacement was postulated by Schwendener (45) and brought to prominence by Adler (46) and Ridley (47) as a mechanism to equalize distances between adjacent primordia. The end result was an increased geometric regularity of the resulting patterns. In contrast to these hypotheses, the lateral displacement of auxin maxima in gerbera heads positions them asymmetrically with respect to their neighbors. The capability of auxin maxima to travel between cells, underlying this displacement, was observed in computational models of auxin patterning by Heisler and Jönsson (48) and Bilsborough et al. (ref. 49, movie S07). More recently, Galvan-Ampudia et al. (50) observed radially traveling auxin maxima in the shoot apical meristem of Arabidopsis. Our results extend their finding to the lateral displacement of maxima in gerbera heads.
The second, or intermediate, phase of head patterning is characterized by the progressive dissociation of the active ring from the rim in concert with the contracting GhCLV3 expression domain. As a result, the radial distances between older and newer initia increase, transforming the pattern front into a zigzag pattern. The emergence of this pattern is another element of our model related to the work of Hirmer. Modifying his annular construction, he observed that if each primordium was slightly offset toward the head center compared to its predecessor, the pattern front would form a zigzag line (ref. 23, figures 17–21). More recently, Hotton et al. (36) and Pennybacker and Newell (37) showed that a similar line can serve as a template for generating a spiral phyllotactic pattern with Fibonacci parastichy numbers. Our simulations demonstrate that the zigzag pattern resulting from the dissociation of the active ring from the rim of the head can fulfill the same role. Interestingly, a zigzag pattern front was already reported and partially characterized by van Iterson (ref. 19, pp. 265–269).
In the final, third phase of patterning, the dominant factor is the stacking of new primordia at the pattern front, associated with the gradual contraction of the active ring that eventually disappears at the head center. The subsequent reduction of parastichy numbers according to the reversed Fibonacci sequence is explained by the stacking model of van Iterson (19) and its more recent refinements, e.g., refs. 7, 21, and 51, as well as by the analyses of Rivier and Lawrence (52, 53), who characterized the patterns of primordia in transitional zones in terms of quasicrystals. Our experimental and modeling results highlight, however, that an assumption underlying these models—the radial symmetry of the meristem and the pattern front—is not necessary, and some departures from it do not substantially alter the resulting patterns (Fig. 9 E and F).
The spatial regularity of phyllotactic patterns is typically described as a result of the sequential addition of new primordia along an idealized generative spiral, with a fixed divergence angle between consecutive primordia. Such description is applicable to processes taking place within a small, circularly symmetric meristem, where consecutively issued primordia are clearly distinguishable, and both the strict adhesion to the golden divergence angle, and departures from it, are of interest, e.g., refs. 5455–56. In gerbera heads, however, the exact order in which floret primordia emerge at the pattern front is not observable; furthermore, within some bounds, it is not relevant to the resulting pattern (SI Appendix, Fig. S11), as also noted in other contexts (7, 21, 57). The primordia are produced in processes that are locally sequential—each incipient primordium is positioned in relation to its previously emerged neighbors—but are only loosely synchronized globally by the progression of an active ring that may lack circular symmetry. Phyllotaxis in heads is thus best characterized as a set of concurrent processes (58), in which the temporal precedence of events and their causal relations are only determined for spatially close primordia, without imposing a linear temporal ordering on the entire set of events. This change of perspective calls for a revision of many notions commonly used in the description of phyllotaxis, such as the plastochron, pattern center, generative spiral, and divergence angle—a postulate also made in the recent review by Godin et al. (7)—which lose their meaning or relevance in the context of the concurrent production of primordia on a noncircular active ring or receptacle.
The distinctive features of phyllotaxis in gerbera also set forth the need to broaden the experimental studies of phyllotaxis beyond the model plants Arabidopsis or tomato. The essential next step will be in vivo observation of PIN1 proteins at all stages of the patterning process in gerbera, which we expect to shed light on the mechanism of the emergence and displacement of auxin maxima reported here. Of interest is also the generality of the proposed model: Is gerbera a singular case, or is the described three-phase patterning process more common? Has the mechanism of lateral displacement observed in gerbera evolved in Asteraceae, or is it an older mechanism—possibly an inherent feature of auxin-driven patterning—actuated in gerbera heads by the specific dynamics of active-ring expansion and receptacle growth? Finally, we wonder whether processes described in this paper may improve our understanding of organ arrangement in flowers with multiple organs.
Materials and Methods
Plant Material.
Wild-type and transgenic G. hybrida cultivar ‘Terra Regina’ plants were grown under standard greenhouse conditions (59). Flower-head samples used for microscopic and live-imaging analyses were collected from the plants and dissected under a stereomicroscope (Zeiss Stemi 2000-C). Exogenous treatment with the polar auxin transport inhibitor NPA (Supelco, Sigma-Aldrich) was carried out by applying 1 mL of 100 M NPA solution three times at 2-d intervals to each shoot of the growing gerbera rosettes. We added 0.015% Silwet-L77 (Lehle Seeds) surfactant immediately before the treatment. Flower-head samples were collected for imaging 2 and 3 wk after the first treatment.
Isolation and In Situ Hybridization of GhCLV3.
The gerbera CLV3 homolog (GhCLV3) was amplified with gene-specific primers: (5′-AAAAAGCAGGCTCGATGGTTTTTTCACTCAGATATC-3′, 5′-AGAAAGCTGGGTTTAAGGAGTTCGGGGCTTTTTC-3′) and cloned into Gateway entry vector pDONR221 (Invitrogen). The full sequence is available in GenBank (accession no. MN793057). For in situ expression analysis, samples were prepared, sectioned, and hybridized as described in ref. 60. The full-length coding region of GhCLV3 (327 bp) was designed as the probe, and it was synthesized by using primers containing a T7 overhang as described in ref. 61. Sections were examined and photographed with a Leitz Laborlux S Microscope equipped with a Leica DFC420 C Digital Camera.
Reporter Construct and Genetic Transformation of Gerbera.
The auxin reporter construct was generated by transferring a NotI fragment containing the DR5rev::3XVENUS-N7 sequence (28) into the pRD400 vector with a nos-nptII marker gene encoding kanamycin resistance (62). The binary construct was then electroporated into Agrobacterium strain C58C1 (pGV2260) (63). Genetic transformation of gerbera was carried out as described in ref. 64. The transformation yielded four independent lines (TR3, TR5, TR7, and TR8) that showed consistent patterns of fluorescence signals. Auxin responsiveness of the reporter construct was tested on dissected involucral bracts from these lines, treated with 10 M indole-3-acetic acid (IAA) and 10 M 1-naphthaleneacetic acid (NAA) water solutions. Mock treatments without hormones were made for control. All four lines were used for subsequent microscopic analysis.
SEM.
We investigated flower-head growth using SEM images and micro-CT scans. For the SEM imaging, head meristem samples collected from the wild-type and NPA-treated gerbera plants were prepared as described in ref. 65. The images were acquired by using a Quanta 250 SEM (FEI Corporation).
Micro-CT.
To investigate flower head growth in 3D, we obtained micro-CT scans of 20 wild-type gerbera flower heads. A developmental series was compiled by using 10 samples, selected on the basis of their sizes. Head samples were fixed in 10% formalin, 5% acetic acid, and 50% ethanol for 48 h; dehydrated through ethanol series (50%, 60%, 70%, 80%, 95%, 100%, and 100%, each for 2 h); and critical point dried with a Leica EM CPD300 dryer (Leica Mikrosysteme GmbH). The micro-CT scanning was conducted by a Skyscan 1272 micro-CT scanner (Bruker Micro-CT) for smaller heads (with bracts being initiated) or a GE Phoenix Nanotom scanner (GE Sensing & Inspection Technologies GmbH) for larger heads (with florets being initiated). The 3D reconstruction of the original X-ray images from micro-CT scans was performed by NRecon version (v) 1.7.0.1 (Bruker Micro-CT). The reconstructed image stacks were further analyzed and visualized with Fiji (66) and MorphoGraphX (67).
Laser-Scanning Confocal Microscopy.
Laser-scanning confocal microscopy (LSCM) was used to examine the gerbera auxin reporter lines. To understand pattern formation during the early stages of head meristem development, we obtained images of 56 randomly sampled head meristems smaller than 700 m in diameter (SI Appendix, Fig. S3). The samples were prepared as described in ref. 68. Special care was taken to remove trichome hairs and the involucral bracts surrounding the head meristem. Cell walls were stained by using 1 mg/mL propidium iodide (PI; Sigma-Aldrich) applied over an extended period (30 min). The specimens were imaged by a Leica TCS SP5 MP microscope (Leica Mikrosysteme Vertrieb GmbH) equipped with an HCX APO L 20×/1.0 W water-dipping objective. For imaging, the samples were excited by an argon laser at 514 nm, and emission of VENUS fluorescent protein and PI was recorded at the 519- to 537-nm and 624- to 695-nm wavelengths, respectively. Z-stacks representing head meristems in 3D were visualized and analyzed by using MorphoGraphX (67). Top views of each sample were exported as two-dimensional images for further analysis. To generate the superimposed images of the DR5 signal (SI Appendix, Fig. S3B and Fig. 4I), the top-view images were first manually aligned by rotating the images. The aligned images with the same number of DR5 maxima were combined into image stacks, then composed by using the Fiji (66) “sumslice” function. To analyze the DR5 signal and the curvatures of meristem epidermis in selected samples, the meristem surface was isolated and segmented, and the DR5 signal and Gaussian curvature values were projected with MorphoGraphX (67), as described in the user manual.
Light-Sheet Microscopy.
To obtain overviews of auxin distribution corresponding to later stages of head development (Fig. 9 D and F), the entire flower heads with large physical sizes (>1 mm in diameter) were examined by using a Z.1 light-sheet microscope (Carl Zeiss) equipped with a 5×/0.16 air objective. The data were collected by using filter sets designed for VENUS-PI imaging (SP525 for VENUS and LP585 for chlorophyll autofluorescence) and visualized by using the Zeiss ZEN pro software.
In Vitro Culture and Live Imaging of Growing Head Meristem.
To observe auxin patterning on a growing head meristem using live imaging, we cultured gerbera head meristems in vitro. The explants were dissected gerbera rosettes (approximately 3 mm × 3 mm in size) containing the growing head at an early developmental stage. They were surface-sterilized with 5% Plant Preservative Mixtures (PPM; Plant Cell Technologies) and placed on the gerbera multiplication medium (69) supplemented with 1 mg/L gibberellic acid 3 (Duchefa Biochemic B.V.), 0.1% PPM, and 45 g/L sucrose. Growing conditions were as described in ref. 69. The growing head meristems were imaged by LSCM at three time points (0 h, 48 h, and 96 h) using the same settings as described above. Cell walls were stained with PI applied before each imaging.
Measurement and Analysis of the Pattern of Gaps.
To quantify gaps between DR5 maxima on the receptacle rim (Fig. 4B), we estimated angles between the maxima with respect to the visually determined head center. Positions of individual maxima were annotated by considering the distal (farthest from the head center) end of each DR5 streak (SI Appendix, Fig. S3 A, Inset). The angular gaps were then measured in the counterclockwise direction by using the Fiji (66) “angle tool” function. The distribution of gaps (Fig. 4C) was characterized by using an in-house program implementing the kernel-density method.
Measurement of Distances between Bracts and the Center of Receptacle.
To examine the positions of the first bracts in a mature gerbera flower head (Fig. 9J), we photographed the base of 12 randomly selected heads. The first 21 bracts were then labeled in accordance with their positions, assuming an approximately golden divergence angle. The distances of the bract bases to the receptacle center were measured by using the Fiji (66) “measurement” function.
Computational Modeling.
All models were written in the L-system-based plant modeling language L+C (70), and executed by using the lpfg simulator incorporated into the Virtual Laboratory (vlab) v4.5.1 plant modeling software (algorithmicbotany.org/virtual_laboratory). The models are available at algorithmicbotany.org/papers/gerbera2021.html. To construct the data-driven dynamic receptacle model (SI Appendix, Fig. S9), optical sections of developing heads were superimposed with Adobe Photoshop and traced by using a custom extension of the vlab contour editor (Fig. 8A). All models were visualized directly by using lpfg, except for the realistic head model (Figs. 8D and 9K and Movie S7), which was rendered by using Blender v2.79 (https://blender.org). Voronoi diagrams involved in this model (SI Appendix, Fig. S10 G–I) were constructed by using the Advancing Front Surface Reconstruction package from the Computational Geometry Algorithms Library (CGAL) v4.14.1 (https://cgal.org). All simulations were performed on MacBook Pro computers under macOS High Sierra v10.13.6. See SI Appendix, SI Text for a detailed description of the models.
Acknowledgements
We thank Heikki Suhonen and the staff of the micro-CT laboratory and the Electron Microscopy and Light Microscopy Units at the Institute of Biotechnology, University of Helsinki, for assistance; Siobhan Braybrook for information on the capitulum in vitro cultivation method; Pascal Ferraro for software support; Johannes Battjes for early inspiration; and Jacques Dumais, Lawrence Harder, Ykä Helariutta, and Lynn Mercer for discussions. This work was supported by Academy of Finland Grant 1310318 (to P.E.); Natural Sciences and Engineering Research Council of Canada Discovery Grants 2014-05325 and 2019-06279 (to P.P.); the Plant Phenotyping and Imaging Research Centre/Canada First Research Excellence Fund (P.P. and M.C.); the Helsinki University Doctoral Program in Plant Sciences (T.Z.); and the Finnish Cultural Foundation (T.Z.).
Data Availability
All data underlying the study are available in the paper or SI Appendix. The full length sequence for gerbera GhCLV3 is available in GenBank (accession no. MN793057). The models are available at Algorithmic Botany (algorithmicbotany.org/papers/gerbera2021.html).
References
1
2
3
4
5
6
7
9
10
11
13
14
15
16
17
18
19
21
22
23
24
25
26
27
28
30
31
32
33
34
35
36
37
38
39
40
41
42
43
44
45
47
48
49
50
51
52
53
54
55
56
57
58
59
60
61
62
63
64
65
66
67
68
69
70