
Edited by Andrea Rinaldo, École Polytechnique Fédérale de Lausanne, Lausanne, Switzerland, and approved February 17, 2021 (received for review July 2, 2020)
Author contributions: G.L., H.R., J.B., and R.M.D. designed research; G.L. performed research; G.L., H.R., C.Y.S., and R.M.D. analyzed data; and G.L., H.R., O.A.S., J.N.R., G.S.B., and R.M.D. wrote the paper.
There are over 900,000 active oil and gas wells in the United States. Estimates of the percentage of these wells that leak during their lifetime have been limited by data availability. We mined publicly available records from state regulatory databases and synthesized the results of various well testing methods into a uniform dataset that describes the integrity of 105,031 wells. Our analysis of the dataset provides insight into regional well leakage frequencies in three US states (Colorado, New Mexico, and Pennsylvania), spatial and temporal leakage trends among vertical and directional wells, and the characteristics of leaked fluids. Our findings demonstrate the value of statewide well testing programs and highlight the challenges of interpreting disparate interjurisdictional well testing data.
Oil and gas wells with compromised integrity are a concern because they can potentially leak hydrocarbons or other fluids into groundwater and/or the atmosphere. Most states in the United States require some form of integrity testing, but few jurisdictions mandate widespread testing and open reporting on a scale informative for leakage risk assessment. In this study, we searched 33 US state oil and gas regulatory agency databases and identified records useful for evaluating well integrity in Colorado, New Mexico, and Pennsylvania. In total, we compiled 474,621 testing records from 105,031 wells across these states into a uniform dataset. We found that 14.1% of wells tested prior to 2018 in Pennsylvania exhibited sustained casing pressure (SCP) or casing vent flow (CVF)—two indicators of compromised well integrity. Data from different hydrocarbon-producing regions within Colorado and New Mexico revealed a wider range (0.3 to 26.5%) of SCP and/or CVF occurrence than previously reported, highlighting the need to better understand regional trends in well integrity. Directional wells were more likely to exhibit SCP and/or CVF than vertical wells in Colorado and Pennsylvania, and their installation corresponded with statewide increases in SCP and/or CVF occurrence in Colorado (2005 to 2009) and Pennsylvania (2007 to 2011). Testing the ground around wells for indicators of gas leakage is not a widespread practice in the states considered. However, 3.0% of Colorado wells tested and 0.1% of New Mexico wells tested exhibited a degree of SCP sufficient to potentially induce leakage outside the well.
Over the past decade, environmental research motivated by the unconventional oil and gas drilling boom has shown that many of the risks associated with drilling operations can be minimized by maintaining well integrity (123–4). Oil and gas wells are considered to maintain “integrity” if they are installed and operated in a manner that prevents the uncontrolled upward migration of hazardous fluids (5). Most wells function as designed over their lifetime; however, the subset of wells that experience integrity issues can potentially leak fluids into groundwater aquifers and/or the atmosphere (678–9). Methane is the primary constituent of natural gas, which is the most common fluid released from leaking wells (1). In the atmosphere, methane acts as a greenhouse gas, and its oxidation can create ozone, which negatively impacts air quality (6, 10). In the subsurface, leaked methane degrades water quality and can pose an explosion or asphyxiation hazard if contaminated water is degassed in a confined space (11, 12). Ensuring oil and gas well integrity is also critically important for carbon dioxide storage, waste disposal, and natural gas storage operations (9, 13, 14). An active or legacy oil and gas well with compromised integrity in the vicinity of a storage or disposal operation could potentially serve as a leakage pathway for injected fluid or formational brine, which may also have negative environmental or human health impacts (15).
Characterization of the risks associated with oil and gas well leakage relies on accurate estimates of the percentage of wells that experience integrity issues over their lifetime. Currently, the most comprehensive assessments of onshore oil and gas well integrity have considered wells in Alberta and British Columbia, where regulators maintain publicly available databases that describe the results of province-wide well integrity testing programs in place since 1995. The Alberta and British Columbia well integrity datasets are unique because they collectively contain uniform integrity testing records for over 450,000 wells (8, 9, 16). While most US state oil and gas regulators have integrity testing requirements, testing practices vary widely between jurisdictions, and records are rarely aggregated in uniform databases (17). Consequently, efforts to characterize the percentage of wells that experience integrity issues in the United States have been limited in scope and have predominantly relied on indirect inferences from groundwater quality monitoring (1819–20) and qualitative notes in inspector reports and violation notices (2, 21, 22).
In this study, we searched the online databases of 33 US state oil and gas regulatory agencies for well integrity testing records performed prior to January 1, 2018. We focused on collecting results from sustained casing pressure (SCP) and/or casing vent flow (CVF) tests, which are often widely administered to monitor well integrity on a regional scale. We identified such records in the regulatory databases of three states: Colorado, New Mexico, and Pennsylvania. SCP and/or CVF testing records in the other 30 states considered were either nonexistent, not publicly available online, or not available in a quantity that supported region-scale estimates of well leakage. We analyzed the collected data to estimate the percentage of wells in each state and basin that have experienced compromised integrity and exhibited SCP and/or CVF at some point during their active lifetime. Spatial and temporal variations of SCP and/or CVF occurrence within the regions considered are discussed along with variations among different well orientations. SCP data were also analyzed to identify wells at risk for overpressuring their outermost annulus and leaking into groundwater.
Modern oil and gas wells are comprised of multiple nested steel casings set to varying depths to contain hydrocarbons, provide structural support, and protect freshwater resources. Portland cement is used to seal casings into the next larger-diameter casing or the surrounding formation and maintain zonal isolation along the depth of the well. Wells are designed to produce and inject fluids through a tubing nested inside the innermost casing (i.e., the production casing). The additional well casings and cement form a system with multiple redundant barriers (Fig. 1) (3).

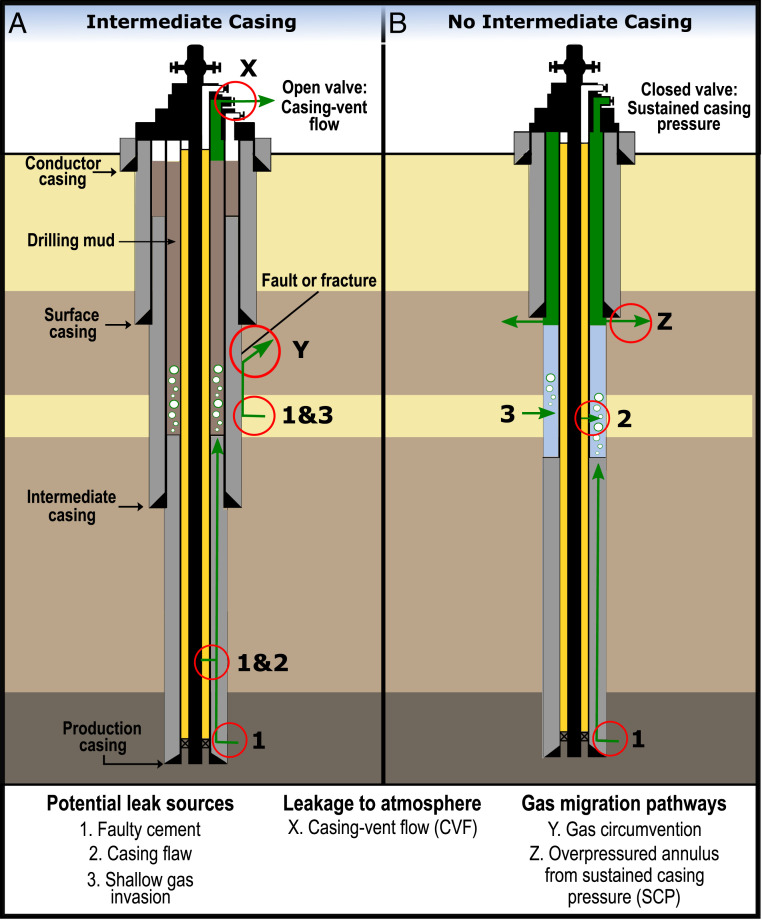
Diagram showing two common well construction practices in the regions considered: (A) wells installed with intermediate casings and cement continuously along the depth of the wellbore and (B) wells installed with no intermediate casing and an uncemented interval along the wellbore. Potential sources for leakage are shown in each diagram along with escape pathways into the atmosphere and subsurface.
Fluids can leak along a well if a barrier fails or an overpressured formation is left uncemented along the wellbore. Leaked fluids migrate upward along the path of least resistance within the well, which is often an uncemented or poorly cemented well annulus (1). Fluids leaked into such well annuli typically remain within the well until they reach the wellhead where they are either contained beneath a sealed valve, released into the atmosphere through an open vent, tied into the production line, or flared (Fig. 1) (9, 16, 17). Undesirable annular pressures and flows from fluid leakage are referred to as SCP and CVF, respectively (Fig. 1) (9, 17).
SCP and CVF are different expressions of the same phenomenon: fluid leakage through a well annulus. However, testing methods for SCP and CVF differ and involve a number of procedures to identify, characterize, and measure annular pressure and flow (Table 1), which provide varying degrees of insight into a well leak. Tests for CVF are a direct method for identifying and measuring fluid leakage through a well annulus. CVF testing is a common requirement in Canada, where regulators require that operators leave well annuli open to the atmosphere during normal operations. The CVF testing protocol established by the Alberta Energy Regulator is widely referenced and is the basis for testing requirements in other regions like British Columbia (8, 23). CVF testing in Alberta begins with a check for gas or liquid leakage through an open annular valve. Liquid leakage is visually confirmed, and its quality is characterized (e.g., fresh or brine). Gas leakage is confirmed with a bubble test (i.e., submerging a hose attached to an annulus in water and checking for bubbles). If a well has CVF, the stabilized fluid leakage rate must be measured with a positive displacement gas meter or an orifice well tester. Operators are then required to close the well annulus and monitor the buildup of annular pressure until it stabilizes (Table 1). The Alberta Energy Regulator uses these data to determine whether the observed CVF is “serious” and requires remediation or “nonserious” and can be monitored and managed. Designations of “serious” CVF also consider the findings of visual inspections for indicators of gas migration (e.g., bubbling or dead vegetation) in the area around the wellhead (23).

| Testing method | Alberta (CVF testing) | API RP 90-2 (SCP testing) | Colorado | New Mexico | Pennsylvania |
| Annular pressure | |||||
| Initial measurement | No | Yes | Yes | Yes | Yes |
| Pressure bleed-off | No | Yes | Yes | Yes | No |
| Pressure buildup | Yes | Yes | No | Yes | No |
| Annular flow | |||||
| Gaseous flow check | Yes | No | No | No | Yes |
| Gaseous flow measurement | Yes | No | No | No | Yes |
| Liquid flow check | Yes | Yes | Yes | Yes | Yes |
| Liquid flow characterization | Yes | Yes | Yes* | Yes | No |
“Yes” and “No” are used to identify methods that are and are not required by each testing protocol, respectively.
* Not in dataset.
SCP tests are not as direct as CVF tests and rely on measurements of annular pressure during periods of bleed-off and build-up to identify and gauge the size of leaks instead of measurements made with a flowmeter. SCP testing is common in the United States and is typically performed in jurisdictions in which operators are required to leave well annuli closed during normal operations (24, 25). The American Petroleum Institute’s (API) Recommended Practice 90-2 describes a widely accepted protocol for SCP testing (5). SCP tests performed in accordance with the API protocol involve attaching a pressure gauge (if not already installed) to a sealed well annulus, recording all annular pressures initially present at the wellhead, and sequentially bleeding off the pressure on each annulus outside the production casing of the well. Annular pressures are bled off by opening the annular valve for a set period (e.g., 30 min) and allowing for CVF, during which all wellhead pressures are monitored and recorded. Similar to CVF testing, fluids flowing through the annular valve during pressure bleed-off are noted as gaseous or liquid and visually characterized by their properties or sampled. After the pressure bleed-off period, the tested annulus is closed, and an instantaneous pressure is recorded. The resealed annulus is then monitored for a return of annular pressure (Table 1) (5).
Annular pressure bleed-off is a key element of SCP testing. The procedure is necessary to distinguish between sustained (i.e., consistently rebuilding) annular pressures that are the result of fluid leakage and temporary annular pressures that are thermally induced from changes in production (5). Annular pressure bleed-off can also help prioritize well remediation. The API recommends further investigation of wells that exhibit annular pressures that do not bleed to zero during bleed-off to identify and remediate any potential barrier failures within the well. Leakage in wells with annular pressures that bleed to zero but build back slowly over time is considered acceptable by the API; however, continual monitoring and periodic reevaluation is recommended to ensure that the leak is properly managed. Fluid leakage between casings can also be diagnosed during annular pressure bleed-off if pressure fluctuations are observed in the casings or annuli adjacent to the tested annulus (5).
Tests for SCP and CVF are administered at the wellhead and do not require a stoppage of production, which makes them relatively inexpensive to perform compared to other more involved well integrity testing methods. Consequently, SCP and/or CVF testing is often relied upon for routine well integrity assessment. Local regulations mandate how operators manage wellhead annular valves, which ultimately determines whether routine integrity testing focuses on SCP or CVF (8, 16, 17). SCP or CVF occurrence in an annulus outside the production casing of a well is typically considered indicative of a well integrity issue. Previous studies have analyzed large datasets of SCP and/or CVF testing results to estimate the percentage of oil and gas wells that have experienced integrity issues in a region (8, 9, 16, 17). SCP data have also been used to identify wells at risk for overpressuring their outmost annulus and inducing a gas leak into groundwater (gas migration) (17). Despite their value, SCP and CVF testing data are limited in that they only describe leakage internal to the well and cannot be used to confirm gas leakage into groundwater or determine the origin of a leak. Leakage that escapes the well can only be detected if SCP or CVF testing is accompanied by soil flux sampling, groundwater quality monitoring, or visual inspections for dead vegetation (8, 16, 18). Additional analyses of leaked fluids (e.g., gas compositional and isotopic analyses) or other well integrity testing methods (e.g., noise or temperature logging) are needed to determine the source of a leak.
Each state in the United States is individually responsible for regulating oil and gas drilling operations that take place within their jurisdiction. Consequently, oil and gas regulatory agencies in Colorado, New Mexico, and Pennsylvania have different routine well integrity testing requirements for operators. These requirements include a mixture of the annular pressure and flow testing methods described in the previous section (Table 1).
The Colorado Oil and Gas Conservation Commission (COGCC) first established routine integrity testing requirements in 1991 for coalbed methane wells in the San Juan Basin. Since that time, routine integrity testing has been codified in state regulations and expanded to each major basin in the state (Fig. 2A) (26). All coalbed methane wells are tested biennially. As a result, more than 90% of active wells have been tested in the Colorado portions of the Raton and San Juan Basins (Fig. 2A and Table 2). Integrity testing in the Denver–Julesburg and Piceance Basins is predominantly focused in testing zones established by the COGCC to improve well integrity management within the targeted regions (27, 28). Operators are required to close annular valves at the wellhead during standard operations. Thus, routine integrity testing is based on the API’s SCP testing protocol (5) and predominantly relies upon measurements of annular pressure to identify and characterize gaseous and liquid leakage. Direct measurements of annular flow are not required in the state (Table 1). Integrity testing results are submitted to the COGCC, which has established various action thresholds for annular pressure throughout the state. For example, operators working in the Denver–Julesburg Basin must report annular pressures in excess of 344.7 kPa (50 psi) to the COGCC and develop a plan to mitigate or remediate the pressure (29). Between 1991 and 2017, a total of 115,468 SCP tests were performed on 22,108 wells—24.5% of all wells and 37.9% of active wells in the COGCC regulatory database (Table 2 and SI Appendix, Fig. S1 and Table S1).
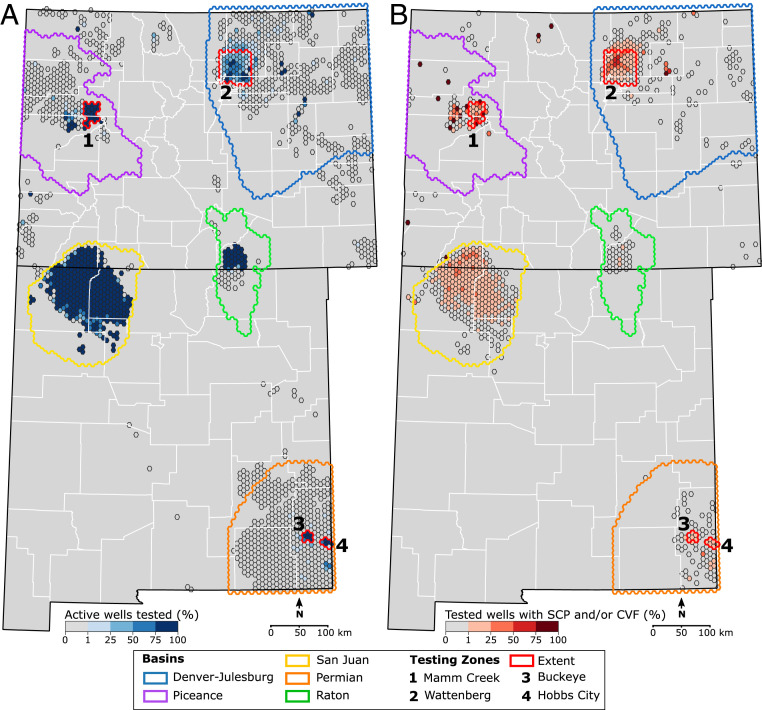
Spatial distribution of (A) well integrity testing and (B) SCP and/or CVF occurrence in Colorado and New Mexico. The overlaid 50 km2 hex grid shows the location of all wells with an active or inactive 2018 status in A and is filtered to show the location of all tested wells regardless of status in B. The extent of the oil and gas basins in each state is indicated by colored outlines, and the extent of the targeted testing zones established by state regulators are shown in red.
| All wells | Vertical wells | Directional wells | |||||
| Tests recorded | Active in 2018 | Tested (%) | Active in 2018 | Tested (%) | Active in 2018 | Tested (%) | |
| Total | 474,621 | 218,089 | 99,082 (45.4%) | 175,163 | 81,219 (46.4%) | 40,692 | 17,835 (43.8%) |
| States | |||||||
| Colorado | 115,468 | 52,292 | 19,794 (37.9%) | 29,475 | 11,533 (39.1%) | 22,817 | 8,261 (36.2%) |
| New Mexico | 104,211 | 56,919 | 23,422 (41.1%) | 46,917 | 21,794 (46.5%) | 7,904 | 1,601 (20.3%) |
| Pennsylvania | 254,942 | 108,878 | 55,866 (51.3%) | 98,771 | 47,892 (48.5%) | 9,971 | 7,973 (80%) |
| Basins | |||||||
| Denver–Julesburg | 19,058 | 29,161 | 9,690 (33.2%) | 18,635 | 5,760 (30.9%) | 10,526 | 3,930 (37.3%) |
| Permian | 8,554 | 32,922 | 2,044 (6.2%) | 24,806 | 1,853 (7.5%) | 6,098 | 191 (3.1%) |
| Piceance | 32,126 | 15,174 | 4,077 (26.9%) | 4,069 | 556 (13.7%) | 11,105 | 3,521 (31.7%) |
| CO Raton | 9,828 | 2,922 | 2,720 (93.1%) | 2,895 | 2,711 (93.6%) | 27 | 9 (33.3%) |
| NM Raton | 0 | 845 | 0 | 798 | 0 (0.0%) | 1 | 0 (0.0%) |
| Raton | 9,828 | 3,767 | 2,720 (72.2%) | 3,693 | 2,711 (73.4%) | 27 | 9 (33.3%) |
| CO San Juan | 54,293 | 3,441 | 3,251 (94.5%) | 2,620 | 2,459 (93.9%) | 821 | 792 (96.5%) |
| NM San Juan | 95,603 | 22,176 | 21,366 (96.3%) | 20,344 | 19,931 (98%) | 1,803 | 1,408 (78.1%) |
| San Juan | 149,896 | 25,617 | 24,617 (96.1%) | 22,964 | 22,390 (97.5%) | 2,624 | 2,200 (83.8%) |
| Pennsylvania oil and gas districts | |||||||
| Northwest | 80,845 | 58,966 | 22,666 (38.4%) | 57,784 | 21,803 (37.7%) | 1,076 | 862 (80.1%) |
| Eastern | 69,405 | 11,552 | 9,397 (81.3%) | 6,454 | 5,116 (79.3%) | 5,098 | 4,281 (84.0%) |
| Southwest | 104,692 | 38,360 | 23,803 (62.1%) | 34,533 | 20,973 (60.7%) | 3,797 | 2,830 (74.5%) |
The total number of tests, active wells, and active wells tested is shown for each state, basin, and region considered categorized by well orientation. The “directional well” category includes both deviated and horizontal wells. Wells with an unknown orientation are considered under the “all well” category but are not shown separately. Well counts and tested well counts are shown only for wells that had an active or temporarily inactive status in 2018. Wells with statuses that were changed to plugged and abandoned in or before 2018 were excluded from our calculations of the total percentage of wells tested in each state because many older wells with plugged and abandoned statuses were active prior to the enactment of integrity testing requirements.
The gathered dataset suggests that routine well integrity testing began in 2002; however, testing requirements are not codified in state regulations, and an exact date could not be confirmed. The New Mexico Oil Conservation Division (NM OCD) requires operators to test wells in the San Juan Basin triennially and wells in two testing zones in the Permian Basin (the Buckeye Field and within the city limits of Hobbs, NM) annually (Fig. 2A) (25). Well integrity testing practices are similar to those mandated in Colorado and mostly align with the API SCP testing protocol (Table 1). Like Colorado, operators are also required to remediate integrity issues or mitigate annular pressure buildup in wells that exhibit annular pressures in excess of established action thresholds. We collected 104,211 SCP tests performed on 25,925 oil and gas wells between 2005 and 2017 in the state (Table 2). Tested wells represented 27.1% of all wells and 41.1% of active wells in the NM OCD regulatory database (Table 2 and SI Appendix, Fig. S1 and Table S1).
Routine integrity testing requirements were promulgated in 2011 under the Pennsylvania Department of Environmental Protection’s (PA DEP) Mechanical Integrity Assessment Program. Extensive integrity testing began in 2014 after a reporting delay to develop necessary regulatory infrastructure (30). Operators in the state must test the annuli of all active conventional wells annually and unconventional wells quarterly for leakage. The PA DEP does not require operators to leave well annuli open or closed but expects them to be tested for either annular pressure or flow (Table 1). As a result, a mixture of annular pressure and flow testing methods that align with some aspects of the Alberta CVF and API SCP testing protocols are used in the state. Closed well annuli are inspected for annular pressures; however, bleed-off tests are not performed, which limited our ability to interpret the dataset using the API protocol (Methods). Open well annuli are inspected for both gaseous and liquid leakage. Gaseous flow is required to be measured with a flowmeter, but unlike the Alberta CVF testing requirements, there is currently no standardized protocol for detecting or measuring annular flows. Consequently, operators have used a variety of instruments (e.g., manometers and digital meters) with varying detection limits to measure CVF, which has resulted in the data quality and compliance issues described by Ingraffea et al. (31) Like the other states considered, the presence of liquid leakage is noted during integrity testing. However, leaked liquids are not required to be characterized (Table 1). Currently, annular pressure and flow data are used by PA DEP to monitor well integrity and evaluate integrity issues on a well-by-well basis. Between 2014 and 2017, a total of 254,942 integrity tests were performed on 56,998 wells in Pennsylvania, which constituted ∼36.0% of all wells and 51.3% of active wells in the PA DEP database (Fig. 3A, Table 2, and SI Appendix, Fig. S1 and Table S1). The percentage of all wells tested would be significantly lower if the unknown number of orphaned and abandoned wells in the state were considered (32). Despite the statewide routine well integrity testing requirement, the testing percentage for active wells in Pennsylvania is below 100% because of operator noncompliance and data removal for quality control.
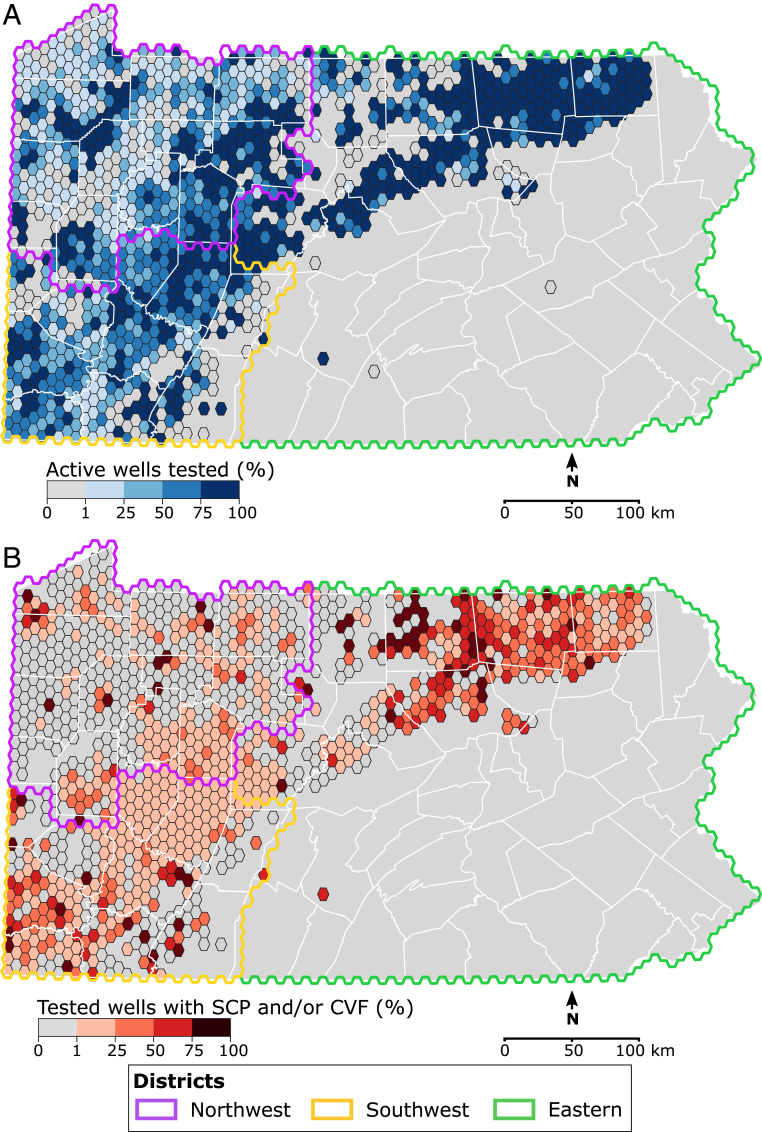
Spatial distribution of (A) well integrity testing and (B) SCP CVF occurrence in Pennsylvania. The overlaid 50 km2 hex grid shows the location of all wells with an active or inactive 2018 status in A and is filtered to show the location of all tested wells regardless of status in B. The extent of the PA DEP oil and gas districts is indicated by colored outlines.
The compiled dataset contains results from 474,621 annular pressure or flow tests performed on 105,301 oil and gas wells across Colorado, New Mexico, and Pennsylvania. Our dataset is the one of the largest and most diverse yet assembled that describes oil and gas well integrity in the United States. In 2017, Colorado, New Mexico, and Pennsylvania contributed 9.1% of oil and 25.6% of natural gas production in the US, and the ∼200,000 active wells in these states comprised ∼22% of the 900,000+ active wells in the country (3334–35). Wells in the dataset are predominantly located in five distinct geological basins: the Appalachian, Denver–Julesburg, Permian, Piceance, San Juan, and Raton. These basins contain a variety of conventional, unconventional, and coalbed methane reservoirs and each have a drilling history that spans between 30 and 150+ y.
The majority (94.1%) of tested wells in the dataset had an active or temporarily inactive status at the time of data collection in 2018. Only 5.5% of tested wells had a plugged status, which we assume was assigned after testing because the states considered do not currently require routine testing of plugged or abandoned wells (SI Appendix, Table S1) (24, 25, 30). Thus, we use the total population of tested wells (regardless of 2018 status) to calculate the percentage of wells in each region considered that have experienced SCP and/or CVF as a result of an integrity issue.
Nonzero pressures in annuli outside the production casing were detected in 60.7% and 47.1% of wells in Colorado and New Mexico, respectively (Table 3). The number of wells tested specifically for annular pressure in Pennsylvania is not known, but nonzero pressures were detected in 12,066 wells. Most (68.6%) cases of annular pressure were low and below our assumed diagnostic threshold of 50 psi (SI Appendix, Figs. S2A and S3A). Annular pressures >50 psi were detected in at least one annulus outside the production casing of 18.9% of tested wells in Colorado, 8.7% of tested wells in New Mexico, and 5,401 wells in Pennsylvania. Results from annular pressure bleed-off and follow up testing were used (where available) to classify occurrences of annular pressure as either SCP or a benign thermally induced pressure. Our criteria for SCP were met by 78.6% of wells that exhibited an annular pressure >50 psi. The remaining 21.4% of above-threshold cases were classified as thermally induced. Tested wells in Colorado and New Mexico exhibited SCP with a frequency of 16.8% and 6.0%, respectively. The percentage of tested wells that exhibited SCP could not be determined in Pennsylvania, but 4,035 wells met our criterion for the phenomenon (Table 3).
| Colorado* | New Mexico* | Pennsylvania† | Total* | |
| Tested wells | 22,108 | 25,925 | 56,998 | 105,031 |
| Annular pressure | ||||
| Nonzero | 13,421 | 12,199 | 12,066 | 37,686 |
| (% tst‡) | (60.7%) | (47.1%) | (N/D) | (N/D) |
| >50 psi | 4,184 | 2,260 | 5,401 | 11,845 |
| (% tst|% nz‡) | (18.9%|31.2%) | (8.7%|18.5%) | (N/D|44.8%) | (N/D|31.4%) |
| Thermally induced | 473 | 698 | 1,366 | 2,537 |
| (% tst|% nz|% >dt‡) | (2.1%|3.5%|11.3%) | (2.7%|5.7%|30.9%) | (N/D|11.3%|25.3%) | (N/D|6.7%|21.4%) |
| SCP | 3,711 | 1,562 | 4,035 | 9,308 |
| (% tst|% nz|% >dt) | (16.8%|27.7%|88.7%) | (6.0%|12.8%|69.1%) | (N/D|33.4%|74.7%) | (N/D|24.7%|78.6%) |
| Did not bleed to zero | 2,498 | 382 | N/D | 2,880§ |
| (% tst|% SCP) | (11.3%|67.3%) | (1.5%|24.5%) | (6.0%|54.6%) | |
| Bled to zero, rebuilt | 717 | 1,099 | N/D | 1,816§ |
| (% tst|% SCP) | (3.2%|19.3%) | (4.2%|70.4%) | (3.8%|34.4%) | |
| Bled to zero, no follow up | 496 | 81 | N/D | 577§ |
| (% tst|% SCP) | (2.2%|13.4%) | (0.3%|5.2%) | (1.2%|10.9%) | |
| Annular flow | ||||
| CVF | 1,331 | 1,167 | 4,333 | 6,831 |
| (% tst) | (6.0%) | (4.5%) | ||
| Gaseous | N/D | N/D | 3,112 | 3,112 |
| (% tst|% CVF‡) | (N/D|71.8%) | (N/D|45.6%) | ||
| Liquid | 1,331 | 1,167 | 1,221 | 3,719 |
| (% tst|% CVF) | (6.0%|100%) | (4.5%|100%) | (N/D|28.2%) | (N/D|54.4%) |
| Fresh | N/D | 977 | N/D | N/D |
| (% tst|% liq CVF‡) | (3.8%|83.7%) | |||
| Not fresh | N/D | 190 | N/D | N/D |
| (% tst|% liq CVF) | (0.7%|16.3%) | |||
| Leakage frequency estimate | ||||
| SCP and/or CVF | 4,593 | 2,507 | 8,030 | 15,130 |
| (% tst) | (20.8%) | (9.8%) | (14.1%) | (14.4%) |
The number of wells that exhibited nonzero annular pressure and annular pressure greater than the assumed diagnostic threshold of 344.7 kPa (50 psi) are shown. Instances of annular pressure >50 psi are categorized as either thermally induced pressure or SCP. Cases of SCP in Colorado and New Mexico are further categorized by the results of their pressure bleed off test. Cases of CVF are categorized as either gaseous or liquid CVF. Liquid CVF occurrences in New Mexico were further classified by their description as clear or fresh or sulfur, salty, black, or muddy. Both SCP and CVF are considered an indicator of leakage in this study. Thus, leakage frequency estimates are calculated as the combined occurrence of SCP and/or CVF among tested wells in each dataset considered. No data are abbreviated as “N/D.”
* Percentages potentially skewed by regions of focused testing.
† The total number of tests performed in Pennsylvania is known, and every well in the state is tested for SCP and/or CVF. However, the specific number of SCP and CVF tests performed is not known.
‡ “% tst” is percent of all wells tested, “% nz” is percent of wells with a nonzero annular pressure, “% >dt” is percent of wells that have exhibited an annular pressure greater than the diagnostic threshold of 50 psi, “% CVF” is percent of wells that have exhibited CVF, and “% liq CVF” is percent of wells that have exhibited liquid CVF.
§ Percentages calculated using the sum of tested wells and wells with SCP in Colorado and New Mexico because no data were available from Pennsylvania.
Wells with intermediate casings set between their production and surface casings had multiple well annuli tested for SCP. In total, 1.36% and 0.44% of tested wells in Colorado and New Mexico with intermediate casings exhibited SCP in more than one annulus, respectively. In Colorado, SCP was more common (P value ∼ 0) in the outer annuli of wells between their production/intermediate and surface casings than in their inner annuli between production and intermediate casings. This trend was opposite in New Mexico, where SCP was more prevalent (P value ∼ 0) in the inner annulus of wells between the production and intermediate casings (SI Appendix, Tables S2–S4).
Results from annular pressure bleed-off testing in Colorado and New Mexico enabled further categorization of SCP cases with the methodology described in the API’s Recommended Practice 90-2 (5). Over half (67.3%) of wells in Colorado and nearly one quarter (24.5%) of wells in New Mexico with SCP experienced annular pressures that did not bleed to zero during a bleed-off test, which the API considers to be indicative of a need for further investigation and potentially remediation. Annular pressures that bled to zero and subsequently rebuilt are considered manageable by the API and were identified in 19.3% and 70.4% of wells with SCP in Colorado and New Mexico, respectively. The remaining 13.4% of wells in Colorado and 5.2% of wells in New Mexico that exhibited annular pressures >50 psi lacked a follow-up test to assess the return of annular pressure after bleed-off (Table 3). The annular pressures experienced by some wells with SCP in this category may have been thermally induced but were assumed to be SCP because of a lack of data. Further testing of wells with this type of SCP is needed.
Our classifications of annular pressure were highly sensitive to the assumed diagnostic pressure threshold. For example, lowering our diagnostic threshold to 172 kPa (25 psi) increased the combined percentage of tested wells in Colorado and New Mexico with annular pressures that met our criteria for SCP from 11.0 to 15.2%. Raising our diagnostic threshold to 1,034 kPa (150 psi) had the opposite effect, lowering the combined percentage of tested wells in Colorado and New Mexico considered to have SCP to 4.7%. Over 75% of wells with annular pressures in excess of the diagnostic threshold met our criteria for SCP regardless of the threshold assumed (SI Appendix, Fig. S4 and Table S5).
CVF occurrences were categorized as either liquid or gaseous. Wells in all three states were inspected for liquid CVF during routine integrity testing. Statewide occurrences of liquid CVF were 6.0% and 4.5% among tested wells in Colorado and New Mexico, respectively (Table 3). Liquid CVF was exhibited by 1,221 wells in Pennsylvania during testing, but the total number of wells tested specifically for liquid CVF in the state is not known.
Additional testing details from New Mexico specified the leaking annulus and characterized the quality of liquid leaked. Liquid CVF in the state occurred more frequently in the outer annuli of wells between the production/intermediate and surface casings than in the inner well annuli between production and intermediate casings. Clear or fresh liquids leaked in 83.7% of the 1,167 cases of liquid CVF in New Mexico. The remaining 16.3% of wells with liquid CVF leaked liquid described as sulfur, salty, black, or muddy (SI Appendix, Table S3). These data suggest that most cases of liquid CVF in New Mexico appear to be the result of freshwater leakage, which is less of a concern for environmental contamination than brine leakage. Freshwater CVF may also be prevalent in Colorado. Artesian conditions are common in the Denver Basin aquifer system, which underlies portions of the Denver–Julesburg Basin where a relatively high (10.5%) percentage of tested wells have exhibited liquid CVF (SI Appendix, Table S6) (36).
Tests for gaseous annular flow are only required in Pennsylvania. Gaseous CVF was detected in an annulus outside the production casing of 3,112 tested wells in the state (Table 3). If we assume that all integrity tests in Pennsylvania included an assessment for annular flow (which is not clear), 5.5% of tested wells exhibited gaseous leakage, which aligns with the findings of Ingraffea et al. (31) Most cases of gaseous CVF occurred in the annulus between the production/intermediate and surface casings of wells (SI Appendix, Table S4). Measured CVF rates formed a right-skewed distribution, the median and 95th percentile of which were 4.5 m3 · d−1 and 218.1 m3 · d−1, respectively (SI Appendix, Fig. S3B). In total, 4,333 wells in Pennsylvania exhibited either gaseous or liquid CVF during an integrity test (Table 3).
Annular pressures and flows that met our criteria for SCP and/or CVF were detected in 15,130 of the 105,031 tested wells in the considered dataset. Thus, we estimate that 14.4% of the total population of tested wells have exhibited leakage at some point in the considered timeframe (Table 4). Statistically significant variations in the percentage of wells that exhibited SCP and/or CVF were observed between the states and the majority of the basins and regions considered (SI Appendix, Tables S8 and S9). Statewide frequencies of SCP and/or CVF occurrence among tested wells were 20.8% in Colorado, 9.7% in New Mexico, and 14.1% in Pennsylvania. Within each state, the basin- or region-wide frequency of SCP and/or CVF occurrence ranged between 0.3 to 26.5% in Colorado, 7.0 to 9.9% in New Mexico, and 10.7 to 22.2% in Pennsylvania (Table 4).
| All wells | Vertical wells | Directional wells | |||||||
| Total tested | SCP and/or CVF (%) | Potential GM (%) | Total tested | SCP and/or CVF (%) | Potential GM (%) | Total tested | SCP and/or CVF (%) | Potential GM (%) | |
| Total | 105,031 | 15,130 (14.4%) | 706 (1.5%)* | 86,547 | 9,562 (11.0%) | 385 (1.0%)* | 18,368 | 5,561 (30.3%) | 321 (3.1%)* |
| States | |||||||||
| Colorado† | 22,108 | 4,593 (20.8%) | 671 (3.0%) | 13,404 | 2,130 (15.9%) | 351 (2.6%) | 8,704 | 2,463 (28.3%) | 320 (3.7%) |
| New Mexico† | 25,925 | 2,507 (9.7%) | 35 (0.1%) | 24,180 | 2,357 (9.7%) | 34 (0.1%) | 1,630 | 143 (8.8%) | 1 (0.1%) |
| Pennsylvania | 56,998 | 8,030 (14.1%) | N/D | 48,963 | 5,075 (10.4%) | N/D | 8,034 | 2,955 (36.8%) | N/D |
| Basins | |||||||||
| Denver–Julesburg† | 11,394 | 3,015 (26.5%) | 576 (5.1%) | 7,072 | 1,443 (20.4%) | 277 (3.9%) | 4,322 | 1,572 (36.4%) | 299 (6.9%) |
| Permian† | 2,191 | 153 (7.0%) | 0 (0%) | 1,986 | 135 (6.8%) | 0 (0%) | 193 | 18 (9.3%) | 0 (0%) |
| Piceance† | 4,209 | 895 (21.3%) | 31 (0.7%) | 644 | 195 (30.3%) | 12 (1.9%) | 3,565 | 700 (19.6%) | 19 (0.5%) |
| CO Raton | 2,951 | 9 (0.3%) | 0 (0%) | 2,941 | 9 (0.3%) | 0 (0%) | 10 | 0 (0%) | 0 (0%) |
| NM Raton | 0 | N/D | N/D | 0 | N/D | N/D | 0 | N/D | N/D |
| Raton | 2,951 | 9 (0.3%) | 0 (0%) | 2,941 | 9 (0.3%) | 0 (0%) | 10 | 0 (0%) | 0 (0%) |
| CO San Juan | 3,477 | 666 (19.2%) | 64 (1.8%) | 2,679 | 478 (17.8%) | 62 (2.3%) | 798 | 188 (23.6%) | 2 (0.3%) |
| NM San Juan | 23,708 | 2,352 (9.9%) | 34 (0.1%) | 22,174 | 2,220 (10.0%) | 33 (0.1%) | 1,435 | 125 (8.7%) | 1 (0.1%) |
| San Juan | 27,185 | 3,018 (11.1%) | 98 (0.4%) | 24,853 | 2,698 (10.9%) | 95 (0.4%) | 2,233 | 313 (14.0%) | 3 (0.1%) |
| Pennsylvania oil and gas districts | |||||||||
| Northwest | 23,284 | 2,491 (10.7%) | N/D | 22,420 | 2,390 (10.7%) | N/D | 863 | 101 (11.7%) | N/D |
| Eastern | 9,543 | 2,117 (22.2%) | N/D | 5,214 | 309 (5.9%) | N/D | 4,329 | 1,808 (41.8%) | N/D |
| Southwest | 24,171 | 3,422 (14.2%) | N/D | 21,329 | 2,376 (11.1%) | N/D | 2,842 | 1,046 (36.8%) | N/D |
The “directional well” category includes both deviated and horizontal wells. Wells with an unknown orientation are considered under the “all well” category but are not shown separately. No data are abbreviated as “N/D.” Tested wells are not filtered by their 2018 status because we assume that all wells were tested during their active lifetime.
* Total percentage excludes tested wells in Pennsylvania for which well construction data were not available.
† Percentages potentially skewed by regions of focused testing.
Variations in well integrity testing requirements between the states and basins considered may explain some of the observed differences in SCP and/or CVF occurrence. For example, the geographically focused integrity testing approaches in the Denver–Julesburg and Piceance Basins of Colorado and the Permian Basin in New Mexico potentially skew leakage frequency estimates in these regions and the entire dataset. This effect may be most significant in the Colorado dataset, which is mostly (70.6%) comprised of wells from the integrity testing regions within the Piceance and Denver–Julesburg Basins that were established because of their history of integrity issues (Fig. 2A) (27, 28). The San Juan Basin is the only basin in Colorado or New Mexico that has an integrity testing requirement for all active wells. Combining integrity test information for wells in the San Juan Basin from Colorado and New Mexico reveals a basin-wide leakage frequency of 11.1% (Table 4). Irrespective of the approach, well integrity testing in Colorado and New Mexico has shown that local occurrences of SCP and/or CVF can vary over a much wider range (0.3 to 26.5%) than reported in previous studies of similar datasets for onshore wells, which have shown CVF occurrences between 6.6 to 10.8% (8, 16).
Pennsylvania was the only state considered that has a uniform integrity testing requirement for all active wells. Most prior studies of well integrity in Pennsylvania have used qualitative data from inspector notes and violation notices to estimate statewide well leakage frequencies between 2.6% and 6.3% (2, 21, 22). These data sources most likely underreport well leaks that remains internal to the well system. A more quantitative analysis was recently performed by Ingraffea et al. (31), which analyzed the occurrence of CVF among wells in Pennsylvania using the PA DEP well integrity dataset considered in this study. While the estimate of CVF occurrence (5.6%) in Ingraffea et al. (31) closely aligns with our CVF estimate for Pennsylvania (5.5%), the authors did not also consider the occurrence of SCP. Our analysis provides a more thorough evaluation of the integrity of wells in Pennsylvania and suggests that 14.1% of wells in the state have exhibited SCP and/or CVF—more than twice the highest previously reported estimate. Our leakage frequency estimate for Pennsylvania also exceeds the leakage frequency estimates of 6.6% for wells in Alberta and 10.8% for wells in British Columbia that were derived from similar datasets of CVF measurements (8, 16). Variations in SCP and/or CVF occurrence among wells in the different oil and gas districts of Pennsylvania were significant (SI Appendix, Table S9), indicating that factors other than testing requirements influence the leakage frequencies observed. This finding aligns with the findings of other studies that identified relationships between various well attributes (e.g., well type, construction, and orientation) and well leakage (9). The lack of annular pressure bleed-off testing in Pennsylvania required our SCP criteria to be adjusted for the state (Methods), which reduced our confidence in the distinction between thermally induced annular pressures and SCP. More accurate leakage estimates could be determined for the state if pressure bleed-off testing were performed during well integrity assessment.
Directional wells (e.g., deviated and horizontal) exhibited SCP and/or CVF with a significantly (P value ∼ 0) higher frequency than vertical wells in the dataset (Table 4 and SI Appendix, Tables S10–S14). In total, SCP and/or CVF was detected in 30.3% of tested directional wells and 11.0% of tested vertical wells. This observation was maintained among wells installed in Colorado and Pennsylvania, where the percentage of directional wells that exhibited SCP and/or CVF was 1.8 and 3.5 times higher than the percentage of vertical wells, respectively (Table 4). The statewide frequency of SCP and/or CVF occurrence among directional wells in Pennsylvania was 36.8% (Table 4), which exceeded the leakage frequency estimate of 25% for unconventional wells provided by operators in the state (37). A significant difference in SCP and/or CVF occurrence was not observed (P value = 0.20) between the different well orientations in New Mexico (SI Appendix, Table S11).
Comparing frequencies of SCP and/or CVF occurrence among vertical and directional wells in the basins and regions considered showed that SCP and/or CVF occurrence was significantly more common among directional wells in the Denver–Julesburg Basin (P value ∼ 0), Colorado San Juan Basin (P value = 3.2 × 10⁻⁴), and the Eastern (P value ∼ 0) and Southwest (P value ∼ 0) oil and gas districts of Pennsylvania. The only region where vertical wells exhibited SCP and/or CVF with a significantly higher (P value ∼ 0) frequency than deviated wells was the Piceance Basin. Differences in SCP and/or CVF occurrence were not significant in the Permian (P value = 0.19) and San Juan (P value = 0.11) basins of New Mexico and the Northwest Oil and Gas District (P value = 0.33) of Pennsylvania (Table 4 and SI Appendix, Table S12).
A consistently increasing trend of SCP and/or CVF occurrence was observed among tested wells in Colorado (P value = 2.9 × 10⁻³, slope = 0.27) and Pennsylvania (P value = 1.3 × 10⁻⁵, slope = 0.20) when plotted by installation year. The opposite trend was observed in New Mexico (P value = 2.1 × 10⁻⁴, slope = −0.16) (Fig. 4 and SI Appendix, Fig. S5). Older wells are generally considered to be a higher risk for leakage because they may be constructed to outdated standards and are subject to physical, mechanical, and chemical stresses over their lifetime that can lead to material degradation (6, 9). Thus, the trend of older wells exhibiting leakage more frequently than newer wells that was observed in New Mexico aligns with expectations, but the Colorado and Pennsylvania trends do not. Higher frequencies of SCP and/or CVF occurrence among directional wells in Colorado and Pennsylvania potentially explain the increasing trend of well leakage with well installation year in these states. Significant increases in statewide occurrences of SCP and/or CVF were observed among wells installed between 2005 and 2009 in Colorado (P value = 0.03, slope = 5.6) and 2007 and 2011 in Pennsylvania (P value = 0.03, slope = 6.5), which corresponds with the expansion of directional drilling in each state (Fig. 4 and SI Appendix, Fig. S5). Furthermore, no significant trend of SCP and/or CVF occurrence was observed among the population of vertical wells in Colorado (P value = 0.43) and Pennsylvania (P value = 0.17) when plotted by installation year (SI Appendix, Fig. S6). The percentage of wells exhibiting SCP and/or CVF has decreased among wells drilled since 2011 in Pennsylvania (P value = 0.03, slope = −3.4), which may reflect improved construction practices or the experience gained with directional drilling in the state. SCP and/or CVF occurrence also appears to be decreasing among wells drilled after 2012 in Colorado, but the trend is not significant (P value = 0.22) (SI Appendix, Fig. S6).
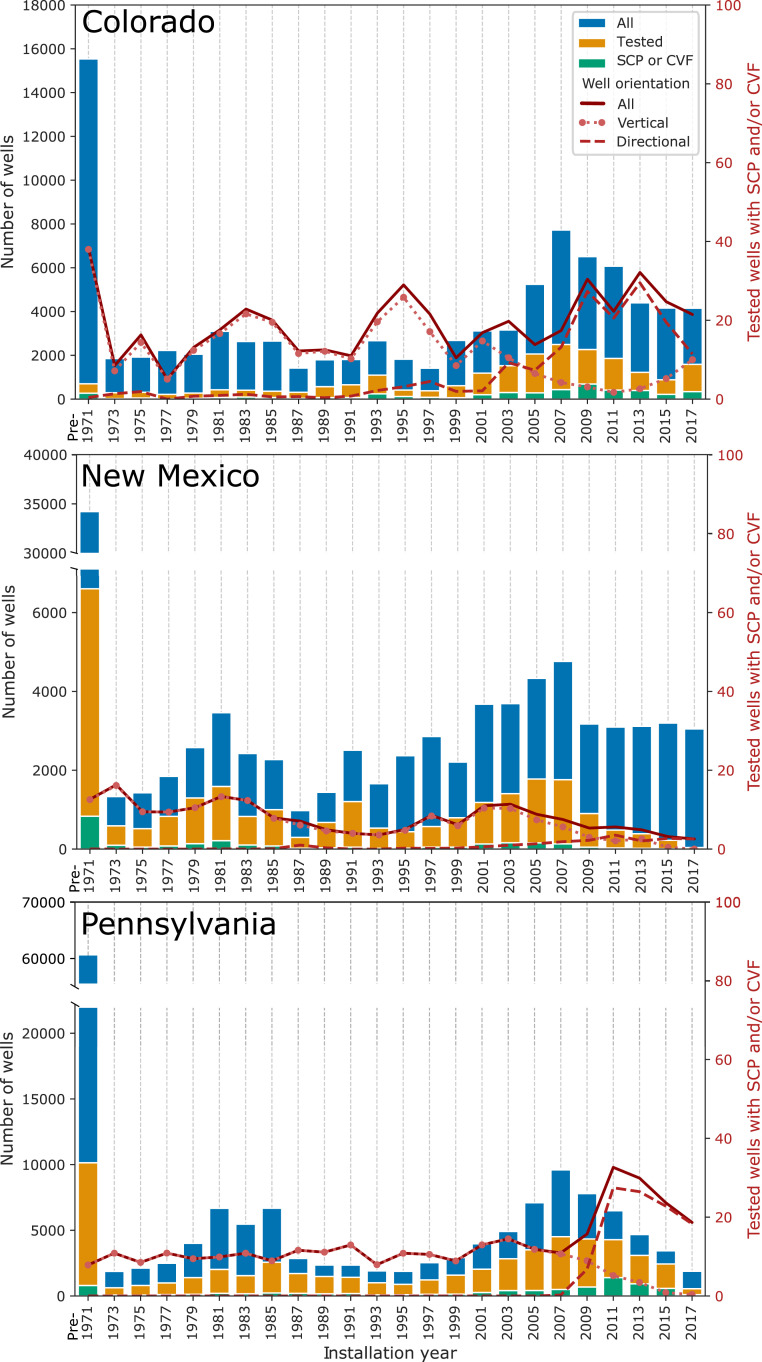
Bar graphs show the total number of wells installed between 1971 and 2017 in Colorado, New Mexico, and Pennsylvania. Counts of wells from each installation year that have been tested and have exhibited SCP and/or CVF are overlaid on top of the total well numbers. The percentage of wells from each installation year that exhibited SCP and/or CVF is also shown on the secondary y-axis. Percentage lines are categorized by well orientation and show SCP and/or CVF occurrence among all, vertical, and directional wells.
A recent study by Wisen et al. (8) also did not observe an increasing trend of leakage among older wells in British Columbia. The authors suggested that older wells with compromised integrity could have been remediated or abandoned prior to the enactment of integrity testing regulations, which would obscure the true percentage of older wells that have experienced leakage. This issue may also impact our dataset as integrity testing has predominantly taken place after 2000 in Colorado and New Mexico and after 2014 in Pennsylvania (SI Appendix, Fig. S1). Declining leak source pressures due to sustained production is another factor that may decrease the occurrence of SCP and/or CVF in older wells.
Routine well integrity testing in Colorado, New Mexico, and Pennsylvania does not currently include an assessment for gas leakage into groundwater (i.e., gas migration). Thus, our estimates of well leakage in this study are based solely on SCP and/or CVF occurrence and do not directly align with well leakage estimates from Alberta and British Columbia, which include visual gas migration inspections. Well integrity data from Alberta and British Columbia indicate that most gas migration cases coincide with CVF development (16, 17). However, in rare circumstances, well leakage can occur in the absence of CVF if leaking gas escapes the well system through a preferential pathway (e.g., fault, fracture, or high permeability formation) at a depth beneath the wellhead (Fig. 1). Gas migration in the absence of CVF was exhibited by 0.5% of tested wells in Alberta and 0.1% of tested wells in British Columbia (16, 17). Without supporting data, we expect that the percentage of wells reporting leakage in Colorado, New Mexico, and Pennsylvania would increase by a degree similar to what has been reported in Alberta and British Columbia (0.1 to 0.5%) if gas migration inspections were performed in these regions.
While we lack the data necessary to identify cases of gas migration in which leaking gas circumvents the wellhead, well construction information and integrity test data can be used to identify wells that have exhibited a degree of SCP sufficient to overpressure their outermost annulus and potentially induce gas migration (17). The COGCC and NM OCD digitize well construction records which include surface casing depth information and estimates of well cement locations. Using these data, we identified wells in which the top of cement was not brought up into the base of the surface casing. The surface casing annulus of these wells is hydraulically connected to the formation at the surface casing base, which leaves a pathway for gas to escape the annulus via overpressurization (Fig. 1).
Any well with an exposed surface casing that exhibited SCP in excess of the estimated formation fluid pressure at the surface casing base was considered at risk for overpressuring their outermost annulus. In total, 3.0% of wells in Colorado and 0.1% of wells in New Mexico met our criteria for annulus overpressurization (Table 4). Most wells with an increased potential for gas migration in our dataset were in the Denver–Julesburg Basin of Colorado, where 5.1% of tested wells met our criterion for annulus overpressurization (SI Appendix, Tables S15 and S16). Gas migration issues in this region have been the focus of previous studies and are well known by the COGCC, which has issued operator guidance and protocols for managing annular pressure in the region (17, 18, 29). Our criterion for annulus overpressurization was also met by 0.7% of wells in the Piceance Basin and 0.4% of wells in the San Juan Basin (Table 4).
Directional wells were significantly (P value = 7.5 × 10⁻⁶) more likely to exhibit an increased potential for gas migration than vertical wells in Colorado, with 3.7% of tested directional wells and 2.6% of tested vertical wells exhibiting the phenomenon (Table 4). A significant difference in the percentage of wells with an increased potential for gas migration was not observed (P value = 0.4) between tested vertical and directional wells in New Mexico (SI Appendix, Tables S17 and S18). Among directional wells in Colorado, the percentage (4.3%) of deviated wells (predominantly installed prior to 2013) that exhibited an increased potential for gas migration was significantly higher (P value ∼ 0) than the percentage (0.4%) of horizontal wells (predominantly installed after 2013) (SI Appendix, Fig. S10 and Tables S19, S20, and S22). The lower frequency of annulus overpressurization among horizontal wells in Colorado suggests improved construction practices for these wells in the state and aligns with the findings of Lackey et al. (17) We lacked the data necessary to identify wells with an increased potential for gas migration in Pennsylvania.
In this study, we aggregated well integrity testing records from Colorado, New Mexico, and Pennsylvania into a uniform dataset useful for estimating regional well leakage frequencies. Our analysis of the records indicates that 14.1% of tested wells in Pennsylvania have exhibited SCP and/or CVF (two potential indicators of a well integrity issue) at some point in their lifetime, which is more than twice the highest previously reported estimate for the state. Basin- and field-specific testing in Colorado and New Mexico revealed local SCP and/or CVF occurrence frequencies between 0.3 and 26.5%—a wider range than previously reported by similar studies. Directional (deviated and horizontal) wells exhibited SCP and/or CVF with a significantly higher frequency than vertical wells in most regions considered. The expansion of directional drilling aligns with and may partially explain statewide increases in SCP and/or CVF occurrence observed among wells drilled in Colorado between 2005 and 2009 and Pennsylvania between 2007 and 2011. SCP and/or CVF occurrence decreased among Pennsylvania wells drilled after 2011, which may reflect improvements in directional drilling techniques and well construction practices.
Most wells with SCP and/or CVF experienced relatively low annular pressures and flows from leaked fluids that are likely to be contained within the well system or released into the atmosphere. However, 3.0% of tested wells in Colorado and 0.1% of tested wells in New Mexico (relevant data were not available for Pennsylvania) exhibited a degree of SCP high enough to risk overpressurizing their outermost annuli and induce a leak into groundwater. Most wells at risk for annulus overpressurization were vertical and deviated wells drilled in the Denver–Julesburg Basin of Colorado—a region where stray gas contamination incidents are well documented and protocols are currently in place to manage annular pressures. Newer horizontal wells in Colorado were less likely to exhibit an increased potential for gas migration than older vertical and deviated wells in the state. Routine inspection for gas migration in the soil around wells is needed to better estimate such risks and improve our understanding of the relationship between SCP and CVF development and gas migration.
While the compiled dataset provides valuable insight into well integrity in the United States, it represents only ∼10% of active oil and gas wells in the country and could be improved through the acquisition of additional well integrity testing data from other important oil and gas producing states. Data from other regions in the United States were unavailable for this study, which suggests a need to expand SCP and/or CVF testing in the country or improve the accessibility of such data in jurisdictions where this type of testing is already required. The content of the dataset could also be improved. Well integrity testing practices in the regions considered are not uniform, and the inherent difference between annular pressure and flow measurements made it challenging to directly align our criteria for SCP and CVF. A comprehensive, standardized testing protocol in the United States—similar to the guidelines established for CVF testing in Alberta and British Columbia (8, 16)—would ensure the compatibility of testing results from different jurisdictions, enable the establishment of a uniform criteria for identifying well integrity issues, and ease the compilation of test results. Such a protocol might consider the following: 1) a binary leakage test (e.g., a bubble test) to reduce the ambiguity associated with low annular pressure and flow observations, 2) a uniform method for annular flow measurement that requires use of a preapproved flowmeter with a known detection limit, and 3) annular pressure bleed-off and buildup in accordance with the API protocol. Continued aggregation of well integrity testing datasets like the one created for this study is important. Beyond their use for the public, these datasets have the potential to become a critical reference for researchers, industry operators, and regulatory agencies seeking to prioritize the remediation, abandonment, or potential reuse of wells.
Metadata and detailed construction information (where available) for wells in Colorado, New Mexico, and Pennsylvania were downloaded from online oil and gas regulatory databases using custom scripts (3839–40). Custom computer scripts were also used to locate and download integrity testing records for the majority of Colorado wells from the COGCC online document database and a subset of New Mexico wells in the NM OCD online database. New Mexico integrity testing records were identified by downloading 643,647 documents of unknown types and classifying them using a retrained image classification neural network developed in the open-source machine learning library TensorFlow (41). Custom computer scripts were used to extract data from 69,715 integrity tests filed in text-based portable document format. The remaining 91,045 image-based integrity tests were manually read and input into a database by trained analysts, which required over 200 person-hours of effort. A dataset of 437,312 integrity testing records for wells in Pennsylvania was downloaded in bulk format from the PA DEP Mechanical Integrity Assessment interactive online report (30). NM OCD also maintains a dataset of 87,665 testing records, which was made available upon request. All data relevant for the study were combined in a uniform format and are available as Dataset S1 (SI Appendix, Table S24). Datasets S2 and S3 contain the individual testing records gathered from Colorado and New Mexico, respectively (SI Appendix, Tables S25 and S26). Individual testing records from Pennsylvania can be accessed online through the PA DEP website (30).
Only oil and gas wells (excluding other well types) installed and integrity tests performed prior to January 1, 2018 were considered in this study. Wells and integrity tests with undetermined dates were retained to avoid the biased exclusion of older records with low-quality or missing data. Testing reports with comments that integrity testing had not taken place were omitted along with reports from Pennsylvania filed with the “not readily measurable” flag because of the compliance issues described in Ingraffea et al. (31) The validity of the computer scripts used to gather data in this study was demonstrated by Lackey et al. (17) Accuracy of manual data entry was assessed by randomly selecting 5% (4,540) of the manually read integrity tests for reevaluation. No discrepancy was found in 99.29% of the reevaluated reports.
Tested wells that exhibited liquid or gas flow above the instrument detection limit in an annulus outside the production casing were considered to have CVF (Fig. 1). Gas flows below the instrument detection limit were not considered CVF because they were assigned the not readily measurable flag and were removed for quality control. All instances of liquid annular flow were considered CVF.
SCP was identified using the API-recommended practice for annular casing pressure management in onshore oil and gas wells (5). API protocol recommends calculating a well-specific diagnostic threshold for annular pressure in wells that is a low percentage of the maximum well operating pressure. We lacked the data necessary to determine the maximum operating pressure of wells and assumed a uniform threshold of 50 psi instead, because it aligns with the action threshold used by the COGCC for wells in the Denver–Julesburg Basin of Colorado and is likely lower than diagnostic thresholds calculated for most wells (which may be over 689.5 kPa). A relatively low threshold was preferred because assuming a high threshold may have excluded wells with smaller chronic leaks from our SCP designation. Cases of annular pressure >50 psi were classified as either SCP or thermally induced. Annular pressures were considered SCP if 1) pressure did not bleed to zero during bleed-off, 2) pressure bled to zero but exceeded 50 psi in the subsequent test, or 3) pressure bled to zero but no follow-up test was performed. Annular pressures that bled to zero but did not exceed 50 psi in the following test were considered thermally induced (SI Appendix, Fig. S13). Pressure bleed-off tests are not performed in Pennsylvania. Cases of annular pressure were considered SCP in Pennsylvania if they 1) exceeded 50 psi in two consecutive tests or 2) exceeded 50 psi and no follow-up test was performed (SI Appendix, Fig. S14).
Wells were considered susceptible to annulus overpressurization if their production/intermediate casing cement was not brought into the bottom of the surface casing (Fig. 1). Wells susceptible to overpressurization were at risk for inducing gas migration if they exhibited annular pressure in excess of the calculated formation fluid pressure at the base of the surface casing. Due to nonavailability of measurements, the formation fluid pressure at the surface casing bottom was approximated as the hydrostatic pressure corresponding to a water column with a height equal to 80% of the depth of the surface casing. Multiple criteria were explored (SI Appendix, Fig. S17 and Table S23), but 80% was used as a conservatively low estimate to account for potential variations in groundwater depth.
A two-proportion z test was used in the fashion of Jordan and Benson (42) to determine the statistical significance of observed differences in the percentage of well populations exhibiting SCP and/or CVF and an increased potential for gas migration (SI Appendix). Consistently increasing or decreasing trends of SCP and/or CVF occurrence among wells installed in different installation years were determined with the Mann–Kendall test for significance and Theil–Sen slope estimation method (43). P values less than 0.05 were considered statistically significant, and Bonferroni’s correction was used to calculate an adjusted significance level when multiple tests were performed (42).
This work was performed in support of the US Department of Energy’s Fossil Energy Carbon Storage Program. The research was executed through the National Energy Technology Research and Innovation Center’s National Risk Assessment Partnership. Research performed by Leidos Research Support Team (LRST) staff was conducted under the Research Support Services Contract 89243318CFE000003. Early iterations of this work were also supported by the NSF-funded AirWaterGas Sustainability Research Network (Grant CBET-1240584). Many thanks to Devansh Chauhan and Lewis Schiebel for their help with data collection. Additional thanks to the staff at the COGCC, NM OCD, and PA DEP as well as Darin Damiani, Mark McKoy, Adam Peltz, Dylan Harp, and two anonymous reviewers who greatly improved the study with their comments. This work was funded by the US Department of Energy, National Energy Technology Laboratory, an agency of the US government, through a support contract with LRST. Neither the US government nor any agency thereof, nor any of their employees, nor LRST, nor any of their employees makes any warranty, expressed or implied, or assumes any legal liability or responsibility for the accuracy, completeness, or usefulness of any information, apparatus, product, or process disclosed or represents that its use would not infringe privately owned rights. Reference herein to any specific commercial product, process, or service by trade name, trademark, manufacturer, or otherwise does not necessarily constitute or imply its endorsement, recommendation, or favoring by the US government or any agency thereof. The views and opinions of authors expressed herein do not necessarily state or reflect those of the US government or any agency thereof.
All study data are included in the article and/or supporting information.
1
2
3
4
5
6
7
8
9
10
11
12
13
14
15
16
17
18
19
20
21
22
23
24
25
26
27
28
29
30
31
32
33
34
35
36
37
38
39
40
41
42
43
 Public data from three US states provide new insights into well integrity
 Facebook
 Twitter
 Linkedin
 Whatsapp

