
Edited by Alan R. Fersht, University of Cambridge, Cambridge, United Kingdom, and approved November 23, 2020 (received for review July 8, 2020)
Author contributions: Z.L., Q.W., and J.M. designed research; Z.L., A.A.C.-A., and L.L. performed research; Z.L., Q.W., and J.M. analyzed data; and Z.L., Q.W., and J.M. wrote the paper.
Three-dimensional refinement is a critical component of cryo-EM single-particle reconstruction. In this paper, we report the development of a computational method, OPUS-SSRI, and its application to seven real cryo-EM datasets. Our data clearly demonstrated that OPUS-SSRI can improve the final resolutions and structural details in cryo-EM single-particle analysis.
In this paper, we present a refinement method for cryo-electron microscopy (cryo-EM) single-particle reconstruction, termed as OPUS-SSRI (Sparseness and Smoothness Regularized Imaging). In OPUS-SSRI, spatially varying sparseness and smoothness priors are incorporated to improve the regularity of electron density map, and a type of real space penalty function is designed. Moreover, we define the back-projection step as a local kernel regression and propose a first-order method to solve the resulting optimization problem. On the seven cryo-EM datasets that we tested, the average improvement in resolution by OPUS-SSRI over that from RELION 3.0, the commonly used image-processing software for single-particle cryo-EM, was 0.64 Å, with the largest improvement being 1.25 Å. We expect OPUS-SSRI to be an invaluable tool to the broad field of cryo-EM single-particle analysis. The implementation of OPUS-SSRI can be found at https://github.com/alncat/cryoem.
Cryo-electron microscopy (Cryo-EM) single-particle analysis is a powerful method for determining macromolecular structures. The major advantages of cryo-EM over the traditional X-ray crystallography are that it does not require crystallization and is not plagued by the phase problem. However, there remain many new challenges in this promising technique. The central problem of cryo-EM single-particle analysis is the incompleteness of experimental observations. More specifically, the information of the relative orientations and translations of all particles is missing. Furthermore, in a dataset with multiple conformations (or substates), the membership of a specific class needs to be defined. Moreover, the signal-to-noise ratio (SNR) of a cryo-EM dataset is often very low since the electron exposure of the sample needs to be strictly limited to reduce radiation damage (1). Other problems often present in cryo-EM datasets include the nonuniform angular sampling, which frequently results in inadequate sampling or even no sampling in certain orientations (2). Therefore, the problem of cryo-EM three-dimensional (3D) reconstruction is an extremely ill-posed problem. To alleviate the ill-posedness of this problem, prior assumptions must be incorporated into the reconstruction process to ensure the uniqueness of solution and the objectivity of the final maps.
Two outstanding features of 3D density maps are sparseness and smoothness. Specifically, since the atoms in macromolecules only occupy part of the 3D maps, the macromolecular maps are often sparse in space. On the other hand, because the atoms in macromolecules are connected through chemical bonds, the electron densities of macromolecules vary smoothly across the space (3). Though sparseness is a popular prior in solving inverse problems, it is a relatively novel notion to cryo-EM 3D reconstruction. In contrast, the importance of smoothness prior is widely recognized in cryo-EM 3D refinement. An early attempt to enforce the smoothness of the density map was to apply the Wiener filter (4). Later approaches improved upon the Wiener filter by using Bayesian statistics (3). Scheres et al. assumed that the Fourier components of the density map are distributed according to Gaussian distributions (3) a priori and derived a maximum a posteriori estimation for reconstruction. This approach, as implemented in REgularised LIkelihood OptimisatioN (RELION) (5), is referred to as the traditional approach in the context of this paper. Except for incorporating priors into the reconstruction process, another line of efforts aims to enhance cryo-EM 3D refinement by optimizing the defocus parameter and class membership for each particle, as exemplified by THUNDER (6). THUNDER has been shown to improve cryo-EM refinement by providing more accurate contrast transfer function and membership for each particle.
In this paper, we continued the direction used in RELION and proposed an approach to regularize the 3D maps. Our approach, named OPUS-SSRI (Sparseness and Smoothness Regularized Imaging), focuses on imposing sparseness and smoothness priors (i.e., regularization) (7) and total variation (TV) (8). To encourage sparseness and smoothness of the density map while suppressing bias, we proposed a nonconcave, nonsmooth, real-space restraint by combining regularization and TV norm. Since such target function is difficult to optimize, we designed a reweighted scheme to approximately optimize it with a sequence of weighted and TV problem. The major differences between the traditional approach in RELION and our approach in OPUS-SSRI are outlined in detail in the Materials and Methods section. In essence, the traditional approach in RELION can be viewed as applying a translation-invariant isotropic kernel to smooth the 3D map, whereas OPUS-SSRI applies a spatially varying anisotropic kernel. Another challenge of 3D map reconstruction in real space is the prohibitive computation cost as a result of its ultrahigh dimensionality. For example, a common 512 × 512 × 512 3D volume contains hundreds of millions of variables. We addressed this challenge by leveraging a Compute Unified Device Architecture (CUDA)-accelerated implementation. In addition, we cast the back-projection as a local kernel regression problem, thus paving a way to promote the smoothness of the 3D map (9). By applying it to seven real cryo-EM datasets, we demonstrated that our OPUS-SSRI supports a significant improvement over RELION 3.0 or THUNDER, especially for systems with significant flexibility.
We tested OPUS-SSRI by performing 3D refinement on a total of seven real datasets and comparing the refinement results with those obtained using RELION 3.0 or THUNDER. The detailed experimental process and optimal parameters are reported in the SI Appendix.
According to the gold-standard Fourier shell correlation (FSC) at 0.143, the final density maps reconstructed by OPUS-SSRI clearly have higher SNRs compared to those generated by RELION 3.0 in most resolution shells for β-galactosidase (10, 11) (Fig. 1A), 80S ribosome (12) (Fig. 1B), influenza hemagglutinin (HA) (13) (Fig. 1C), transient receptor potential melastatin (TRPM4) (14) (Fig. 1D), protein-conducting ERAD channel Hrd1/Hrd3 complex (15) (Fig. 2A), transient receptor potential vanilloid 5 (TRPV5) (16) (Fig. 3A), and calcium-activated chloride channel (TMEM16A) in nanodisc (17) (Fig. 4A). The final maps refined by OPUS-SSRI have resolutions that are 0.15 to 1.25 Å better than those refined by RELION 3.0, with averaged resolution improvement of 0.64 Å for all seven systems (Table 1). The improvement of the density maps reconstructed by OPUS-SSRI is also confirmed by the model versus map FSCs. The postprocessed maps of OPUS-SSRI have much higher correlations with respect to the corresponding rigid-body fitted atomic models in most resolution shells than RELION 3.0 (SI Appendix, Fig. S1). Overall, for the seven systems, the improvements in resolution for the postprocessed maps of OPUS-SSRI are in the range of 0.14 to 0.73 Å, with an average of 0.30 Å, over those refined by RELION 3.0 (SI Appendix, Table S1).

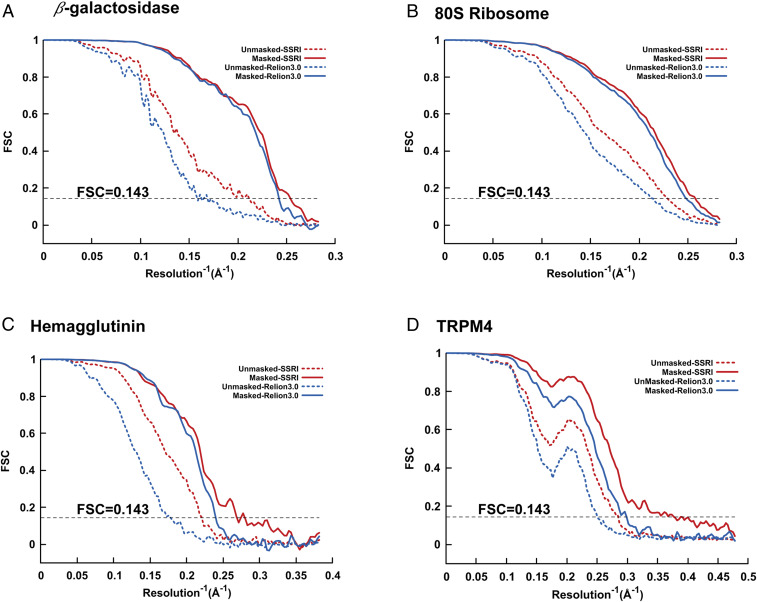
Gold-standard unmasked and masked FSC curves for the final 3D reconstructions refined by OPUS-SSRI (in red color) or RELION 3.0 (in blue color) for (A) β-galactosidase, (B) 80S ribosome, (C) influenza hemagglutinin, and (D) TRPM4. In all panels, the dashed black line represents FSC = 0.143.
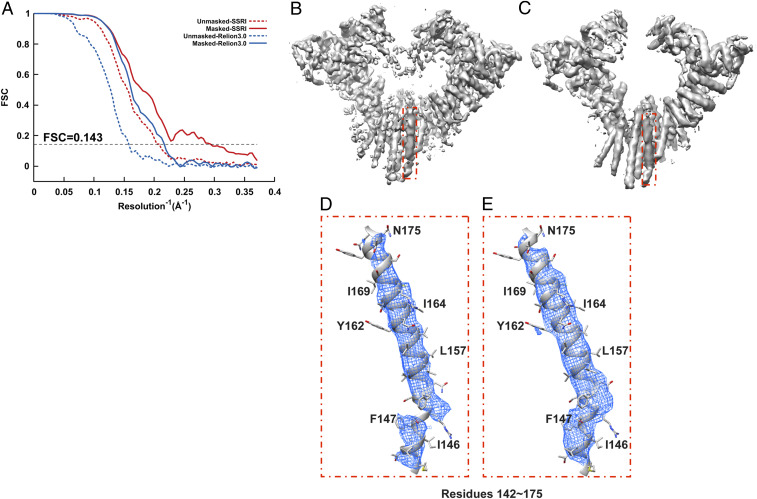
Refinement of Hrd1/Hrd3 complex. (A) Gold-standard unmasked and masked FSC curves calculated from two independent reconstructions by OPUS-SSRI or RELION 3.0. The dashed black line represents FSC = 0.143. (B) Final reconstructed cryo-EM map using RELION 3.0. (C) Final reconstructed cryo-EM map using OPUS-SSRI. The red rectangle defines a region of the EM map to be enlarged in D for RELION 3.0 and E for OPUS-SSRI for residues 142 to 175, respectively. The EM density is represented in mesh (blue), and the atomic model is shown in a ribbons diagram with side chains in stick presentation. Both density maps are contoured at the same level.
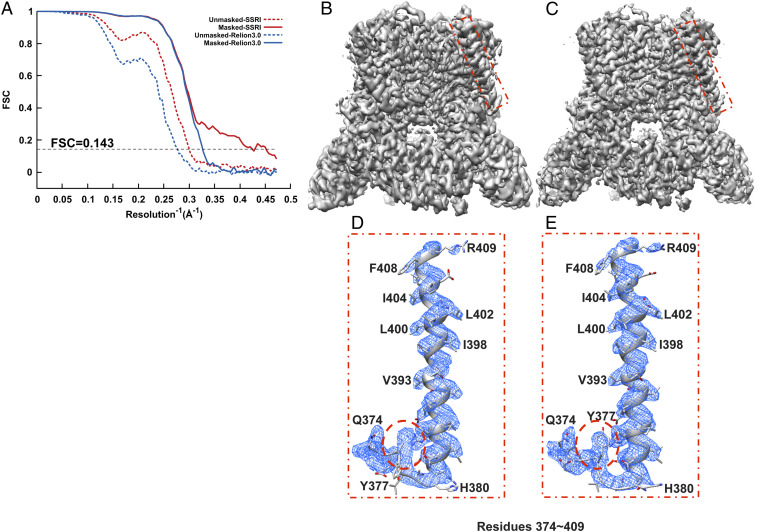
Refinement of TRPV5. (A) Gold-standard unmasked and masked FSC curves calculated from two independent reconstructions by OPUS-SSRI or RELION 3.0. The dashed black line represents FSC = 0.143. (B) Final reconstructed cryo-EM map using RELION 3.0. (C) Final reconstructed cryo-EM map using OPUS-SSRI. The red rectangles in B and C define a region of the EM map to be enlarged in D for RELION 3.0 and E for OPUS-SSRI for residues 374 to 409, respectively. The dash red circles highlight a region in the model before (D) and after (E) the manual adjustments in COOT and structural refinement using PHENIX. The EM density is represented in mesh (blue), and the structural model is represented by a ribbons diagram with side chains in stick presentation. Both density maps are contoured at the same level.
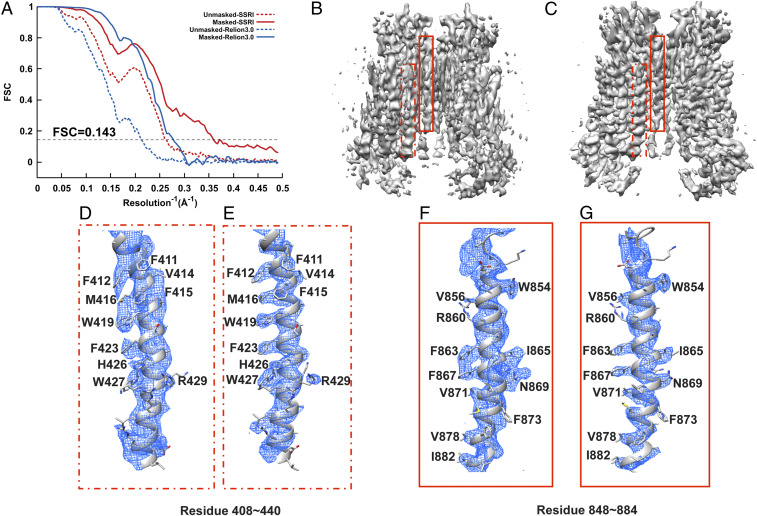
Refinement of TMEM16A in nanodisc. (A) Gold-standard unmasked and masked FSC curves calculated from two independent reconstructions by OPUS-SSRI or RELION 3.0. The dashed black line represents FSC = 0.143. (B) Final reconstructed cryo-EM map using RELION 3.0. (C) Final reconstructed cryo-EM map using OPUS-SSRI. The dashed red rectangles in B and C define a region of EM map to be enlarged in D for RELION 3.0 and E for OPUS-SSRI for residues 408 to 440, respectively. The solid red rectangles in B and C define a region of the EM map to be enlarged in F for RELION 3.0 and G for OPUS-SSRI for residues 848 to 884, respectively. The EM density is represented in mesh (blue), and the structural model is represented by a ribbons diagram with side chains in stick presentation. Both density maps are contoured at the same level.

| Proteins | Gold-standard FSC = 0.143 | |||||
| RELION | THUNDER | OPUS-SSRI | ||||
| Resolution (Å) | Resolution (Å) | ΔÅ over RELION* | Resolution (Å) | ΔÅ over RELION* | ΔÅ over THUNDER† | |
| β-galactosidase (EMPIAR-10017) | 4.16 | 4.25 | −0.09 | 3.93 | 0.23 | 0.33 |
| 80S ribosome (EMPIAR-10002) | 4.08 | 3.80 | 0.28 | 3.93 | 0.15 | −0.13 |
| Hemagglutinin (EMPIAR-10097) | 4.19 | 4.11 | 0.08 | 3.77 | 0.42 | 0.34 |
| TRPM4 (EMPIAR-10126) | 3.48 | / | / | 2.74 | 0.74 | / |
| Hrd1/Hrd3 (EMPIAR-10099) | 4.80 | 4.75 | 0.05 | 3.55 | 1.25 | 1.20 |
| TRPV5 (EMPIAR-10254) | 3.12 | 3.09 | 0.03 | 2.47 | 0.65 | 0.62 |
| TMEM16A (EMPIAR-10123) | 3.90 | / | / | 2.84 | 1.06 | / |
| Average improvement | 0.07 | 0.64 | 0.47 | |||
/ indicates that the comparison was unavailable in two cases in which THUNDER failed to execute due to computer incompatibility.
* The value in negative indicates the resultant resolution is worse than that from RELION, while the value in positive indicates the resultant resolution is better than that from RELION.
† The value in negative indicates the resultant resolution is worse than that from THUNDER, while the value in positive indicates the resultant resolution is better than that from THUNDER.
THUNDER was also run on five of these seven systems (it failed to execute on two datasets due to incompatibility with our computing facility). According to the gold-standard FSC at 0.143, the improvements in resolution by THUNDER over RELION 3.0 are in the range of −0.09 to 0.28 Å with an average of 0.07 Å (Table 1). If judged by the model versus map FSCs at 0.143, the improvements in resolution of THUNDER over RELION 3.0 are in the range of −0.18 to 0.17 Å with an average of 0.07 Å on the five systems (SI Appendix, Table S1). Of these five systems, OPUS-SSRI constantly outperforms THUNDER on four systems and only slightly underperforms THUNDER on one system (80S ribosome) as gauged by the gold-standard FSC = 0.143 and model versus map FSC = 0.143. Overall, OPUS-SSRI produces an average improvement of 0.47 Å in resolution over THUNDER for all five systems if judged by the gold-standard FSC = 0.143, with the largest improvement being 1.20 Å (Table 1 and SI Appendix, Fig. S2), and of 0.20 Å in resolution if judged by the model versus map FSC = 0.143, with the largest improvement being 0.63 Å (SI Appendix, Table S1 and Fig. S3).
Fig. 2 shows some of the structural improvements for Hrd1/Hrd3 complex in more detail. Clearly, compared to the density map reconstructed by RELION 3.0 (Fig. 2B), the density map from OPUS-SSRI is much sharper and cleaner (Fig. 2C). In fact, out of the seven systems studied, OPUS-SSRI refinement on Hrd1/Hrd3 complex results in the largest improvements in resolution (Table 1 and SI Appendix, Table S1). For instance, in the density map from RELION 3.0, there is a gap in the main-chain density between residues 147 and 148 (Fig. 2D). However, in the density map from OPUS-SSRI, the density in this region becomes continuous and strong (Fig. 2E).
Similarly, for TRPV5, comparing to the final map obtained by RELION 3.0 (Fig. 3B), the density map from OPUS-SSRI becomes much sharper with improved SNRs (Fig. 3C). Most impressively, the density map from OPUS-SSRI even allows retracing of the structural model in the region of residues 374 to 380 that was out of the density map in the original structure (highlighted in dashed red circle in Fig. 3D). After the manual adjustment in the crystallographic object-oriented toolkit COOT (18) and structural refinement using Python-based Hierarchical ENvironment for Integrated Xtallography (PHENIX) (19), the match between the model and map is substantially improved (highlighted by dashed red circle in Fig. 3E).
In addition, for TMEM16A, in contrast to the density map from RELION 3.0 (Fig. 4B), the density map obtained by OPUS-SSRI (Fig. 4C) shows sharper and smoother densities with less noise throughout. The improvement from OPUS-SSRI is highlighted for two helices in the regions of residues 408 to 440 (Fig. 4 D and E) and 848 to 884 (Fig. 4 F and G). Most impressively, in the density map refined by OPUS-SSRI, the densities for side chains of residues F412, M416, W419, and F423 (Fig. 4E) and F863, I865, F867, and N869 (Fig. 4G) become very well separated, in marked contrast to the blobs of densities from RELION 3.0 in Fig. 4 D and F, respectively.
In this paper, we proposed OPUS-SSRI, a 3D refinement method for cryo-EM single-particle analysis. The improvement of our method in gold-standard FSC of the final reconstructions is the most noticeable, which can be largely attributed to the superior denoising effect of the sparseness and smoothness priors that we introduced. By setting relatively small components in the 3D map to zero and filtering components to be more consistent with their neighbors, the sparseness and smoothness restraints can suppress the noisy densities that do not belong to the molecules in the map, thus producing cleaner reconstructions. The cleaner map in turn leads to more accurate pose estimation for each particle. These improvements brought about by our method result in an overall much-improved final reconstruction. Furthermore, the relatively large improvements for structures with heterogenous flexibility such as Hrd1/Hrd3 and TMEM16A confirm the theoretical difference between the traditional smoothness prior in RELION and our smoothness prior in OPUS-SSRI. For structures with heterogeneous flexibilities in different regions, the traditional approach in RELION enforces translation-invariant isotropic smoothness to the 3D maps, thus smearing the rigid regions and creating large biases in the reconstructions. In contrast, OPUS-SSRI can adapt to different flexibilities in different regions in the maps, thus greatly reducing biases and improving the final reconstructions. Another approach we explored to promote smoothness is by casting the back-projection as a local kernel regression problem. This formulation enables us to embed the 3D maps in a reproducing kernel Hilbert space (RKHS) with specific smoothness.
Although our method introduces five more parameters, their optimal values can be easily determined. First of all, we can set to the level of density values corresponding to molecular content in the 3D volume. This level can be easily obtained from the intermediate volumes generated by the refinement using RELION 3.0. The optimal values of , , , and can be found by grid search as detailed in SI Appendix, Experiment process and exemplified in SI Appendix, Fig. S4. The parameters were searched in the order . The complexity of the grid search depends linearly on the number of parameters. The ranges of parameters where optimal settings were found in our tests are summarized as follows: are in the range of , are in the range of , are in the range of , and are in the range of . These ranges can serve as useful guidance for future applications of OPUS-SSRI to other systems. In practice, a reasonable set of parameters can be obtained with just a few trials.
It is worth noting that OPUS-SSRI focuses on improving accuracies of pose parameters for each particle in the maximization step, which is complementary to the approach explored by THUNDER that targets other latent variables, such as defocus parameters and class membership. Hence, these two approaches can be readily combined. In fact, accurate determination of pose parameters are the prerequisites for a better per-particle defocus parameter refinement. This is exemplified by the limited improvement of THUNDER on the highly noisy dataset Hrd1/Hrd3, in which the pose of each particle was of large errors (SI Appendix, Figs. S2 and S3), yielding inaccurate reference two-dimensional (2D) projections and adversely affecting the per-particle contrast transfer function (CTF) refinement. Therefore, our OPUS-SSRI might enhance the per-particle CTF refinement on some noisy datasets by improving the pose determination of these datasets.
Finally, our tests of OPUS-SSRI on seven real datasets support that OPUS-SSRI can greatly improve the resolution of the final density map, thus allowing more accurate building of atomic models. We expect OPUS-SSRI to be an invaluable tool to the general field of cryo-EM single-particle analysis.
We clarify some notations here. For a vector , we use to represent the norm of the vector , which is defined as . represents the set of integers, while stands for the set of reals. We use to represent the 3D map, to represent the Fourier transform (FT) of , and to represent the FT of the th image. For simplicity, we often use vector representation for multidimensional data (i.e., a point with multidimensional index is mapped to the th component of ).
Formally, the FT of 3D map to be reconstructed in cryo-EM refinement can be defined as the maximizer of the penalized log marginal likelihood function (3) , where is the marginal probability (see SI Appendix, Log marginal likelihood for derivation) of given map by marginalizing over all hidden variables, such as orientation and translation (pose), and is the penalty for , which serves to reduce overfitting and guarantee the feasibility of solution.
As 3D molecular maps are both sparse and smooth, in order to incorporate these priors into refinement, a mathematical formulation for them must be developed. Conventionally, the smoothness of a function is associated with the norm of its gradient, and sparseness is referred to as the number of zeros in the values of function (20). In the following subsections, we will formulate different smoothness priors and reveal their differences. The key equations illustrating the effects of the traditional smoothness restraint and our smoothness restraint are Eqs. 2 and 5, respectively.
The traditional method (5) enforces smoothness by applying a quadratic restraint on the magnitudes of FTs based on the assumption that they are distributed according to Gaussian. Since the traditional method is an instance of Wiener filtering (21), the restraint strength depends on the SNR. The 3D map reconstructed by the traditional method can be defined as the maximizer of
where is the modulus of the spatial frequency vector of the Fourier coefficient , is the average of weights in Eq. 8, and is the SNR estimated by gold-standard FSC (22).
To understand the effect of the smoothness restraint of the traditional method, we consider the role of the restraint in the gradient ascent iteration, which is of the form
where is the damping weight for , and is the learning rate. The gradient of the traditional prior can be viewed as a smoothed map in real space. By convolution theorem, let the inverse FT of be , which is a radial function. The gradient of traditional prior is a convolution in real space, namely, , which represents a map smoothed by the translation-invariant isotropic kernel . At each step, the old solution is modified by a linear combination of the gradient of log marginal likelihood function and the radial-kernel–smoothed old solution. We thus postulate that the traditional method in RELION biases the solution toward the 3D map with homogeneous smoothness across space.
Sparseness resembles the idea of masking in the calculation of masked FSC, where the voxels which are below a certain threshold are setting to 0. The similar effects can be achieved by restraining the sum of the absolute values of densities, namely, the norm of the density map (7) during reconstruction. Hence, we can encode the sparseness using the norm (7) and the smoothness of 3D map using the TV norm (8). Though these two priors can effectively guarantee both sparseness and smoothness of the map, they also introduce biases to the final solution (23). In particular, regularization tends to underestimate true nonzero elements (23) since the corresponding soft-threshold operator shrinks the volume by a global threshold. Fan et al. discovered that nonconcave penalty can prevent true nonzero elements from being overly shrunk while preserving sparseness (23). Therefore, we employ a nonconcave penalty log norm (24) to reduce biases in the solution. The penalized log likelihood function in OPUS-SSRI has the form
where and are positive, and and are positive parameters to guard against the singularity of logarithm function at zero.
This subsection presents the algorithm to optimize the penalized log likelihood in Eq. 3. First, the log marginal likelihood function can be optimized by the expectation–maximization method (25) (see SI Appendix, Expectation maximization for derivation). The reconstruction process alternates between the expectation step in which the distribution of pose parameters for each particle is determined and the maximization step in which the 3D map is reconstructed. Secondly, to address the nonconcavity of log norm, we approximate the logarithm function by concave function and iteratively improve the approximation (24) at each maximization step (see SI Appendix, Weighted approximation for derivation). Lastly, to average 3D maps reconstructed in consecutive maximization steps, we consider leveraging implicit gradient ascent (26), which is a widely used technique to improve the stability of optimization method. The implicit gradient ascent restrains the Euclidean distance between the new solution and the 3D map of previous maximization step . These choices yield a target function in Eq. 4 by optimizing which can improve Eq. 3 (24). Formally, at the th iteration of the th maximization step, let the solution obtained in the previous iteration be . We approximate Eq. 3 with the expected log likelihood (the first term in Eq. 4) and the weighted and TV norms and define the solution at iteration as the maximizer of the following equation:
where is the conditional probability of the pose parameters given the observation and the map from the previous maximization step, and is the weight of the implicit gradient ascent penalty. The effect of log norm becomes evident after converting it to the weighted norm in Eq. 4. Reweighting each voxel yields a spatially varying threshold (Eq. 6), which can reduce the bias of prior. Next, we will demonstrate that the gradient of TV norm enforces heterogenous smoothness to the 3D map, and the norm achieves sparseness by the soft-thresholding rule while presenting the optimization algorithm.
Though TV norm is nondifferentiable at zero, we can approximate its gradient by Nesterov smoothing (27). The approximate gradient of TV norm at a voxel (see SI Appendix, Nesterov smoothed TV norm for derivation) is of the form
where is a 1 × 3 vector with 1 on the th entry and zeros elsewhere, , and , where , and is the Nesterov smoothing parameter. The gradient of the smoothed TV norm at the voxel depends on the gradients at this voxel and its neighboring voxels . Specifically, the voxel on the direction with smaller gradient has a larger contribution to the gradient of TV norm. We can write the continuous form of Eq. 5 as , where the kernel depends on the voxel and its neighboring voxel simultaneously. Therefore, the weighted TV norm smooths the map by a spatially varying anisotropic kernel , which adapts to heterogenous smoothness in the 3D map.
The differentiable function with penalty can be optimized by a joint application of gradient ascent and soft-thresholding operator (28). Denote the implicit gradient-restrained expected log likelihood as and the weight as , and let the learning rate be for the th component of at iteration. Eq. 4 can be optimized by the following equation:
where is the 3D map updated by gradient ascent, and extracts the sign of a voxel value. Eq. 6 is referred to as the soft-thresholding operator. The sparseness of the volume is preserved by the soft-thresholding operator since it sets the voxels with relatively small values to zeros. Moreover, the threshold is inversely proportional to the strength of the voxel. Therefore, the voxels with small values are more likely to be shrunk to 0 s. Since the values of electron densities for molecules are often higher than the background noises, this soft-thresholding operator can suppress noises while leaving the electron densities of molecules intact. We hence demonstrate how our restraint yields an unbiased cleaner 3D map.
In summary, Eq. 6 is applied iteratively in the maximization step. The gradient of the TV norm enforces spatially varying smoothness in gradient ascent, while the soft-thresholding operator induced by the weighted norm guarantees the sparseness of the 3D map. In all of our experiments, convergences were achieved in a maximization step after 100 iterations.
To reconstruct the 3D map, cryo-EM researchers introduced a back-projection operator, which puts the 2D FT of the image into the 3D map. As the inverse of slice operator (SI Appendix, Eq. S2), back-projection puts the data with 2D index to the 3D index according to , where is the inverse of the rotation matrix parameterized by orientation parameter . Back-projection prompts us to create a 3D volume to store the data on nonintegral indices if the orientation is randomly sampled, while the indices of the 3D map operated in computer memory are integral, namely, . Therefore, the limitation of computer memory prevents us from storing the voxel of the back-projected 2D slice in the 3D map . Nonparametric regression can be leveraged to eliminate this discrepancy by storing weighted back-projected data on integral grids (29). Using local kernel regression (see SI Appendix, Local kernel regression for derivation), the expected log likelihood can be written as
where is the kernel, is a voxel back-projected with parameter , and is the voxel storing the kernel-weighted back-projected data. Hence, in contrast to the first term in Eq. 4, this new formulation decouples the slice operator from and has variables on integral grids.
OPUS-SSRI used Gaussian kernel, which is of the form . We set the bandwidth of the Gaussian kernel to be in our implementation of OPUS-SSRI. For practical consideration, a Fourier coefficient cannot be scattered to every voxel. Since the Gaussian kernel is quickly diminishing, we let be the round operator, and we consider storing with the index on the neighboring voxels , where . In the original implementation of RELION (5), they chose a kernel with trilinear interpolation–like weight. Using the formalism introduced before, their kernel functions are of the form with and , where and are the floor and ceiling operator, respectively. Hence, a Fourier coefficient is scattered to eight neighboring voxels in the original implementation of RELION (5).
Eq. 7 has a closed form solution,
with . Ignoring regularization terms, local kernel regression estimates the value of a voxel by an integral between the kernel and neighboring experimental data , where is the normalizing factor. This convolution projects into the RKHS associated with the given kernel according to the representer theorem (9), thus enforcing to exhibit the smoothness of the RKHS induced by that kernel.
The implementation of OPUS-SSRI is based on RELION. The 3D refinement program in RELION consists of two modules, expectation and maximization. We implemented our method as a new routine in its maximization module. Therefore, when performing refinement, the expectation steps of RELION (5) and OPUS-SSRI use exactly the same settings. The gradient calculation and soft-thresholding operators are implemented with CUDA, thus allowing fast maximization.
The gold-standard FSC is the FSC between two independently refined half maps F and G (22). The gold-standard FSC of Fourier coefficients at shell relates to the SNR through , as noises inside two maps are independent (30). The frequency where the gold-standard FSC passes through 0.143 is denoted as the estimated resolution of the reconstruction. A high-resolution noise substitution method is often used to correct effects of masking in the masked FSC (30).
If there exists a high-resolution atomic structural model, we can validate the cryo-EM map by comparing it to this atomic model. The first step in calculating the model versus map FSC is fitting the atomic model into the cryo-EM density map. The model map is constructed from the fitted atomic model by sampling on the same grid as the experimental map. The model versus map FSC (31) is the correlation between the FT of the model map and the FT of cryo-EM map. The point where the model versus map FSC approaches 0.143 can be regarded as the resolution of the experimental map.
The single-particle datasets used in this paper were obtained from either the deposited particle stack or the coordinate files. In all experiments, we built the initial maps ab initio in RELION 3.0 and refined those initial maps using the three methods to be compared. The initial map building began with one round of 2D classification in RELION 3.0. The particles belonging to the major classes were then selected to build the initial map ab initio using the 3D classification procedure in RELION 3.0. The same low-pass–filtered initial maps were subsequently supplied into the three methods, RELION 3.0, THUNDER, and OPUS-SSRI, for refinement. For the datasets with specific symmetry, the symmetry was enforced throughout the refinement process. For RELION 3.0 and OPUS-SSRI, we also used the same convergence criteria [i.e., no resolution improvement and pose changes for the last two iterations (5)]. In THUNDER, the particle grading and CTF search options were set as “True” for better results. Finally, the gold-standard FSC calculations and density map postprocessing of the refinement results of all methods were carried out in RELION 3.0. In the postprocessing step, the mask was created from the final reconstruction using all particles in the 3D refinement procedure. Using relion_postprocess (30), we obtained gold-standard FSCs and the postprocessed map from independent maps by correcting the modulation transfer function of the detector and sharpening with automatically estimated B-factors. We then compared the postprocessed map with respect to the corresponding published atomic model(s) by calculating model versus map FSC using Phenix.Mtriage (32). Before comparison, the atomic model was fitted into the postprocessed density maps reconstructed by different methods using the rigid-body fit in Chimera (33).
J.M. acknowledges support from the NIH (R01-GM127628 and R01-GM116280) and the Welch Foundation (Q-1512). Q.W. acknowledges support from the NIH (R01-GM127628 and R01-GM116280) and the Welch Foundation (Q-1826). A.A.C.-A. was partially supported by a training fellowship from the Computational Cancer Biology Training Program of the Gulf Coast Consortia (Cancer Prevention and Research Institute of Texas [CPRIT] Grant No. RP170593).
The implementation of OPUS-SSRI can be found at GitHub (https://github.com/alncat/cryoem). All other study data are included in the article and supporting information.
1
3
4
5
6
7
8
9
10
11
12
13
14
15
16
17
18
19
20
21
22
23
24
25
26
27
28
29
30
31
32
 Sparseness and Smoothness Regularized Imaging for improving the resolution of Cryo-EM single-particle reconstruction
 Facebook
 Twitter
 Linkedin
 Whatsapp

