
Edited by Nils C. Stenseth, University of Oslo, Oslo, Norway, and approved November 5, 2020 (received for review July 3, 2020)
Author contributions: R.O., C.S., E.M., and A.C. designed research; R.O. and A.C. performed research; R.O. and A.C. analyzed data; and R.O., C.S., E.M., and A.C. wrote the paper.
While antimicrobial resistance is an urgent global problem, substantial clinical surveillance gaps exist in low- and middle-income countries (LMICs). We fill the gaps in the global prevalence map of nine pathogens, resistant to 19 (classes of) antibiotics (representing 75 unique combinations), based on the robust correlation between countries’ socioeconomic profiles and extensive surveillance data. Our estimates for carbapenem-resistant Acinetobacter baumannii and third-generation cephalosporin-resistant Escherichia coli benefit over 2.2 billion people in countries with currently insufficient diagnostic capacity. We show how structural surveillance investments can be prioritized based on the magnitude of prevalence estimated (Middle Eastern countries), the relative prevalence increase over 1998 to 2017 (sub-Saharan African countries), and the improvement of model performance achievable with new surveillance data (Pacific Islands).
Surveillance is critical in containing globally increasing antimicrobial resistance (AMR). Affordable methodologies to prioritize AMR surveillance efforts are urgently needed, especially in low- and middle-income countries (LMICs), where resources are limited. While socioeconomic characteristics correlate with clinical AMR prevalence, this correlation has not yet been used to estimate AMR prevalence in countries lacking surveillance. We captured the statistical relationship between AMR prevalence and socioeconomic characteristics in a suite of beta-binomial principal component regression models for nine pathogens resistant to 19 (classes of) antibiotics. Prevalence data from ResistanceMap were combined with socioeconomic profiles constructed from 5,595 World Bank indicators. Cross-validated models were used to estimate clinical AMR prevalence and temporal trends for countries lacking data. Our approach provides robust estimates of clinical AMR prevalence in LMICs for most priority pathogens (cross-validated q2 > 0.78 for six out of nine pathogens). By supplementing surveillance data, 87% of all countries worldwide, which represent 99% of the global population, are now informed. Depending on priority pathogen, our estimates benefit 2.1 to 4.9 billion people living in countries with currently insufficient diagnostic capacity. By estimating AMR prevalence worldwide, our approach allows for a data-driven prioritization of surveillance efforts. For carbapenem-resistant Acinetobacter baumannii and third-generation cephalosporin-resistant Escherichia coli, specific countries of interest are located in the Middle East, based on the magnitude of estimates; sub-Saharan Africa, based on the relative prevalence increase over 1998 to 2017; and the Pacific Islands, based on improving overall model coverage and performance.
Antimicrobial resistance (AMR) increases morbidity, mortality, and health-care expenditures worldwide. Surveillance has a key role in supporting policies and stewardship to contain AMR. Surveillance strategies are implemented globally through surveillance networks such as the World Health Organization’s (WHO) Global Antimicrobial Surveillance System (GLASS) (1), regional and national surveillance programs, and small-scale efforts within hospitals and laboratories. These fragmented data have been aggregated to describe national AMR trends in Europe (2) and across the globe through initiatives such as ATLAS (Antimicrobial Testing Leadership and Surveillance) (3), ResistanceOpen (4), and ResistanceMap (5). To date, ResistanceMap is the most comprehensive resource, with data from 14.3 million tested isolates covering 74 countries during the period 1998 to 2017.
As setting up and maintaining surveillance are expensive in terms of direct costs, human resources, and infrastructure, the status of clinical AMR in low- and middle-income countries (LMICs) remains largely unknown. This lack of information limits the support for empirical and targeted treatment guidelines, risking further exacerbation of AMR levels due to inappropriate antibiotic usage. Affordable alternative ways to systematically estimate AMR prevalence in LMICs are thus urgently needed.
While many countries lack structural data on clinical AMR, their socioeconomic status is more extensively characterized. The World Bank collates information on 10,000+ standardized metrics across all world countries over time (6). Various previous works showed significant correlations between AMR prevalence and socioeconomic factors for a large number of countries, including LMICs (19 to 103 countries per study) (7891011121314–15). Examples of socioeconomic determinants of AMR prevalence are the income status of individual countries (8), the extent of their out-of-pocket health expenditure (7), and poor governance and corruption (11). Recently, these correlations were utilized to complete the historical record for 52 countries and forecast their national trends toward 2030 for eight priority pathogens (13). However, no previous study has yet leveraged these correlations to systematically estimate AMR prevalence in regions where no historical data are available.
To fill current gaps in the global prevalence map of clinical AMR, we developed a statistical model able to predict AMR prevalence based on exhaustive, unbiased socioeconomic World Bank profiles. Here we show that the model, trained and evaluated through robust cross validation, has high predictive accuracy for some of the most critical pathogens (Acinetobacter baumannii, Enterobacter aerogenes/cloacae, Enterococcus faecalis, Enterococcus faecium, Escherichia coli, Klebsiella pneumoniae, Pseudomonas aeruginosa, Staphylococcus aureus, and Streptococcus pneumoniae) (16).
We obtained the entire World Bank database of 10,489 standardized metrics on 9 April 2019. We used a subset of 5,595 indicators, excluding those with limited coverage or variation (SI Appendix, section S1), to construct 3,948 World Bank profiles, each reflecting the socioeconomic status of one unique country–year combination. For 710 of these profiles, resistance rates for at least one pathogen were available from ResistanceMap (5). Resistance rates are reported as the fraction of all invasive isolates, cultured from blood or cerebrospinal fluid, that exceeds susceptibility breakpoints set by the Clinical and Laboratory Standards Institute (CLSI) (∼40% of all isolates in ResistanceMap) or by the European Committee on Antimicrobial Susceptibility Testing (EUCAST) (∼60% of all isolates in ResistanceMap). We obtained data for 75 unique combinations of pathogens and (classes of) antibiotics on 9 October 2019, representing AMR prevalence in 74 countries during the period 1998 to 2017 (SI Appendix, Fig. S1).
We performed a principal component regression to develop a suite of candidate models per pathogen in an iterative manner. Principal components of the 5,595 indicators were computed with the nonlinear iterative partial least squares algorithm, enabling imputation of incomplete datasets such as the World Bank database. We used the entire dataset of 3,948 World Bank profiles to ensure our models’ applicability to countries without AMR prevalence data and selected the first 30 principal components for model development, as these retained the underlying variability structure of the full set of indicators well (Mantel test with a P value of 0.001). Using all country–year combinations for which resistance data were available, beta-binomial vector generalized linear models were developed per pathogen. These models handle overdispersion in the data while accounting for variation in the number of isolates tested. In addition to the principal components, we incorporated year of isolation as a continuous predictor, including its quadratic component, and antibiotic (class) as a categorical predictor. The most parsimonious models were then identified using a backward Akaike Information Criterion-based stepwise reduction of the full models. To identify countries with a relatively large influence on the model, we performed a grouped Cook’s distance analysis. As a cutoff for disproportionate influence, we used the median point of the F distribution, , with P being the number of predictors and n being the number of countries with data. If the highest Cook’s distance exceeded the cutoff, we repeated the procedure without the respective country. Otherwise, the suite of candidate models was finalized for the specific pathogen. SI Appendix, section S1 extensively describes the computational procedure.
Per pathogen, the candidate model with the highest Bhattacharyya coefficient was selected for application (17). This coefficient reflects the overlap between the socioeconomic profiles used in model development and those for which prevalence is to be estimated. Consequently, the model with the highest Bhattacharyya coefficient should result in the most accurate estimates. Moreover, we analyzed the extent of geographical autocorrelation present in the surveillance data and in our prevalence estimates to ensure that no artificial (lack of) autocorrelation was introduced by our models (SI Appendix, section S7).
The predictive performance of the selected models was quantified by their predictive correlation coefficient q2, obtained via a five times repeated fivefold groupwise cross validation. Antibiotics were balanced between the folds, and all records from the same country were always included in the same fold. This ensures that individual countries are never represented in multiple folds, effectively forcing the testing of more distant records and thus reducing optimism in error estimates. Cross-validation results were further used in a logistic recalibration to assess their level of over- or underfitting and potential bias and, in the computation of a calibration belt, to identify specific ranges of over- or underestimation (18).
We estimated the prevalence of clinical AMR for all country–year combinations not represented in ResistanceMap, but with sufficient World Bank data. National estimates were combined with measured data and aggregated into human population-weighted mean values, both at the global scale and per World Bank–assigned income class. This allowed the assessment of supernational time trends of clinical AMR over the period 1998 to 2017. We also calculated the mean yearly increase factor for individual countries.
To quantify how overall predictions might improve by adding new surveillance data, we generated a set of 30 fictitious isolates per country, the threshold number for CLSI antibiogram reporting and the minimum number of isolates required for inclusion in ResistanceMap (5). Each set of isolates reflected that country’s most recent estimate for the specific combination of pathogen and antibiotic (class). By adding one of these sets to the existing resistance data and retraining and reapplying the model for the respective pathogen, we quantified the relative reduction in the total (summed) prediction error. We distinguished between direct effects, i.e., error reductions for the country with new surveillance data, and indirect effects, i.e., error reductions for other countries due to overall model improvement.
To corroborate our estimates of carbapenem resistance (CR) prevalence in Acinetobacter baumannii (AB) and third-generation cephalosporin resistance (3GCR) prevalence in Escherichia coli (EC), we reviewed the available literature for reviews and meta-analyses of resistant invasive isolates in the 10 countries where our estimates were highest. SI Appendix, section S2 contains a detailed description of the procedure followed. We identified 11 studies on CR in AB that fulfilled our criteria and 3 on 3GCR in EC. References to underlying studies were assessed if they explicitly included blood or cerebrospinal fluid isolates. Through this cross-referencing, 17 additional local studies were identified for CR in AB, but none were identified for 3GCR in EC.
We modeled the statistical association between antibiograms from the ResistanceMap repository and exhaustive socioeconomic profiles from the World Bank database. We checked model accuracy through a robust cross-validation procedure. Overall, the models showed high predictive accuracy, with q2 values between 0.78 and 0.86 for six out of nine pathogens. The predictive accuracy was lower for Pseudomonas auruginosa (q2 = 0.58) and Staphylococcus aureus (q2 = 0.56) (Fig. 1A). The performance for the (predominantly) community-associated pathogen Streptococcus pneumoniae was substantially less (q2 = 0.27).

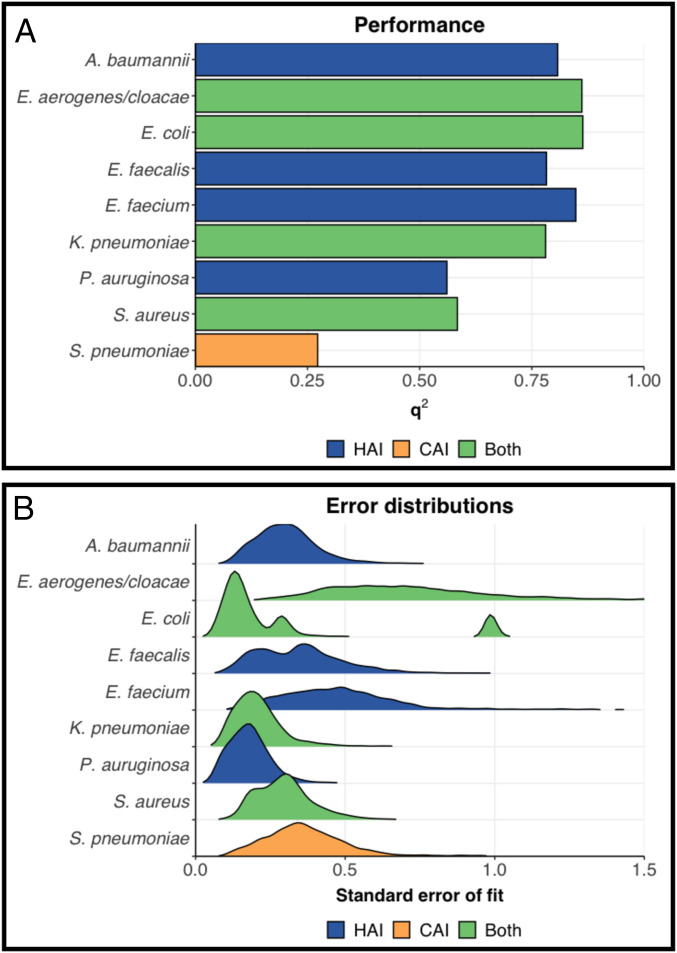
Performance and robustness of the models constructed: (A) square correlation coefficient q2, derived via a five times repeated fivefold groupwise cross validation and (B) distribution of prediction errors at the scale of the linear predictors. HAI: (predominantly) hospital-associated pathogens; CAI: (predominantly) community-associated pathogens; Both: pathogens associated with both hospital and community. Classification is based on WHO’s description of priority pathogens list.
Prediction errors were largest for Enterobacter aerogenes/cloaecae and Enterococcus faecium and for E. coli estimates in Iran and Indonesia specifically (Fig. 1B). E. aerogenes/cloaecae and E. faecium are represented in ResistanceMap by a relatively small number of 13 and 46 countries, respectively (SI Appendix, Fig. S1C). Consequently, while accurately predicting clinical AMR prevalence in similar countries, performance is lower for target countries with divergent characteristics. Indeed, prediction errors increase when the socioeconomic profiles of target countries lie further from the countries used in model development (SI Appendix, Fig. S3A).
To assess the stability of our estimates under the influence of model parameterization uncertainty, we constructed a multivariate normal distribution per model with their fitted coefficients as the mean and their variance–covariance matrix as the variance (13). From these, we drew 1,000 sets of possible coefficients, with each computing a new estimate per target country. Uncertainty intervals for each target country’s most recent estimates are shown in SI Appendix, Table S7. Stable rankings of all countries indicate little impact of parameter uncertainty on the overall prioritization of surveillance when based on our estimates (Spearman’s ρ > 0.93 for all pathogens; SI Appendix, Table S8). However, estimates for Indonesia, Iran, Russia, and Brazil were more volatile, i.e., disproportionally influenced by parameter uncertainty. This volatility can, at least partly, be explained by the major contributions of population- and gross domestic product-related indicators to the first principal components (SI Appendix, Fig. S5).
To further examine the validity of our models, we conducted a calibration analysis per pathogen. These analyses indicated limited over- or underfitting for all pathogens except S. pneumoniae and no systematic bias for all pathogens except S. pneumoniae and K. pneumoniae (SI Appendix, Fig. S3). The prevalence of resistance in K. pneumoniae was slightly overestimated over the full range of prevalence values. Our models further tend to overestimate the higher prevalence of resistance for most pathogens and underestimate the lower prevalence of resistance for some pathogens (SI Appendix, Fig. S4). Despite these deviations at the limits of the resistance prevalence spectrum, calibration analyses confirmed that for the majority of pathogens we can provide actionable insights for surveillance prioritization.
Here we highlight the implications for two priority pathogens: 1) carbapenem-resistant Acinetobacter baumannii (CRAB), the leading cause of hospital-associated infections, and 2) Escherichia coli resistant to third-generation cephalosporins (3GCREC), widely responsible for both community- and hospital-acquired infections. Both are classified as critical priority pathogens by WHO (16). An overview of the final models of all pathogens is included in SI Appendix, Table S1.
We improved the coverage of the global prevalence map of clinical AMR from 24% (CRAB; Fig. 2A) and 29% (3GCREC; Fig. 2D) to 87% of all 235 countries and areas specified by the United Nations (19). The remaining 13% are overseas territories or disputed areas with limited World Bank information. Our estimates represent populations of ∼2.5 (CRAB) and 2.2 (3GCREC) billion people, increasing coverage to 99% of the global population. Most of the added population lives in low-income (0.7 billion) and lower middle-income (1.2 billion for CRAB; 0.9 billion for 3GCREC) countries.
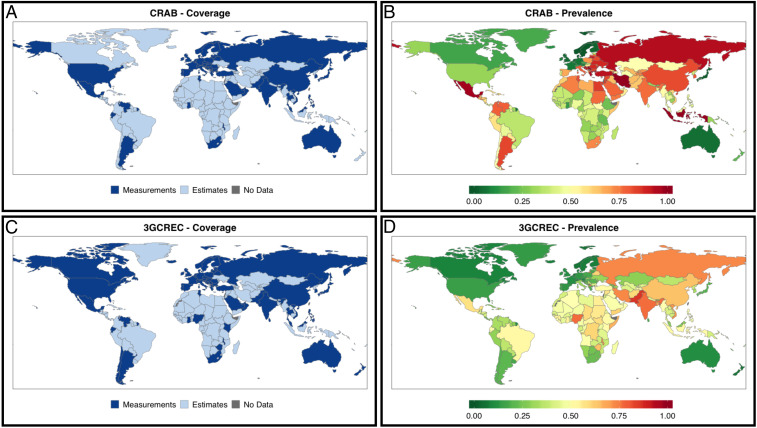
Global coverage and prevalence of carbapenem resistance in A. baumannii and third-generation cephalosporin resistance in E. coli. (A) Coverage of CRAB measurements (24% of countries and areas; 66% of global population) increases by supplementing with estimates (87% of countries; 99% of global population). (B) Measured and estimated CRAB for the most recent year available or possible. (C) Coverage of 3GCREC measurements (29% of countries and areas; 70% of global population) increases by supplementing with estimates (87% of countries; 99% of global population). (D) Measured and estimated 3GCREC for the most recent year available or possible.
Per pathogen, SI Appendix, Table S7 provides our most recent national estimates for countries not included in ResistanceMap. Estimates of CR in AB and 3GCR in EC were generally highest in countries located in the (Greater) Middle East, most notably in Iran, with 100% and 73% prevalence in 2017, respectively. Iran has been enrolled in GLASS since 2016 but submitted few isolates to the GLASS call for 2017 data: 10 E. coli blood isolates, indicating 90% prevalence of 3GCR (95% confidence interval [CI] 60 to 100%), and 8 A. baumannii blood isolates indicating 100% prevalence of CR (95% CI 68 to 100%), both in line with our estimates (1). Our literature review yielded four meta-analyses assessing CRAB in Iran, reporting aggregate resistance ranging from 55 to 91% (SI Appendix, Table S2). These percentages are lower than our 100% estimate but reflect long-term pooled prevalence rates of isolates with a mixed origin sampled between 1995 and 2018. In fact, one local study from Iran that included only invasive isolates (n = 59; collected in 2012 to 2013) reported 100% resistance to both imipenem and meropenem (20). Further, we identified a recent meta-analysis of E. coli resistance against the fourth-generation cephalosporin cefepime, reporting 62% resistance (95% CI 57–67%), based on 347 isolates from survey years 2012 to 2014 (SI Appendix, Table S3) (21). These estimates are highly concordant with our estimates for the same period, i.e., 62% in 2012 to 75% in 2014.
Our 2017 estimates of the prevalence of CR in AB also fill important gaps for other Middle Eastern countries, including Lebanon (92% prevalence estimated), Jordan (86%), Egypt (85%), Syria (83%), and Sudan (77%); for 3GCR in EC they are Yemen (61%), Afghanistan (60%), Syria (57%), and Sudan (56%). A comprehensive review of countries of the Arab League reported values similar to, albeit somewhat lower than, our predictions for CR in AB: 77 to 91% in Lebanon (three local studies, 2010 to 2015), 64% in Jordan (one local study, 2009 to 2010), 70 to 96% in Egypt (two local studies, 2012 to 2016), 71% in Syria (one local study, 2008 to 2011), and 89% in Sudan (one local study, 2011 to 2014) (22). For 3GCR in EC, 53 to 62% resistance derived from local Syrian data (four studies) was in line with our prediction of 57%, while 35% resistance for Sudan (one study) was lower than our estimate of 56% (22).
Altogether, our highest estimates of carbapenem resistance in invasive A. baumannii and third-generation cephalosporin resistance in invasive E. coli are consistent with the sparse local data available from the open literature (SI Appendix, Tables S2 and S3).
To obtain insights into temporal trends of resistance, i.e., globally and per World Bank–assigned income class, we aggregated national estimates and measurements into (population-weighted) mean yearly prevalence values. The global prevalence of CR in AB increased from below 40% in 1998 to over 60% in 2008, after which it stabilized, fluctuating between 60% and 70% over the last decade (Fig. 3A). Trends across income classes were similar, although the relative increase in low-income countries was larger, as the steepest increases were estimated in low- and lower middle-income countries (Fig. 3B). This particularly relates to countries in sub-Saharan Africa, e.g., Angola (yearly increase with a factor of 1.58), Cameroon (factor of 1.36), Burkina Faso, and Equatorial Guinea (factor of 1.35).
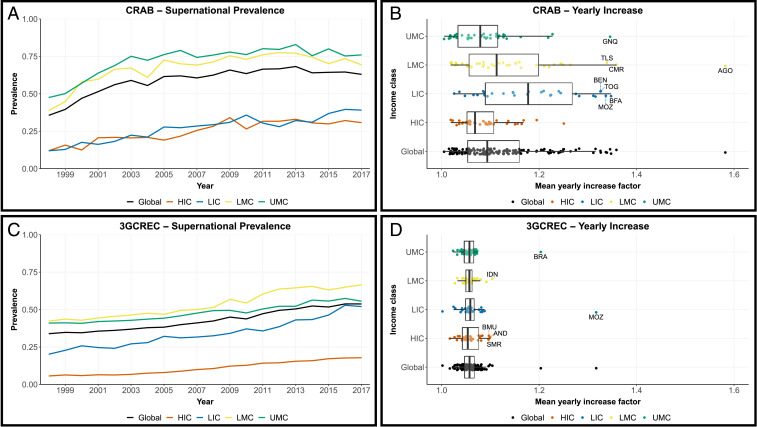
Temporal trends of resistance worldwide (black), in low-income countries (LIC; blue), lower middle-income countries (LMC; yellow), upper middle-income countries (UMC; green), and high-income countries (HIC; orange) over the period 1998 to 2017. (A and C) Human population-weighted mean resistance prevalence of carbapenem resistance in A. baumannii and third-generation cephalosporin-resistance in E. coli, respectively. (B and D) Tukey box and whisker plots of mean yearly increase factors in all countries without systematic national surveillance for CRAB and 3GCREC, respectively. Positive outliers, based on the global box whisker plots, are labeled with their ISO3 code (International Organization for Standardization alpha-3 code). AGO: Angola; AND: Andorra; BEN: Benin; BFA: Burkina Faso; BMU: Bermuda; BRA: Brazil; CMR: Cameroon; GNQ: Equatorial Guinea; IDN: Indonesia; MOZ: Mozambique; SMR: San Marino; TLS: Timor-Leste; TOG: Togo.
In contrast with CR in AB, the prevalence of 3GCR in EC has steadily increased since surveillance started (Fig. 3C). With an average 1.0% yearly increase, global resistance rose from 34 to 54% over the period 1998 to 2017. Moreover, trends were indiscriminate of income class or geography (Fig. 3D).
The introduction of structural surveillance in a given country may have both direct and indirect benefits mediated by the model, as new local data might improve estimates for other similar countries. This notion enables us to identify countries where surveillance could best improve overall estimates of CR in AB (Fig. 4A) and 3GCR in EC (Fig. 4B). Based on the principal components included in the respective models, an agglomerative hierarchical clustering analysis identified clusters of similar countries (Roman numerals in Fig. 4). Their composition is shown in SI Appendix, Tables S4 and S5. Estimates for Indonesia (singleton v in Fig. 4A; singleton xix in Fig. 4B) and Iran (singleton vi in Fig. 4A; singleton xx in Fig. 4B) were least accurate, as indicated by the direct error reduction achievable with new surveillance data (orange bars in Fig. 4). Since these countries do not cluster, new data generated in Iran or Indonesia will marginally improve estimates for other countries. In contrast, cluster xii in Fig. 4A and, to a lesser extent, cluster xv in Fig. 4B represent a group of data-poor countries where new surveillance data could substantially improve the parameter space covered by the models (purple bars in Fig. 4). These clusters consist of various smaller (predominantly) island states.
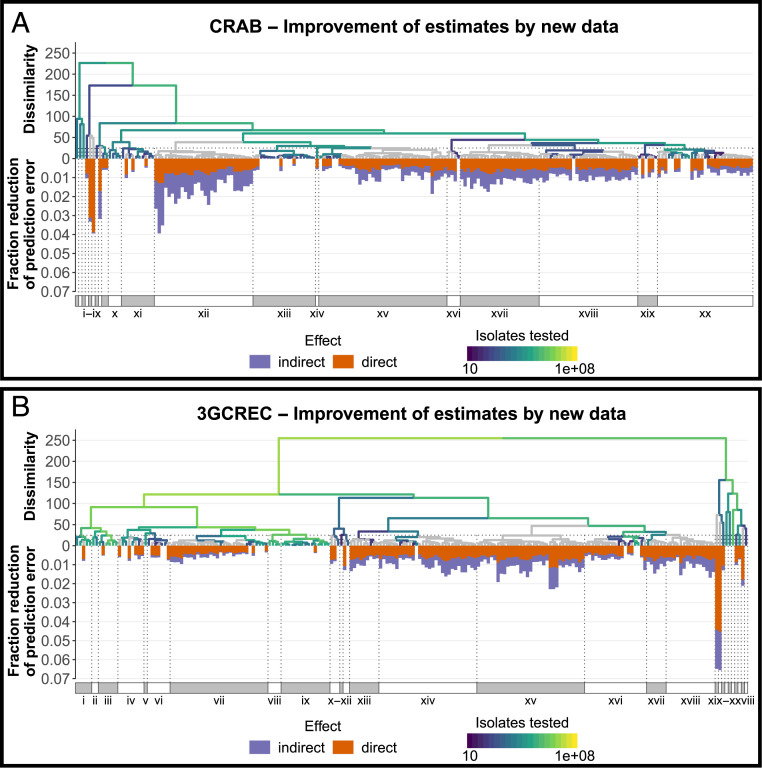
Potential reduction of the total (summed) prediction error in all estimated resistance rates for 2017, should resistance data for 2017 become available for the specific country. Hierarchical clustering of all countries based on the set of principal components used in the respective models, with gradient indicating number isolates available from ResistanceMap tested for carbapenem resistance in A. baumannii (A) or third-generation cephalosporin resistance in E. coli (B). Gray: no data. Roman numerals indicate clusters of countries based on a dissimilarity threshold of 25 (total within-cluster sum of squares), with their composition listed in SI Appendix, Tables S4 and S5, respectively. Bars represent indirect (purple) and direct (orange) reductions of the summed prediction error over all estimated resistance rates for 2017, should surveillance data from 2017 become available for the specific country.
Our global maps of national resistance prevalence provide data-driven criteria for the prioritization of surveillance efforts in LMICs. First, surveillance might be prioritized in countries where high resistance rates are expected. Our analyses of carbapenem-resistant A. baumannii and third-generation cephalosporin-resistant E. coli indicate such countries are often located in the (Greater) Middle East (Fig. 2). While acknowledging that the calibration results indicate that our models have a slight tendency to overestimate resistance prevalence at the upper limit of the spectrum (SI Appendix, Fig. S4), estimates for CRAB and 3GCREC were consistent with available literature (SI Appendix, section S2). As such, our results support concerns raised on the alarming potential for AMR to develop into a “perfect storm” in parts of the Middle East that are burdened by conflict, such as Syria, Yemen, and Iraq (23).
Model performance for the community-associated pathogen S. pneumoniae was much lower compared to the other pathogens. This might indicate that resistance prevalence in pathogens predominantly acquired within the community correlate less well with countries’ socioeconomic characteristics than resistance prevalence in hospital-associated pathogens and that other factors might play a role. A more likely explanation is the fact that vaccination against pneumococcal disease reduces resistance prevalence in S. pneumoniae, both through direct action and indirectly by lowering antibiotic consumption (24, 25), and global immunization initiatives such as GAVI (Global Alliance for Vaccines and Immunization), providing vaccines to LMICs, have successfully weakened plausible correlations between pneumococcal conjugate vaccine coverage and countries’ socioeconomic status (26). In contrast, vaccines for the other pathogens studied are not available.
Second, in addition to countries with high estimated AMR, surveillance efforts might be prioritized in countries where AMR is estimated to increase rapidly. Our prevalence trends highlight various countries in sub-Saharan Africa as being important (Fig. 3), especially for carbapenem-resistant A. baumannii, and support previous calls for systematic surveillance to inform empirical treatment guidelines in this region of the world (27). In contrast to CR in AB, the prevalence of 3GCR in EC has increased steadily and indiscriminate of geography (Fig. 3D). Globally, we estimate an average yearly prevalence increase of 1.0%, as its global prevalence rose from 34 to 54% over the period 1998 to 2017 (Fig. 3C). Recently, Alvarez-Uria and colleagues forecasted a global trend with a similar slope of 0.83%, but with a 13% higher intercept (28). This is likely due to the high (∼80%) resistance prevalence in India, which, with its low per capita income and large population size, had a major influence on their global estimate. In our model, however, India’s unique profile makes it less informative for other countries, reducing its impact on the global mean estimate.
Third, prioritization of surveillance efforts might focus on improving model predictions. The Pacific Islands form an interesting cluster of countries where surveillance of AMR has been limited so far (29) but where new surveillance data would most improve overall model performance (Fig. 4). In addition to these regions, Latin America and the Caribbean (LAC) form another extensive region largely absent from ResistanceMap. While they did not explicitly emerge as priority countries, LAC countries of interest for CRAB are Colombia (79% resistance estimated), El Salvador (74%), and Guatemala (67%). Countries of interest for 3GCREC are Haiti (55%), Brazil (52%), and Guatemala (45%). Although most LAC countries participate in the long-running Latin American Antimicrobial Resistance Surveillance Network (ReLAVRA), the sample type and origin of isolates were not reported to ReLAVRA before 2018. Since our research specifically focuses on AMR in invasive clinical isolates, these data could not be included. Nevertheless, following extensive curation, aggregation, and harmonization, additional data from other (supra)national surveillance networks (30), as well as from alternative sources like academic institutes, pharmaceutical companies, and private laboratories (31), should be harnessed to further fill the global map of clinical AMR and increase the reliability of our estimates.
It is widely acknowledged that laboratory-based surveillance is prone to selection bias, especially in LMICs, where access to quality microbiology diagnostics is poor and routine diagnostics are often limited to treatment failures and specialized tertiary care facilities (32). These limitations propagate into our prevalence estimates, and they should thus be interpreted as an approximation of the true prevalence in a country. Future unbiased surveillance will likely require novel approaches, e.g., population-based surveillance (33, 34), for which the necessary resources and infrastructure are not yet in place. Our predictive framework provides a means to support the prioritization of investments required for this.
Comparisons across countries are complicated by discrepancies between CLSI and EUCAST susceptibility break points, with the latter generally more stringent and thus resulting in higher resistance rates (35). Any potential bias introduced into our models by these discrepancies could be reduced by further international harmonization of methods and breakpoints (36).
Our approach has several limitations. While our estimates of AMR prevalence can support national surveillance strategies, subnational heterogeneity in resistance prevalence reduces their local usefulness, especially in large and highly populated countries such as India (37). Due to its generic nature, however, our approach inherently allows for assessments at a more local scale, provided that both socioeconomic indicators and clinical AMR data are available at such a local level. The benefit of expanding our approach subnationally is further emphasized by the fact that parameter uncertainty specifically affects prevalence estimates in emerging economies with large population sizes (SI Appendix, Table S7).
We leveraged the full extent of the World Bank database in a principal component regression, reducing its high dimensionality while retaining the underlying variability structure. This comes with limitations of interpretability. Because principal components are obtained from only the World Bank indicators, the constraints imposed on their coefficients have no direct relationship with how they might affect prevalence rates, obscuring univariate relationships between underlying indicators and AMR prevalence (38). Additionally, by applying our models predictively we inherently assumed that the correlations found for predominantly upper middle- and high-income countries are universally valid. This also limits the applicability of our approach to pathogens that are globally relevant and therefore broadly included in surveillance programs. Consequently, priority pathogens that specifically burden LMICs, e.g., fluoroquinolone-resistant Salmonella species (16), would require a more regional or local approach since truly global data are not, and will not, become available.
As AMR forms the quintessential One Health issue, indicators from other domains might improve prevalence estimates (39). The flexibility of our approach allows for integration of such indicators in future analyses when sufficient data become available. Interesting candidates are metagenomics data from human sewage (40, 41) and climatic parameters such as temperature, which correlates with clinical AMR (42). Furthermore, antibiotic consumption was no predictor in our models. Although it is commonly considered one of the key drivers of AMR (43, 44), data scarcity would either require extensive imputation (13) or substantially reduce the number of complete records available for model development. Instead, we considered antibiotic consumption a midpoint indicator, thus assuming international variability in antibiotic consumption to be intrinsically captured by our socioeconomic profiles. This assumption is supported by a sensitivity analysis using antibiotic consumption data available from ResistanceMap (45) (SI Appendix, section S6) and by previous studies showing antibiotic consumption parallel socioeconomic indicators such as the Human Development Index and aging of the population (46), gross domestic product per capita (43), out-of-pocket health expenditure, population by age group, population density, and GDP (13).
The prevalence of AMR in clinical priority pathogens is unknown in many regions of the world, and more than 2 billion people live in countries without data on even the most surveyed pathogens. The majority of these countries are LMICs. Our improved global maps of clinically relevant AMR provide a means to close this knowledge gap in a most efficient way.
We thank Prof. P. M. A. Sloot for helpful discussions. We acknowledge the extensive work underlying the World Bank and ResistanceMap databases, which were of vital importance for this work. This research was funded by European Union Research and Innovation program Horizon 2020 (project ID 874735), by the Netherlands Organization for Health, Research and Development (ZonMw; project ID 549009002), and by the State Education Development Agency Republic of Latvia (VIAA; project ID ES RTD/2020/04). Funding by the latter two was received under the Joint Programme Initiative on Antimicrobial Resistance (JPIAMR) 2019 call. E.M. and A.C. were supported by a grant from the Institute for Advanced Study of the University of Amsterdam.
All study data are included in the article and SI Appendix.
October 4, 2021: The text of this article has been updated; please see accompanying Correction for details.
1
2
3
4
5
6.
7
8
9
10
11
12
13
14
15
16
17
18
19.
20
21
22
24
25
26
27
28
29
30
31
32
33
34
35
36
37
38
39
40
41
42
43
44
45
46
 Filling the gaps in the global prevalence map of clinical antimicrobial resistance
 Facebook
 Twitter
 Linkedin
 Whatsapp

