
Contributed by Roger D. Cone, February 11, 2021 (sent for review June 1, 2020; reviewed by Mark L. Andermann and Michael J. Krashes)
Author contributions: P.S., C.C., I.R., and R.D.C. designed research; P.S. and C.C. performed research; P.S., C.C., I.R., and R.D.C. analyzed data; R.D.C. edited and wrote components of the paper; and P.S., C.C., and I.R. wrote the paper.
Reviewers: M.L.A., Beth Israel Deaconess Medical Center; and M.J.K., NIH.
1P.S. and C.C. contributed equally to this work.
Paraventricular nucleus (PVN) neurons expressing the melanocortin 4 receptor (MC4R) integrate hormonal and neuronal information concerning energy availability and engage neural circuitry controlling feeding, metabolism, and neuroendocrine function in response to changes in body weight and stored energy. Thereby, the dynamic activity of PVN MC4R neurons may serve as a neural representation of body weight “set point.” Here, we demonstrate that PVN MC4R neuronal activity is bidirectionally regulated by changes in energy state, as neuronal activity is gradually suppressed during fasting and increased in response to refeeding. Together, these findings provide a framework for understanding how hunger and satiety are controlled within critical neurons involved in energy homeostasis.
Mutations in the melanocortin 4 receptor (MC4R) result in hyperphagia and obesity and are the most common cause of monogenic obesity in humans. Preclinical rodent studies have determined that the critical role of the MC4R in controlling feeding can be mapped in part to its expression in the paraventricular nucleus of the hypothalamus (paraventricular nucleus [PVN]), where it regulates the activity of anorexic neural circuits. Despite the critical role of PVN MC4R neurons in regulating feeding, the in vivo neuronal activity of these cells remains largely unstudied, and the network activity of PVN MC4R neurons has not been determined. Here, we utilize in vivo single-cell endomicroscopic and mathematical approaches to determine the activity and network dynamics of PVN MC4R neurons in response to changes in energy state and pharmacological manipulation of central melanocortin receptors. We determine that PVN MC4R neurons exhibit both quantitative and qualitative changes in response to fasting and refeeding. Pharmacological stimulation of MC4R with the therapeutic MC4R agonist setmelanotide rapidly increases basal PVN MC4R activity, while stimulation of melanocortin 3 receptor (MC3R) inhibits PVN MC4R activity. Finally, we find that distinct PVN MC4R neuronal ensembles encode energy deficit and energy surfeit and that energy surfeit is associated with enhanced network connections within PVN MC4R neurons. These findings provide valuable insight into the neural dynamics underlying hunger and energy surfeit.
Food intake and body weight are tightly controlled by neural circuitry in the hypothalamus (1, 2). Certain key neurons within the hypothalamus adaptively react to reductions in energy stores, as signaled by reduction in the serum hormone leptin, by engaging neural circuits promoting food intake and reducing energy expenditure. Conversely, excess energy consumption engages these same pathways to both suppress feeding and increase energy expenditure. Hypothalamic neural circuits thus act to maintain body weight at a stable “set point” by activating behavioral, neuroendocrine, and autonomic pathways in response to acute changes in energy stores. The melanocortin 4 receptor (MC4R) is a G protein-coupled receptor expressed in paraventricular hypothalamic neurons and is well established to act as a master regulator of body weight set point (3, 4). Loss of function mutations in the MC4R and genetic deletion of MC4R both result in hyperphagia and severe obesity in humans, mice, rats, and fish (5678–9). Furthermore, mutations in the MC4R are the most common cause of severe monogenic obesity in humans, representing up to 5% of syndromic obesity cases and occurring in as many as 1 in 300 individuals (6, 7). Selective deletion of MC4R in the paraventricular hypothalamus (paraventricular nucleus [PVN]) recapitulates the obesity phenotype observed in global MC4R knockout mice, while rescue of MC4R expression in the PVN significantly improves the obesity phenotype resulting from global MC4R deletion (10, 11). Furthermore, pharmacological stimulation of MC4R suppresses feeding, while inhibition of MC4R increases feeding in part by acting on MC4R-expressing neurons in the PVN (1213–14). Consistent with this, more recent optogenetic and chemogenetic approaches reveal that activation of PVN MC4R neurons robustly suppresses feeding, while inhibition or ablation of these neurons increases food intake or results in obesity (13, 15). Thus, PVN MC4R signaling acts as a proxy for energy state, with high receptor activity associated with reduced feeding and low receptor activity associated with increased feeding. Despite the critical role of PVN MC4R neurons for regulating feeding and body weight, the in vivo dynamics of these cells remain largely unknown.
Previous studies have utilized immunohistochemistry for the immediate early gene, c-Fos, to map the general activation patterns of PVN MC4R neurons in response to changes in energy state (15). However, these studies only provide information on general activation patterns for one specific time point and do not allow longitudinal tracking of neuronal activity over time. While a recent report utilized bulk fiber photometry recordings to map the activity of PVN MC4R neurons in response to acute refeeding (15), this approach does not allow single-cell resolution of individual cells across time. Conversely, in vivo electrophysiological studies allow neuronal dynamics to be determined over time with a high degree of spatial and temporal precision, but these approaches are limited in their ability to provide cell type-specific information (16). Recent advances in miniaturized microscopes and genetically encoded calcium indicators now enable the in vivo imaging of individual neurons in the living mouse (17). Since neuronal action potentials are associated with sharp increases in intracellular calcium, in vivo calcium imaging provides a useful proxy for changes in neuronal activity in genetically identified cell types (17). Despite the utility of this approach, the PVN MC4R neurons have not previously been analyzed using this technique. In this study, we utilize in vivo single-cell endomicroscopic calcium imaging to track the activity of individual PVN MC4R neurons across space and time in response to changes in energy state and pharmacological treatment.
Although PVN MC4R neurons are known to regulate feeding, the temporal dynamics of these cells in response to fasting and refeeding are unknown. To determine how changes in energy state affect the dynamics of these neurons in real time, we utilized in vivo endomicroscopy and genetically encoded calcium indicators to record changes in calcium over time in individual PVN MC4R neurons (Fig. 1 A–C and SI Appendix, Fig. S1). To accomplish this, we selectively expressed GCAMP6s (genetically encoded calcium sensor MP6s) in PVN MC4R neurons by targeting an AAV (adeno-associated virus) expressing GCAMP6s in a Cre-recombinase–dependent fashion to PVN in a previously validated MC4R-Cre mouse line (13) (Fig. 1 A–C). A gradient refractive index (GRIN) lens was positioned directly above PVN to enable optical access to PVN MC4R neurons, and a baseplate was attached directly to the surgically implanted GRIN lens for attachment of a miniaturized single-photon microscope (Inscopix nVoke) (Fig. 1 A–C). This approach enables single cell-resolution calcium imaging of PVN MC4R neurons during natural feeding behaviors and in response to metabolic challenges.

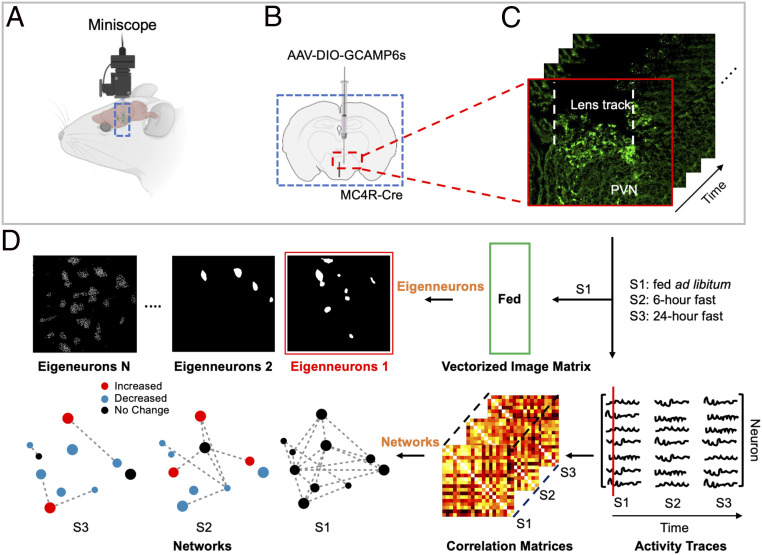
In vivo recording of PVN MC4R network activity. (A) Model showing miniature microscope used for in vivo imaging of PVN MC4R neurons. (B) Schematic of viral injection technique used to express the genetically encoded calcium indicator, GCAMP6s, in PVN MC4R neurons. (C) Representative imaging showing viral expression in PVN MC4R neurons and location of GRIN lens track. Red box highlights the first time point, corresponding to the first column of neuron activity in D. (D) Illustration of data preparation for eigenneurons analysis and network constructions derived from neuron activity through time, associated with fed ad libitum, 6-h fast, and 24-h fast. Red dots indicate increased fluorescence, blue dots indicate decreased fluorescence, and black dots indicate no change in fluorescence.
In addition to quantifying changes in calcium activity and events in PVN MC4R neurons, we examined the network dynamics between individual PVN MC4R neurons in response to metabolic and pharmacological manipulations. In Fig. 1D, we illustrate two approaches for analysis of network dynamics of PVN MC4R neuronal activity. In the first approach, we used singular value decomposition (18) to derive eigenneurons, which capture the dominant features of neuronal dynamics (Materials and Methods). In the second approach, we used the concept of network/graph to examine the interactions (correlations) between neuronal activities. We use these approaches to determine how changes in metabolic state and pharmacological manipulations affect neuronal activity and network dynamics of PVN MC4R neuronal ensembles.
Previous calcium imaging studies in agouti-related peptide (AgRP) and proopiomelanocortin (POMC) neurons have determined that AgRP neurons are acutely and transiently inhibited and POMC neurons are activated at the sight of food in fasted mice (1920–21). Since PVN MC4R neurons integrate inputs from both AgRP and POMC neurons, in addition to other cell types, we recorded the in vivo activity of PVN MC4R neurons in response to the sight of food and during the initiation of food consumption. Mice were fasted for 24 h, and changes in calcium dynamics were recorded during the presentation of food and the initiation of eating in freely moving animals (Fig. 2 A and B). In contrast to the rapid homogeneous responses of AgRP and POMC neurons to the introduction of food, we observed heterogeneous changes in fluorescence and calcium event rates in PVN MC4R neurons upon the introduction of a food pellet (Fig. 2 B–E). In total, approximately half of the recorded neurons were activated at the sight of food, while half were inhibited at the sight of food (Fig. 2F). However, upon food consumption we observed a decrease in fluorescence and calcium event rates relative to both baseline conditions and food introduction (Fig. 2 B–E). Nearly 73% of cells decreased in activity in response to eating, while 27% of cells increased activity in response to eating. To determine if PVN MC4R neurons are responsive to elapsed time and/or novelty detection, as opposed to food intake, we repeated the previous experiments in response to introduction of a wooden block (SI Appendix, Fig. S2). No change in fluorescence or calcium event rates was detected in PVN MC4R neurons in response to introduction of a noneatable wood pellet (SI Appendix, Fig. S2). Therefore, the majority of PVN MC4R neurons are acutely inhibited during eating, although significant heterogeneity exists in the response of PVN MC4R neurons to eating.
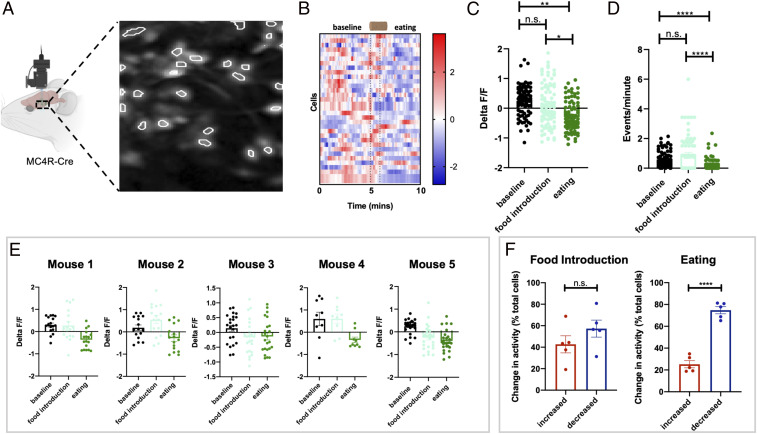
PVN MC4R neurons are transiently inhibited during eating. (A) Schematic of in vivo imaging of PVN MC4R neurons and representative field of view for PVN MC4R neurons. (B) Heat map showing changes in PVN MC4R neurons in a representative mouse during the presentation of food (first dotted line) and during the initiation of eating (second dotted line). (C) Change in fluorescence during the presentation of food and eating (n = 92 neurons from five mice). (D) Calcium event rates during the presentation of food and eating (n = 92 neurons from five mice). (E) Individual mouse data showing calcium response to the introduction of food and the initiation in four separate mice. (F) Percentage of cells that increased or decreased during the introduction of food (Left) and the initiation of eating (Right). Data in C and D are analyzed by Friedman test with Dunn’s post hoc test. Individual data points in B and C show individual cells from four separate mice. *P < 0.05; **P < 0.01; ****P < 0.001. n.s., not significant.
Based on the known role of PVN MC4R neurons in regulating feeding and body weight, we hypothesized that changes in metabolic state would alter the network dynamics and neuronal activity of MC4R neurons in the PVN. Consistent with the known role of PVN MC4R neurons in inhibiting food intake, we observed reduced calcium activity in PVN MC4R neurons following fasting (SI Appendix, Fig. S3). Approximately 75% of PVN MC4R neurons were inhibited in response to a 24-h fast, while 17% of cells were increased, and 8% of cells did not change activity in response to fasting (SI Appendix, Fig. S3C). We next further probed the dynamics of the PVN MC4R neuronal response to fasting by recording changes in fluorescence and calcium events in individual PVN MC4R neurons during the gradual transition from the fed ad libitum state to a 24-h fast (SI Appendix, Fig. S4A). In all experiments studying network dynamics (Figs. 3–6), animals were lightly anesthetized prior to recording to reduce vibration as needed to allow accurate alignment of neurons across time and treatment conditions. Consistent with the known constitutive activity of the MC4R (22), we observed dynamic changes in calcium signal in PVN MC4R neurons in ad libitum fed mice (Fig. 3 A–C). In response to an acute 6-h fast, we observed a decrease in calcium signal, indicating reduced activity of PVN MC4R neurons following an acute fast (Fig. 3 A and B). PVN MC4R neurons continued to show a reduction in fluorescence following 24 h of fasting, demonstrating that the net activity of these cells is gradually inhibited during increasing negative energy balance (Fig. 3 A and B), and this was reproducible from mouse to mouse (Fig. 3D). In contrast, we did not observe any change in fluorescence during repeated recordings in the absence of fasting, indicating that the observed effects are not due to repeated imaging or elapsed time (SI Appendix, Fig. S5). Next, we quantified calcium event rates during the transition from fed to fasted. Consistent with changes in fluorescence, fasting gradually reduced calcium events in PVN MC4R neurons with a significant reduction in event rate observed following 24 h of fasting (Fig. 3C).
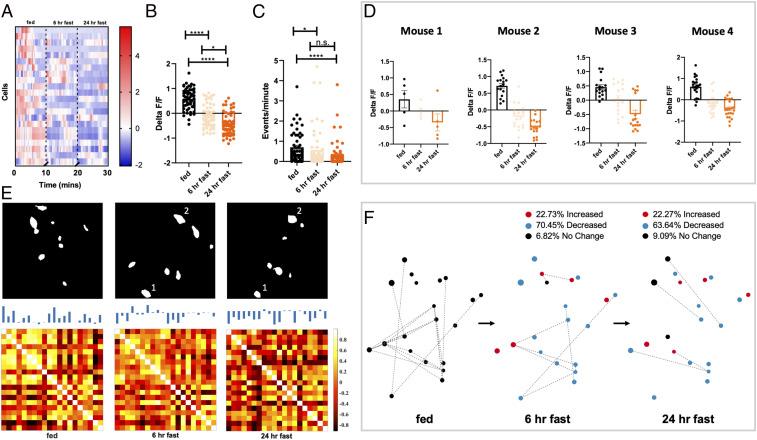
PVN MC4R neurons are gradually inhibited by fasting. (A) Heat plot showing representative change in fluorescence for an individual mouse during the transition from fed ad libitum to a 24-h fast (n = 21 neurons). (B) Average fluorescence signal in PVN MC4R neurons during fed ad libitum, 6-h fasted, and 24-h fasted conditions. Fasting gradually reduced fluorescence in GCAMP6s-expressing cells, indicating reduced neuronal activity (n = 61 cells from four mice). (C) Change in calcium events for PVN MC4R neurons during the transition from fed ad libitum to fasted for 24 h. Calcium events gradually decrease in PVN MC4R neurons during the transition from fed to fasted for 24 h (n = 56 cells from four mice). (D) Change in fluorescence for four separate mice during the transition from fed ad libitum to a 24-h fast. (E) Eigenneurons analysis (Upper) and correlation matrixes (Lower) for a representative mouse showing the most dominant features during each energy state (Upper) and the relative correlation between individual neurons in the three recording conditions (Lower). In the fed ad libitum state, most cells are positively correlated with each other. Following a 6-h fast, a mixture of positive and negative correlations is observed between cells, while following 24 h of fasting, the majority of cells are negatively correlated with each other. Absolute fluorescence for each cell is indicated at the top of each cell in the correlation matrix. The correlation matrices are statistically different by the Larntz–Perlman procedure at P value < 0.001. (F) Network diagram for a representative mouse depicting the spatial location of individual cells, the relative connectivity of each cell with other cells in the network, and the change in fluorescence for each neuron following fasting. Dots in F represent the spatial location of individual cells: red dots (increased fluorescence), blue dots (decreased fluorescence), and black dots (no change in fluorescence). Quantification of absolute change in fluorescence relative to previous state is shown numerically above the network diagrams. Dotted lines in F represent pairwise interactions for neurons (as quantified in SI Appendix, Fig. S3C). Data in B and C are analyzed by Friedman test with Dunn’s post hoc test. Individual data points in B and C show individual cells from four separate mice (as shown in D). *P < 0.05; ****P < 0.001. n.s., not significant.
PVN MC4R neurons are gradually activated by refeeding. (A) Heat plot showing representative change in fluorescence for an individual mouse during the transition from a 24-h fast to 6 h and then 24 h of refeeding. (B) Average fluorescence signal in PVN MC4R neurons during a 24-h fast, 6 h of refeeding, and 24 h of refeeding. Refeeding gradually increased fluorescence in GCAMP6s-expressing cells, indicating increased neuronal activity (n = 61 cells from four mice). (C) Change in calcium events for PVN MC4R neurons during the transition from a 24-h fast to 24 h of refeeding. Calcium events gradually increase in PVN MC4R neurons during the transition from a 24-h fast to 24 h of refeeding (n = 56 cells from four mice). (D) Change in fluorescence for four separate mice during the transition from a 24-h fast to 24 h of refeeding. (E) Eigenneurons analysis (Upper), and correlation matrices (Lower) for a representative mouse showing the most dominant features during each energy state (Upper) and the relative correlation between individual neurons in the three recording conditions (Lower). The correlation matrices are statistically different by the Larntz–Perlman procedure at P value < 0.001. (F) Network diagram for a representative mouse depicting the spatial location of individual cells, the relative connectivity of each cell with other cells in the network, and the change in fluorescence for each neuron following a 24-h fast, 6 h of refeeding, and 24 h of refeeding. Dots in F represent the spatial location of individual cells: red dots (increased fluorescence), blue dots (decreased fluorescence), and black dots (no change in fluorescence). Quantification of absolute change in fluorescence relative to previous state is quantified above the network diagrams. Dotted lines in F represent pairwise interactions for neurons (as quantified in SI Appendix, Fig. S5). Data in B and C are analyzed by Friedman test with Dunn’s post hoc test. Individual data points in B and C show individual cells from four separate mice (as shown in D). *P < 0.05; **P < 0.01; ***P < 0.005. n.s., not significant.
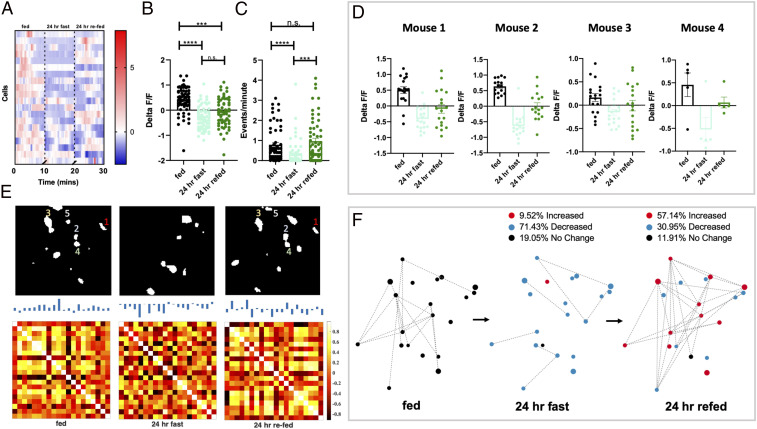
Energy-state engrams of PVN MC4R neurons. (A) Heat map showing change in fluorescence over time for individual PVN MC4R neurons from an individual mouse during fed ad libitum, following a 24-h fast, and following 24 h of refeeding. (B) Analysis of the average fluorescence of each recorded neuron during fed ad libitum, a 24-h fast, and 24 h of refeeding (n = 64 cells from five mice). (C) Change in calcium event rates for recorded neurons during fed ad libitum, a 24-h fast, and 24 h of refeeding (n = 59 cells from five mice). (D) Individual mouse data showing change in fluorescence for four separate mice during the fed ad libitum state, following a 24-h fast, and following 24 h of refeeding. (E, Upper) First eigenneurons of the PVN MC4R neuronal activity map during fed ad libitum, a 24-h fast, and 24 h of refeeding. Similar nodes are outlined in the fed and refed state. (E, Lower) Correlation matrix showing correlations among all recorded neurons in the network during the fed ad libitum, a 24-h fast, and following 24 h of refeeding. The correlation matrices are statistically different by the Larntz–Perlman procedure at P value < 0.001. (F) Network diagram for a representative mouse depicting the spatial location of individual cells, the relative connectivity of each cell with other cells in the network (quantified in SI Appendix, Fig. S6), and the change in fluorescence for each neuron relative to the previous energy state. Dots in F represent the spatial location of individual cells: red dots (increased fluorescence), blue dots (decreased fluorescence), and black dots (no change in fluorescence). Quantification of absolute change in fluorescence relative to previous state is quantified above the network diagrams. Data in B and C are analyzed by Friedman test with Dunn’s multiple comparison test. ***P < 0.005; ****P < 0.001. n.s., not significant.
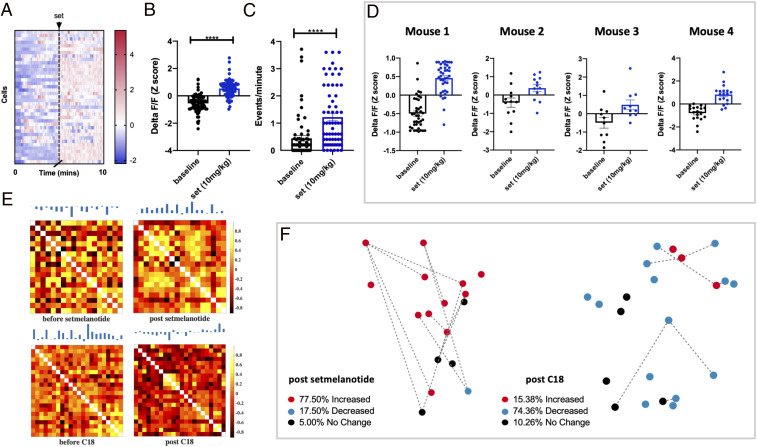
Pharmacological manipulation of melanocortin receptors bidirectionally regulates PVN MC4R activity. (A) Heat map showing change in fluorescence in individual PVN MC4R neurons for a representative mouse before and after setmelanotide treatment. (B) Average change in fluorescence in all recorded PVN MC4R neurons before and after setmelanotide treatment (n = 79 cells from four mice). (C) Number of calcium events before and after setmelanotide administration. Setmelanotide administration increased calcium event rate, relative to before injection (n = 79 cells from four mice). ****P < 0.001. (D) Change in fluorescence for four individual mice following setmelanotide administration. (E) Correlation matrices of the PVN MC4R neuronal activity following setmelanotide (Upper) or CT021 administration (Lower). Each pair of the correlation matrices is statistically different by the Larntz–Perlman procedure at P value < 0.001. (F) Network diagram for a representative mouse depicting the spatial location of individual cells, the relative connectivity of each cell with other cells in the network, and the change in fluorescence for each neuron relative to before compound administration. Dots in E represent the spatial location of individual cells: red dots (increased fluorescence), blue dots (decreased fluorescence), and black dots (no change in fluorescence relative to baseline). Quantification of absolute change in fluorescence relative to before compound administration is quantified above the network diagrams. Data in B and C are analyzed by Mann–Whitney test.
To further compare the dominant features of PVN MC4R neurons during the transition from fed to fasted, we utilized the technique of eigenneurons (similar to eigenfaces). Using this approach, we identified distinct dominant features associated with the fed ad libitum, 6-h fasted, and 24-h fasted conditions (Fig. 3 E, Upper). Further, the network features associated with a 6-h fast and a 24-h fast share more similarity with each other than with the fed ad libitum state, suggesting that similar energy states are more closely represented within PVN MC4R networks (Fig. 3 E, Upper). To further qualitatively describe how the connections between PVN MC4R neurons change in response to fasting, we next constructed correlation matrices for the different energy states (Fig. 3 E, Lower). Under the fed ad libitum state, most PVN MC4R neurons are positively correlated with the activity of other cells (Fig. 3 E, Lower). However, following a 6-h fast, a mixture of positive and negative correlations is observed between cells, indicating that fasting disrupts the coordinated activity among PVN MC4R neurons (Fig. 3 E, Lower). Following a 24-h fast, we observed a drastic change in correlation matrix dynamics, as the activity of most individual neurons was negatively correlated with the activity of other PVN MC4R neurons (Fig. 3 E, Upper). Thus, neuronal activity is suppressed in the majority of PVN MC4R neurons following 24 h of fasting.
To quantify the changes in network activity over time that we observed in the correlation matrices (Fig. 3 E, Lower) and to model these dynamics, we used the notions of von Neumann entropy and degree centrality (23, 24). Consistent with observed changes in fluorescence and calcium events, entropy of the network among cells (Materials and Methods has additional details) gradually decreased during the transition from fed ad libitum to a 24-h fast (SI Appendix, Fig. S4B). Network degree centrality analysis relies on identification of the most influential and interactive nodes in a network. Therefore, this analysis provides a useful visualization of the relative dominance of each neuronal node during different energy states. We find that the majority of neurons exhibit the highest level of connectivity with other neuronal nodes during the fed ad libitum state and low connectivity during the fasted state (SI Appendix, Fig. S4C). During the transition from fed ad libitum to a 6-h fast, 70% of PVN MC4R neurons were inhibited, 23% were increased, and 7% did not change their neuronal activity (Fig. 3F). During the transition from a 6-h fast to a 24-h fast, 64% of neurons decreased their activity, while 28% increased their activity, and 9% did not change their overall activity level (Fig. 3F).
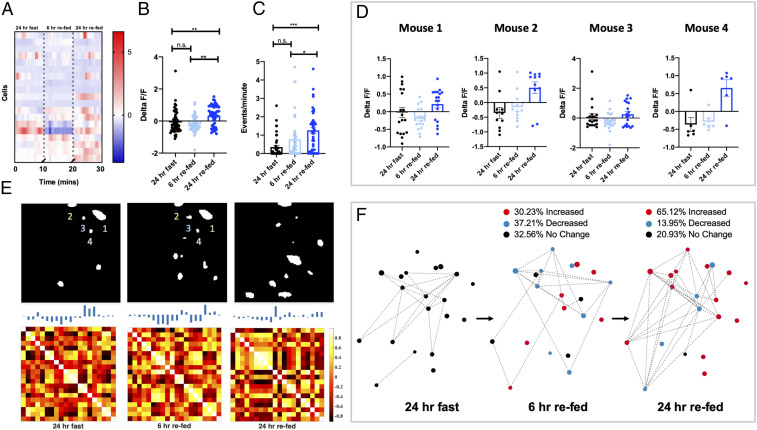
To further probe the functional dynamics of PVN MC4R neurons, we recorded changes in calcium activity of PVN MC4R neurons during the transition from the fasted state to the refed state (Fig. 4). PVN MC4R calcium signal was gradually increased during the transition from a 24-h fast to 24 h of refeeding (Fig. 4 A and B). Following 6 h of refeeding, we did not observe any change in calcium activity (Fig. 4 A and B). However, following 24 h of refeeding, we observed a statistically significant increase in fluorescence, indicating that PVN MC4R neuronal activity is gradually increased in response to refeeding (Fig. 4 A and B). Similar results were obtained in four separate mice (Fig. 4D), and no change in fluorescence was detected in time-matched, nonfasted animals (SI Appendix, Fig. S5). As previously described, we also calculated the calcium event rates of individual neurons during the transition from fasted to refed. Consistent with observed changes in fluorescence, calcium event rate gradually increased in PVN MC4R neurons during the transition from fasted to refed (Fig. 4C).
We next determined changes in the network dynamics of PVN MC4R neurons during the transition from fasted to 24-h refed, as previously described (Fig. 1). Correlation matrix and eigenneurons analysis revealed that individual PVN MC4R neurons display qualitative differences in network connections during these three conditions (Fig. 4E). To quantify these changes in network dynamics in response to refeeding, we analyzed network entropy for PVN MC4R neurons during the three different refeeding conditions (SI Appendix, Fig. S6A). In contrast to the results obtained during fasting (Fig. 3), in response to refeeding we observed an increase in entropy, indicating that average correlations and connections between individual PVN MC4R neurons increase during the course of refeeding (SI Appendix, Fig. S6A). Consistently, most neurons displayed the greatest amount of interactions with other nodes in the network during either the 6-h or 24-h refed state, while few connections were noted in the fasted state (SI Appendix, Fig. S6B). During the transition from fasted to 6 h of refeeding, approximately equal amounts of neurons were increased, were decreased, and did not change (Fig. 4F). However, during more prolonged refeeding (6-h refed to 24 h of refeeding), 65% of neurons increased their activity level, while 14% were decreased, and 21% did not change (Fig. 4F). Thus, although the majority of PVN MC4R neurons are activated by refeeding, significant heterogeneity exists in the response of these cells to refeeding. Moreover, the reactivation of PVN MC4R neurons occurs over a slower timescale than their inhibitory response to fasting (Fig. 3). Together, these findings demonstrate that PVN MC4R neurons are bidirectionally regulated by changes in energy state, with fasting suppressing neuronal activity and network dynamics of the majority of cells and refeeding increasing the neuronal activity and network dynamics of most PVN MC4R neurons.
We next sought to determine the change in neuronal activity of individual PVN MC4R neurons during the reversible transition from a 24-h fast to 24 h of refeeding. Consistent with our previous findings (Fig. 3), we find that a 24-h fast reduces the fluorescence of PVN MC4R neurons (Fig. 5 A and B and Movie S1). However, refeeding for 24 h did not increase this signal to prefasted levels (Fig. 5B). Similar results were obtained in four separate animals (Fig. 5D), and no difference in fluorescence was detected in time-lapse, nonfasted control animals (SI Appendix, Fig. S5). Consistent with changes in fluorescence, fasting reduced the calcium event rate of PVN MC4R neurons (Fig. 5C), and refeeding for 24 h restored the calcium event rate of PVN MC4R neurons to prefasted levels (Fig. 5C).
To further compare the dominant features of neurons at fed, fasted, and refed states, we again utilized the technique of eigenneurons. Using this approach, we identified multiple common network features associated with both the ad libitum fed condition and the 24-h refed condition (Fig. 5 E, Upper). In contrast, the dominant features observed following a 24-h fast were highly distinct from those observed during an energy-replete state (Fig. 5 E, Upper). We next quantified these changes in network activity over time. Fasting for 24 h significantly reduced network entropy, indicating that fasting reduces the average correlations and interactions between PVN MC4R neurons (SI Appendix, Fig. S7A). Interestingly, refeeding for 24 h significantly increased network entropy, relative to the 24-h fasted condition (SI Appendix, Fig. S7A). Therefore, although refeeding for 24 h does not completely restore the fluorescent signal in PVN MC4R neurons to prefasted levels (Fig. 5B), it does restore calcium event rates (Fig. 5C) and the network correlation structure of PVN MC4R neurons to levels observed in the fed state (SI Appendix, Fig. S7A). Further, during both the fed ad libitum state and the 24-h refed state, the majority of recorded neurons are positively correlated with the activity of the other neurons in the network, while the opposite is observed in response to fasting (Fig. 5 E and F and SI Appendix, Fig. S7B).
The enhanced neuronal activity and network activity of PVN MC4R neurons observed in the energy replete state suggests that pharmacological approaches which activate these neurons may have efficacy as weight loss therapeutics. Consistent with this notion, pharmacological stimulation of the MC4R has been pursued as a potential therapeutic strategy to suppress feeding and promote weight loss (4). For example, recent clinical trials with the MC4R agonist setmelanotide have been effective at reducing food intake and obesity in some forms of human syndromic obesity, such as leptin receptor deficiency, POMC deficiency, Bardet–Biedl syndrome, and Alstrom syndrome (252627–28). Previous preclinical research suggests that MC4R agonism suppresses feeding by acting in part on MC4R neurons in the PVN (10, 11, 13). However, how MC4R stimulation affects the activity and dynamics of PVN MC4R neurons remains unknown. Given the importance of setmelanotide as the first effective therapeutic for syndromic obesity, we next investigated how setmelanotide affects the in vivo activity of PVN MC4R neurons. Consistent with the anorexic effects of MC4R stimulation, administration of setmelanotide rapidly increased the fluorescent signal in PVN MC4R neurons (Fig. 6 A and B and Movie S2). Similar results were obtained in four separate animals (Fig. 6D). Setmelanotide treatment also significantly increased the calcium event rate of PVN MC4R neurons relative to baseline conditions (Fig. 6C). Correlation analysis demonstrated a high degree of correlated neuronal activity for all recorded neurons following setmelanotide administration (Fig. 6 E and F). Nearly 78% of PVN MC4R neurons showed an increase in fluorescence following setmelanotide treatment, while 18% were decreased, and 5% displayed no change following setmelanotide treatment (Fig. 6F). No significant change in fluorescence or event rates was observed following administration of saline (SI Appendix, Fig. S8 A–C). Furthermore, the core features of the neuronal activity trace were highly similar before and after saline injection, demonstrating that the observed changes in activity and population dynamics are unlikely to be due to the effects of injection or elapsed time (SI Appendix, Fig. S8D).
We previously demonstrated that pharmacological stimulation of melanocortin 3 receptor (MC3R) inhibits PVN MC4R neurons via the presynaptic release of the inhibitory neurotransmitter GABA (gamma aminobutyric acid) from AgRP neurons (29). Since MC3R agonists oppose the effects of MC4R stimulation, we next evaluated how stimulation of central MC3R changes the network activity of PVN MC4R neurons (Fig. 6 E and F). To selectively stimulate MC3R, we administered a previously characterized selective MC3R agonist (C18) (30) and recorded the neuronal dynamics of PVN MC4R neurons (Fig. 6 E and F). Consistent with our previous findings in a slice preparation, pharmacological stimulation of MC3R suppressed the neuronal activity of most PVN MC4R neurons in vivo (Fig. 6 E and F). In direct contrast with setmelanotide treatment, stimulation of MC3R decreased neuronal activity in 74% of PVN MC4R neurons and increased activity in 15% of neurons, and no change was observed in 10% of neurons (Fig. 6F). Correlation analysis revealed a strong negative correlation between the neuronal activity of individual PVN MC4R neurons following C18 treatment, indicating that very few neurons are active at the same time following C18 treatment (Fig. 6F).
PVN MC4R neurons integrate information from “first-order” neurons, such as the POMC neurons and AgRP neurons, located in the hypothalamic arcuate nucleus (313233–34). POMC neurons synthesize and release the melanocortin receptor agonist, alpha melanocyte-stimulating hormone (-MSH), which stimulates PVN MC4R neurons to suppress feeding (31, 33, 35). Conversely, AgRP neurons synthesize and release the endogenous melanocortin receptor antagonist, AgRP, in addition to GABA and neuropeptide Y (NPY), which inhibit PVN MC4R neurons to increase feeding (31, 34, 363738–39). Previous studies have demonstrated that POMC neurons are modestly activated by feeding, while AgRP neuronal activity is potently increased in response to fasting or negative energy balance (40414243–44). Our findings are consistent with this previous literature, as we demonstrate here that PVN MC4R neuronal activity is gradually suppressed during fasting and increased in response to refeeding. However, we observe differences in the kinetics of PVN MC4R neuronal responses that may reflect physiological differences between the transition to negative or positive energy balance. For example, while 6 h of food deprivation (Fig. 3 A–C) significantly reduces the neuronal activity of PVN MC4R neurons, 6 h of refeeding does not significantly increase the activity of these cells (Fig. 4 A–C). Instead, 24 h of refeeding is required to significantly increase PVN MC4R neuronal activity following fasting (Fig. 4 A–C). Interestingly, while activation of AgRP neurons rapidly evokes feeding (36, 45), stimulation of POMC neurons requires hours to days to exert anorexigenic effects on feeding (33). Thus, PVN MC4R neurons appear especially sensitive to negative perturbations in energy balance, while their kinetics exhibit a slower response to energy surfeit. We suggest a model in which increased AgRP neuronal activity during fasting leads to release of GABA, NPY, and AgRP from AgRP neurons and inhibition of PVN MC4R neurons over a time course of minutes to hours following food deprivation. In contrast, POMC neuronal activity is gradually increased in response to refeeding, leading to a gradual increase in α-MSH release and PVN MC4R neuronal activity that is observed over the course of hours to days. Although our findings are consistent with this hypothesis, dual recordings from POMC/AgRP neurons and PVN MC4R neurons and/or methods for visualizing melanocortin peptide release in vivo will be necessary to definitely prove this hypothesis and to better understand the kinetics of neuronal responses to alterations in energy balance.
Previous studies have utilized fiber photometry to determine how AgRP, POMC, and PVN MC4R neuronal activity changes during the acute transition from the fasted to the refed state (1920–21, 46). Surprisingly, in fasted mice, AgRP neurons are rapidly inhibited at the sight of food (before food consumption) (19, 46), while POMC neurons are rapidly activated at the sight of food (before food consumption) (19). These rapid sensory changes at the sight of food are transient and disappear if food consumption does not occur (1920–21). In contrast to AgRP and POMC neurons, a recent study demonstrated that PVN MC4R neurons are not rapidly modulated by the sight of food (15). In this study, we find that PVN MC4R neurons exhibit a diverse response to the sight of food as approximately half of the neurons were inhibited and half were activated during the introduction of food and prior to eating (Fig. 2 B–D). However, the majority of PVN MC4R neurons are inhibited upon eating, although this response was also heterogeneous as nearly 40% of neurons were activated during eating. We speculate that this transient inhibition of PVN MC4R neurons upon eating may serve to promote the consumption of food in hungry mice, as reduced activity in this anorexigenic cell type would be expected to promote feeding. Future work is required to precisely align PVN MC4R neuronal activity with the microstructure of feeding and to determine the effects of training on PVN MC4R neuronal responses during the introduction of food.
Based on the current findings, PVN MC4R neurons exhibit more heterogeneity in response to both fasting and refeeding than AgRP and POMC neurons. Therefore, we propose that PVN MC4R neurons likely integrate inputs from a variety of hypothalamic and extrahypothalamic sources. Consistent with this notion, we recently demonstrated that approximately 50% of the inhibitory inputs to PVN MC4R neurons emanate from the AgRP neurons (29). Identifying the sources of the additional inhibitory and excitatory inputs to PVN MC4R neurons and determining their function remain major areas of future research since PVN MC4R neurons clearly integrate information from neural circuitry extending beyond the AgRP/POMC neurons. We posit here that PVN MC4R neurons integrate neuronal information conveying deviance from homeostatic set point, such that gradual changes in energy set point regulate the activity of these neurons to produce counterregulatory changes in feeding and energy expenditure. For example, negative energy balance suppresses the constitutive activity of PVN MC4R neurons, leading to increased food intake and reduced energy expenditure. Conversely, excess caloric intake increases the activity of PVN MC4R neurons to suppress feeding and increase energy expenditure. Therefore, PVN MC4R neurons may provide a cellular basis for energy set point, a hypothesis previously postulated based on ex vivo studies (40, 47). Further work is necessary, however, to determine the direct relationship between changes in PVN MC4R neuronal activity and deviance from body weight set point since other parameters associated with fasting and refeeding may also regulate the activity of these neurons.
We also demonstrate here that similar networks of PVN MC4R neurons are engaged during an energy-replete state (Fig. 5E). Importantly, this effect is not solely due to elapsed time as no difference in neuronal activity was detected in time-matched, nonfasted mice (SI Appendix, Fig. S4). It has previously been shown that distinct neuronal “engrams” within both the hippocampus and amygdala encode sensory experiences by activating unique neuronal networks (4849–50). Here, we propose that energy state-sensitive neurons in the hypothalamus may also form neuronal engrams representing an energy-replete or depleted state (Fig. 4D). Further studies will be required to determine the physiological significance of distinct PVN MC4R neuronal engrams as these engrams may encode unique subsets of neurons marked by molecular and/or anatomical specialization, as suggested by a recent study (51).
The synthetic MC4R agonist setmelanotide has shown promise in effectively treating multiple forms of syndromic obesity, such as leptin receptor deficiency, POMC deficiency, Alstrom syndrome, and Bardet–Biedl syndrome (252627–28). However, the in vivo activity of setmelanotide on MC4R neurons is unknown. Here, we demonstrate that setmelanotide rapidly increases the neuronal activity of PVN MC4R neurons, providing a putative mechanism for the anorexic effects of setmelanotide in a clinical setting (Fig. 6). Importantly, despite the potent anorexigenic effect of PVN MC4R stimulation, MC4R agonists have largely failed for dietary obesity due to on-target pressor effects and/or inefficient induction of weight loss. Recently, the high-resolution crystal structure of the MC4R was elucidated (52). This structure combined with in vivo receptor activation assays, such as those provided here, may ultimately facilitate the development of more potent and effective MC4R compounds for use in the treatment of MC4R haploinsufficiency and common dietary obesity.
In summary, the neuronal activity and network dynamics of PVN MC4R neurons are gradually suppressed during fasting and increased in response to refeeding. Thus, the network dynamics of PVN MC4R neurons are bidirectionally regulated by changes in energy state, providing a putative cellular basis for encoding energy set point in the brain.
All experiments were previously approved by the University of Michigan Institutional Animal Care and Use Office. Experiments were performed on adult (8- to 14-wk-old) male MC4R-Cre mice. All mice were group housed with a 12-h light/12-h dark cycle and provided ad libitum access to food and water prior to stereotaxic surgeries and behavioral experiments. For in vivo imaging experiments, mice were single housed for at least 1 wk before starting imaging experiments. Only mice with correct lens placement directly above PVN and GCAMP6s expression in PVN were used for subsequent analysis. Data from individual cells were pooled for primary analysis (four to five mice for each experiment, 50 to 90 cells per experiment). Data from individual mice are shown in the figures and SI Appendix, Figs. S1–S8, and similar data were observed for all mice tested.
Adeno-associated viral vectors used in this study included AAV2-synapsin-flex-GCAMP6s. Viral vectors were purchased from Addgene.
For stereotaxic surgical procedures, mice were anesthetized with isoflorene and placed in a stereotaxic frame (Kopf). A microprecision drill was used to drill a small burr hole directly above the viral injection site in the PVN. Cre-dependent AAV viral vectors expressing GCAMP6s were injected into the PVN using a micromanipulator (Narishige) attached to a pulled glass pipette. MC4R-Cre mice were injected into PVN with 500 nL of virus, and virus was injected at a rate of 50 nL/min. Representative images of lens placement and viral expression are shown in SI Appendix, Fig. S1.
Following the completion of in vivo imaging experiments, mice were transcranially perfused with 1× PBS (phosphate buffered saline) followed by 10% formalin. The entire head (with GRIN lens attached) was fixed overnight in 10% formalin to assist in visualizing the placement of the GRIN lens. The next day, brains were removed and fixed overnight for an additional day in 10% formalin. Next, brains were switched to a 20% sucrose solution (in 1× PBS) until the brains sank in the solution (1 to 3 d), at which point 35-m-thick hypothalamic sections were obtained using a cryostat (Leica). Sections containing the PVN were mounted on slides and imaged on a confocal microscope (Nikon A1). Only mice displaying accurate lens placement in PVN and viral expression of GCAMP6s in PVN were included in this study (SI Appendix, Fig. S1). Each experiment was repeated on four to five mice, which contained multiple active cells in the PVN (8 to 30 cells per mouse). Examples of correct lens placement and viral injection and examples of incorrect lens placement and viral injection are shown in SI Appendix (SI Appendix, Fig. S1). The majority of animals were not used for analysis due to either inaccurate lens placement and/or viral injections (SI Appendix, Fig. S1). Approximately 15 to 20% of animals exhibited accurate lens placement and viral injection, and these mice were used for subsequent analysis.
Endomicroscopy experiments were performed on adult male MC4R-Cre mice (8 to 14 wk old). Viral injections of Cre-dependent AAV viral vectors expressing GCAMP6s were targeted to the PVN in MC4R-Cre mice, as previously described (53). In the same surgery, a GRIN lens (0.6 × 7 mm; Inscopix) was implanted 0.2 m above the viral injection site in PVN. The GRIN lens was secured to the skull using Metabond, and mice were single caged and returned to the general housing area for recovery from surgical procedures. Three to four weeks following virus injection and GRIN lens placement, baseplates were attached above the GRIN lens to enable mounting of a miniaturized single-photon microscope (Inscopix). The following week, animals were anesthetized under light anesthesia (1% flow rate), and changes in calcium signals were recorded using the nVoke miniature microscope (Inscopix).
Synthesis and in vitro characterization of C18 were previously described (30). C18 was administered via intraperitoneal injection (10 mg/kg, 200 L saline). Setmelanotide was purchased from MedChemExpress and was administered via intraperitoneal injection (10 mg/kg, 200 L saline). For pharmacological experiments, 5 to 7 min of baseline recording was performed. Mice were then administered saline, C18, or setmelanotide via intraperitoneal injection in a randomized order with at least 1 wk separating each treatment condition. Ten minutes following intraperitoneal injections, recordings were continued using the same settings and field of view (settings on Inscopix DAQ box: LED (light emitting diode) power: 0.8 to 1.2; frame rate: 10 Hz; gain: 4.5 to 5.0). Fluorescence was recorded for an additional 5 to 10 min. Changes in neuronal activity were calculated by comparing baseline events and fluorescent activity for each neuron before and after compound administration. To calculate changes in fluorescence, the entire calcium imaging video (baseline + postrecording) was used to calculate the mean fluorescence value (F) for each identified neuron (principal component analysis–independent component analysis [PCA-ICA] method for identifying individual neurons is described in the sections below). The change in fluorescence (delta F) over the average fluorescence (delta F/F) was then calculated using Inscopix Mosiac software for each cell at a 10-Hz sampling rate. Thus, the average delta F/F value for the entire video (before and after compound administration) equates to zero. For post hoc analysis of delta F/F values, traces from individual neurons were down sampled spatially by two, and raw delta F/F values were normalized to Z scores.
For physiological imaging experiments, individual 10-min recording sessions were performed under fed ad libitum conditions following a 6-h fast, following a 24-h fast, following 6 h of refeeding, and following 24 h of refeeding. Images were obtained using identical settings (LED gain: 4.8 to 5.2; 10-Hz frame rate; and LED power of 0.8 to 1.2) for each video. Images were acquired using a single-photon epifluorescence microscope (Inscopix nVoke miniaturized microscope). Images were acquired at 10 frames per second with 0.5 to 0.9 mW of LED power (475 nm) using nVoke HD acquisition software (Inscopix). All data were processed using Inscopix Mosaic Software. First, spatial down sampling of four was applied to all videos to reduce processing time. Subtraction for background was first performed via a spatial band-passing Gaussian filter. Each video was then corrected for any motion via Mosiac motion correction using the mean image of the entire video as a reference video. To calculate delta F/F values, the mean image of the entire video (i.e., fed, fasted, refed, etc.) was calculated, and the delta F/F was computed in reference to the mean F for the entire video. Thus, for the panels shown in Figs. 2–4, the average value for each cell across the three conditions equates to zero. Individual cells were then identified using PCA-ICA of the DF/F videos. Following PCA-ICA analysis, all cells were visually inspected in single-cell mode using the Mosiac software. Cells containing multiple components were excluded from analysis. Individual cell traces for all cells in each mouse were exported and analyzed in Excel and/or MATLAB. Raw fluorescent traces were converted to Z scores for each neuron for all analyzed treatments/trials. Briefly, the average fluorescent value was calculated for each neuron across the entire video. Z scores were calculated at each time point during the video by subtracting from the mean value for the entire video for each cell and dividing by the SD of the fluorescent signal for the video. For all imaging experiments, potential bleaching effects were checked by measuring the fluorescent signal across the entire experiment in a region of the lens devoid of cells. Any videos that displayed a decrease of greater than 5% during the recording were excluded due to potential bleaching effects.
Event rates were calculated using Inscopix Mosiac software’s event detection. An event threshold factor of 2.0 and the smallest decay time of 0.5 s were used. The mathematics and methods associated with event detection are further outlined in the Inscopix data processing user guide version 1.3. Briefly, events are visualized as a fast increase in signal followed by a slow decrease down to baseline signal. Amplitude of baseline signal was calculated for each trace from each cell using the median absolute deviation, a measure of statistical dispersion.
Following GRIN Lens implantation surgery, mice were habituated to attachment of the miniature microscope for 15 to 20 min for 3 to 5 d (Fig. 2). For 2 to 3 wk prior to experiments, mice were provided ad libitum access to regular chow mouse food (5LOD mouse chow; Laboratory Diet) placed in a ceramic bowl in the corner of the mouse’s home cage. For imaging experiments, mice were fasted for 24 h (4 PM to 4 PM) and placed into a fresh, clean mouse cage at the onset of fasting. Although mice were familiar with the food source used for studies, no prior training was performed prior to testing. Following a 24-h fast, the miniature microscope was attached to the mouse, and the mouse was allowed to freely move around the cage for 3 to 5 min prior to the initiation of recordings. Following a baseline recording period of 5 to 7 min, either a regular chow food pellet (one pellet, 3 to 5 g) or a wooden block of approximately the same size as the food pellet was placed in the middle of the cage. The time between the introduction of food and the initiation of eating varied slightly for each mouse (between 1 and 2 min for each mouse). Following the initiation of eating, changes in calcium activity were recorded for an additional 3 to 5 min.
Animals with no viral expression, no or insufficient expression in the PVN, and inaccurate GRIN lens placement were excluded from analysis. Specific statistical analysis is outlined in the figures. Data that were normally distributed were analyzed using parametric approaches, while data that were not normally distributed were analyzed using nonparametric approaches. All data were analyzed with GraphPad software and MATLAB R2020a.
Calcium imaging videos were preprocessed as described above. Briefly, videos were down sampled spatially by four, and background signal and out of focus light were subtracted via a spatial band-passing Gaussian filter. Each video was then corrected for motion via Mosiac motion correction, using the mean image of the entire video as a reference. Eigenneurons analysis was then performed on the raw fluorescent signal recorded from the GRIN lens. The essence of eigenneurons is to best recover the original training image by using the smaller set of basis images (54). Eigenneurons can be found via singular value decomposition (18, 55). Given a data matrix X concatenated by vectorized frames, data are centered by subtracting the mean from each column, denoted as . Computing the matrix singular value decomposition of returns
The correlation between each identified neuron was calculated from the processed traces of the delta F/F values for each neuron. Values of zero indicate a random association between neurons or no correlated activity. High values indicate a high degree of correlation between neurons, while low values indicate that the neuronal activity of the two neurons is negatively correlated (i.e., one neuron is typically active, while the other neuron is inactive). The average fluorescence value for each cell (normalized to the entire video, delta F/F) is indicated as an individual line above each column in the correlation matrix. The correlation matrix construction plays a significant role in analyzing neuron activity fluctuations by exploiting network entropy.
The Larntz–Perlman procedure is a statistical test that compares difference between correlation matrices (56, 57). Suppose that are the sample correlation matrices of neuron activity with corresponding population correlation matrices for . The null hypothesis is . First, compute the Fisher z-transformation by
Network diagrams (Figs. 3–6) were constructed from the actual spatial location of the identified neurons. Spatial coordinates for each trace were obtained using Inscopix Mosiac software. Spatial locations of the individual neurons were determined following the previously outlined preprocessing steps and PCA-ICA analysis. In the network diagram, dotted lines represent edges of connections between neurons, identified from their correlations. If the absolute value of a correlation is greater than a prescribed threshold, we consider there is a connection between two neurons. For the physiological comparisons (Figs. 3–5), an edge was constructed for neurons that exhibited a correlation threshold greater than 0.70. For the pharmacological experiments (Fig. 6), an edge was constructed for neurons that exhibited a correlation threshold greater than 0.60. Color in the diagrams indicates the change in the delta F/F signal of each neuron relative to baseline conditions (shown in black for each network diagram). Network diagrams for the pharmacological assays (Fig. 6) were constructed similarly with a few differences. For these diagrams, the change in neuronal activity and network connections is depicted for each neuron relative to baseline, preinjection conditions.
The von Neumann entropy of a network, introduced by Braunstein et al. (23), is a spectral measure used in structural pattern recognition. The intuition behind this measure is linking the graph Laplacian to density matrices from quantum mechanics and measuring the complexity of the networks in terms of the von Neumman entropy of the corresponding density matrices (58, 59). In addition, the measure can be viewed as the information theoretic Shannon entropy: that is,
Centrality relies on identification of “central” or “most influential” nodes of a network. There are many network centrality measures. Of particular interest in this paper is the degree centrality, which can be obtained from counting the total number of edges of each node. In our case, it can provide useful visualization of the relative dominance of each neuronal node during different energy states.
We thank all members of the laboratory of R.D.C. for comments on early versions of this manuscript. This work is supported by NIH Grants F32HD095620 (to P.S.), K99DK12706501 (to P.S.), R01DK070332, and RO1DK126715 (to R.D.C.) and in part under Air Force Office of Scientific Research Award FA9550-18-1-0028 (to I.R.). Courage Therapeutics played no role in this study, and there are no financial implications for the company.
MATLAB and other raw data have been deposited in Open Science Framework, https://osf.io/2zpsg/ (61).
1
2
3
4
5
6
7
8
9
10
11
12
13
14
15
16
17
18
19
20
22
23
24
25
26
27
28
29
30
31
32
33
34
35
36
37
39
40
41
42
43
44
45
46
47
48
49
50
51
52
53
54
55
56
57
58
59
60
61
 Network dynamics of hypothalamic feeding neurons
 Facebook
 Twitter
 Linkedin
 Whatsapp

