
Edited by Nils Chr. Stenseth, University of Oslo, Oslo, Norway, and approved December 16, 2020 (received for review March 19, 2020)
Author contributions: Y.V. and L.D. designed research; Y.V., T.A.K., D.O., C.S., N.K., R.M.M., G.S., and L.D. performed research; Y.V., T.A.K., D.O., and C.S. devised models; G.S. contributed data; Y.V., T.A.K., D.O., C.S., A.F.E., N.K., R.M.M., and L.D. analyzed data; and Y.V., T.A.K., D.O., A.F.E., E.B.-P., and L.D. wrote the paper.
1Y.V., T.K., and D.O. contributed equally to this work.
Infectious disease control critically depends on surveillance and predictive modeling of outbreaks. We argue that routine mobile-phone use can provide a source of infectious disease information via the measurements of behavioral changes in call-detail records (CDRs) collected for billing. In anonymous CDR metadata linked with individual health information from the A(H1N1)pdm09 outbreak in Iceland, we observe that people moved significantly less and placed fewer, but longer, calls in the few days around diagnosis than normal. These results suggest that disease-transmission models should explicitly consider behavior changes during outbreaks and advance mobile-phone traces as a potential universal data source for such efforts.
Epidemic preparedness depends on our ability to predict the trajectory of an epidemic and the human behavior that drives spread in the event of an outbreak. Changes to behavior during an outbreak limit the reliability of syndromic surveillance using large-scale data sources, such as online social media or search behavior, which could otherwise supplement healthcare-based outbreak-prediction methods. Here, we measure behavior change reflected in mobile-phone call-detail records (CDRs), a source of passively collected real-time behavioral information, using an anonymously linked dataset of cell-phone users and their date of influenza-like illness diagnosis during the 2009 H1N1v pandemic. We demonstrate that mobile-phone use during illness differs measurably from routine behavior: Diagnosed individuals exhibit less movement than normal (1.1 to 1.4 fewer unique tower locations; P<3.2×10⁻³
Infectious disease outbreaks remain a major threat to humanity in the 21st century, as evidenced by the ongoing pandemic of COVID-19 (1) and 5 of 10 threats to global health identified by the World Health Organization being related to infectious disease (2). Estimating the current and future burden of disease through surveillance and predictive modeling is essential for appropriate allocation of resources aimed at reducing impact, especially in the early stages of an outbreak.
Traditional influenza healthcare-based surveillance methods rely on data gathered from symptomatic individuals seeking medical treatment from doctors. These approaches suffer from delays in reporting that differ from setting to setting and difficulty in identifying unusual activity (3). Such issues led to the development of alternative syndromic surveillance methods (4) that combine a broad range of data sources on behavioral markers; some were developed, used, and assessed during the H1N1v pandemic (5). These surveillance methods include analyzing patterns in social media such as Twitter (6, 7), search-engine queries (89–10), over-the-counter medication sales (11), airport traffic patterns (12), city traffic patterns (13), cell-phone surveys (14), or ensemble methods that incorporate survey data (15). Directly inferring disease incidence from these sources also assumes that the cause of behavior change is known and usually associated with influenza. Yet, studies indicate that individuals alter behavior for various reasons, even when not symptomatic, e.g., to avoid infection (16) or due to anxiety (17), complicating estimation of infectious disease burden (18).
Whereas data sources that depend on active, conscious user participation may produce unreliable estimates (14, 20), call-detail records (CDRs) can act as a passive pattern sensor (21). Mobile networks pervade most nations: In raw numbers, 2019 cell-phone subscriptions in developed and developing countries exceeded 100% of their populations (22), although mobile use invariably skews away from underresourced groups (23). CDRs, collected in real-time, contain spatiotemporal information that captures mobility. Past analyses have used cell-phone data to study human-movement scaling (13), social-network structure inference (24), poverty and wealth prediction (25), and risk and spread of multiple diseases, including malaria (26, 27), cholera (28), and influenza (29). Furthermore, smartphone apps have been used to track behavior change in relation to influenza onset (30) or as contact trackers during the COVID-19 pandemic (31, 32). These methods are all limited by either unreliable health data (self-diagnosed symptoms), aggregate-level data to model the population (33), or fraught with privacy concerns (34). Until now, the link with verified health data at the individual level has been missing.
Here, we explicitly combine CDRs with information from the 2009 H1N1v pandemic collected by the national healthcare-based surveillance system used by all health providers in Iceland through a protocol that maintains reasonable expectations of individual privacy from government surveillance. The influenza pandemic reached Iceland in May 2009 (19), with a shallow peak before the school holidays in May/June 2009, followed by a dip over the summer and a strong peak in October 2009 (Fig. 1). The outbreak started in the capital of Reykjavík, home to 37% of the population of 318,499, approximately 1 wk ahead of the rest of the country (19). Health officials recorded the date of diagnosis (DoD) of 10,175 clinically diagnosed cases of influenza-like illness (ILI) around the country between June 4, 2009, and February 11, 2010. Of 3,011 samples taken, 700 were confirmed by a real-time (PCR) protocol to be H1N1v influenza infections (19); we assume that other patients diagnosed with ILI were infected with the same strain, which displaced other strains until February 2010 (35).

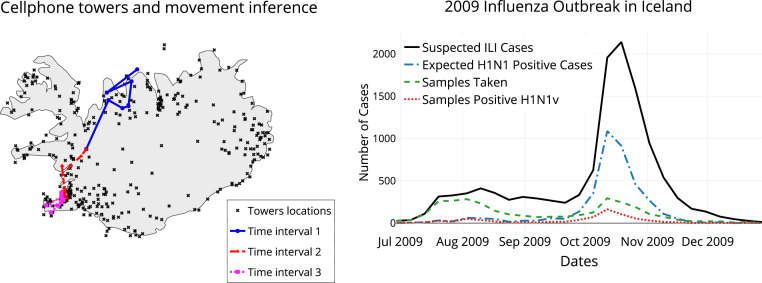
Combining health records with call-data records. (Left) Cell towers act as a proxy for location, which, when coupled with the timestamp, allow movement inference. Different colors show inferred movements of a typical cell-phone user at different time periods over a period of 3 d. (Right) The epidemic curve for the 2009 H1N1v outbreak in Iceland, showing a single pronounced peak. The green dotted line shows the number of laboratory samples taken, the red line shows the number of those testing positive for H1N1v, and the black line shows the estimate of suspected H1N1v cases per week from the recorded ILI incidence (19). The expected H1N1v positive cases (blue dotted line) are extrapolated from the suspected ILI cases and the percentage of samples found positive each week.
We analyzed behavioral patterns in Iceland extracted from the CDRs, provided in a deidentified format by a major mobile-network operator (MNO). The CDR logs span a broad time period around the 2009 outbreak. Mobile-phone owners were anonymously matched to records of ILI diagnosis, yielding DoD and CDR traces for 1,434 diagnosed individuals after data processing. We measured and identified behavioral traits that showed significant changes in the diagnosed group around the DoD compared to a control group.
The original dataset joins individual CDRs that MNOs routinely gather for billing purposes with individual-level ILI diagnosis data from Iceland’s Centre for Health Security and Communicable Disease Control (CHS-CDC), which collects and stores all records of ILI diagnoses in Iceland. We developed and used a privacy-preserving data hand-off and merging protocol approved by Iceland’s Bioethics Committee (Vísindasi anefnd): A large MNO sent encrypted phone identifiers (IDs) and national ID numbers (NINs, which are public information in Iceland) to the CHS-CDC. The CHS-CDC supplied dates of ILI diagnoses for NINs and then replaced NINs with an anonymous encrypted identifier before providing the data to us (SI Appendix, Data Linking and Privacy). The MNO provided us with CDR data (SI Appendix, Mobile Network Data) containing the encrypted IDs of the phones on either side of a call, the timestamp, the length of the call (in seconds), and the geographical coordinates of the cell-phone towers that interacted with the phones (SI Appendix, Table S1). No demographic or private data, such as age, gender, or contents of calls or texts, were included. The cell tower accessed during normal phone use provides a proxy for the device’s location. The granularity of location varies with locality—regional tower density increases proportionally with regional population (Fig. 1). At the time, MNOs provided cell coverage for virtually all residences in Iceland, either directly through their network or through a roaming service. We filtered out individuals with multiple subscriptions (SI Appendix, Data Preprocessing). Using phone-ownership information, each phone was matched to the DoD of its owner for the subset of users that pay only for one phone. This postprocessed subset, referred to as the dataset below, accounted for 25 to 30% of the MNO’s users and encompassed all data analyzed in our paper. We defined the home tower of each individual as the tower that picks up more calls and texts between midnight and 8 a.m. than other towers. The distribution of home-tower locations was strongly correlated with residential census counts for the corresponding postal codes for our dataset (, ) and among those with ILI diagnosis (, ). The home towers were thus spatially representative for the entire Icelandic population. We focused our analysis on the 1,434 diagnosed users who generated sufficient CDR data to establish a home-tower location in the 4-wk period centered on their DoD.
To characterize user behavior, we extracted 36 features (independent variables) from both incoming and outgoing CDR data encompassing movement, activity, and social-network behavioral patterns (SI Appendix, Feature Extraction). Most features exhibited a right-skewed distribution (SI Appendix, Fig. S2) and shared general characteristics across control and diagnosis groups. They include the following (boldface in Table 1).

| Control | Diagnosed | ||
| Feature | Mean | Mean | Anomalous days |
| Number of towers visited | 3.04 | 2.74 | −12, −2, −1, 0, 1, 2, 3, 4 |
| Number of new locations visited | 0.5 | 0.43 | 1, 3 |
| Unique contact count | |||
| Incoming | 2.25 | 2.02 | |
| Outgoing | 2.50 | 2.28 | 1, 2, 3, 6 |
| Both | 4.04 | 3.67 | 2 |
| New contacts | |||
| Incoming | 0.61 | 0.50 | |
| Outgoing | 0.65 | 0.55 | 1, 3, 6 |
| Both | 1.19 | 1 | 0, 1, 3 |
| Call duration, total, s | |||
| Incoming | 190 | 480.51 | 0, 1, 2 |
| Outgoing | 162 | 435.09 | 0 |
| Both | 479.5 | 915.60 | |
| Calls count | |||
| Incoming | 3.10 | 2.84 | |
| Outgoing | 3.60 | 3.37 | 1, 2 |
| Both | 6.66 | 6.22 | 1 |
| Texts count | |||
| Incoming | 2.71 | 2.87 | −10 |
| Outgoing | 1.74 | 1.93 | 1, 2 |
| Both | 4.46 | 4.79 | −10, 11 |
| Calls and texts count | |||
| Incoming | 5.78 | 5.71 | |
| Outgoing | 5.34 | 5.30 | 1, 2 |
| Both | 11.12 | 11.01 | 2 |
| Mean call duration | |||
| Incoming | 133.35 | 140.74 | −1, 0, 1, 2, 4, 11 |
| Outgoing | 107.96 | 106.74 | |
| Both | 143.14 | 149.84 | −8, −1, 0, 1, 2, 3, 4, 11, 13, 14 |
| Top 3 contacts by duration | |||
| (SI Appendix, Sensitivity Analysis) | |||
| Incoming | 0.68 | 0.69 | |
| Outgoing | 0.70 | 0.69 | |
| Both | 1.37 | 1.38 | 1 |
| Remaining contacts by duration | |||
| Incoming | 1.57 | 1.33 | |
| Outgoing | 1.80 | 1.58 | 1, 2, 4, 6 |
| Both | 3.37 | 2.92 | 1, 4, 6 |
| Top 3 contacts by frequency | |||
| Incoming | 0.58 | 0.56 | |
| Outgoing | 0.63 | 0.61 | 1, 2 |
| Both | 1.21 | 1.17 | 1 |
| Remaining contacts by frequency | |||
| Incoming | 1.67 | 1.46 | 0 |
| Outgoing | 1.88 | 1.67 | −9, 2, 6 |
| Both | 3.54 | 3.13 | |
Number of towers visited measures the number of unique tower coordinates connected to by the cell phone within a time interval (bin). This feature helps describe movement during the time period, but can inflate in areas where multiple towers can provide cellular signal.
Mean call duration (incoming and outgoing) measures call activity by dividing the total duration of calls by the number of calls the user placed or received in the time interval.
Number of calls (outgoing) measures the number of calls placed by the device in the time interval.
We use to denote the raw feature value for a feature , extracted from the CDR by function , for individual , and on day . Extraction is performed for all features in Table 1.
To control for the weekly behavioral routine of individual , each feature value is detrended through linear regression over values of the same weekday in the past weeks. Specifically, let
We used weeks of past data to correct for seasonality in our experiments, which gave comparable results to an alternative approach to detrending based on ranking features and normalizing them (SI Appendix, Seasonality).
Based on the data, we used a linear model to capture the change in values over time with errors for each ; we fit parameter values for and to minimize the squares regression error
Each diagnosed individual was matched with a control individual from the undiagnosed group, based on home location. All measurements thus far have applied to individuals diagnosed with ILI during the epidemic. To compare the diagnosed population against a control population, a subset was selected from the rest of the data—those not diagnosed for ILI were assumed to be uninfected, though they may show behavior consistent with symptoms but are well, or have ILI symptoms but did not use health services. Of 74,644 people, we were able to identify home towers for 36,140. Each diagnosed person’s control was selected randomly from the undiagnosed individuals among the 36,140 who shared a home tower with the diagnosed individual. For this dataset, control selection exhibited no noticeable differences across three methods: selecting randomly, matching for home tower, or matching home tower and frequency of calls (36).
We analyzed the pattern differences between the means of the detrended feature values () of the individuals in the two groups. The 29-d range (2 wk either side of DoD) centered around every diagnosed individual’s DoD range , with DoD mapping to zero. Controls used the same days of data as their diagnosed match. The average deviation from weekly routine on all days in the range was compared (SI Appendix, Fig. S9) with original feature values (), shown in SI Appendix, Figs. S2, S3, and S8.
We compared the behavior of the diagnosed and control groups across each detrended feature value and each day using the Kolmogorov–Smirnov (KS) statistic. To counteract the increase in type I errors caused by running multiple significance tests, we used the Benjamini–Hochberg (BH) procedure to control the false discovery rate (FDR), as it presents the most conservative FDR correction for this mix; the adjusted P values can then be used to assess the evidence for or against the null hypothesis. The BH procedure assumes independent tests. Some tests act on dependent, interacting samples—e.g., a value on a specific day is ranked against values from the same day of the week for several weeks prior—whereas others are independent tests. Confidence bands for the KS test were computed and plotted for each day of the primary three features deemed significant based on the P values with the FDR correction (SI Appendix, Fig. S9). The significance test and the CI calculations use .
Several features show significant change between the routine behavior of the control and diagnosed populations around their DoD. The actual time period and magnitude of the behavioral change varies by feature (Table 1, rightmost column), but the number of towers visited, mean call duration, and the number of outgoing calls show the most pronounced signals of behavior change.
The number-of-towers feature indicates that the diagnosed group tends to travel less than usual, even before diagnosis. Such lower travel patterns coincide with the typical symptomatic period of influenza (37). The maximum effect is observed on the day following diagnosis, when diagnosed individuals travel to 1.1 to 1.4 fewer locations than normal. Differences are observed between the diagnosed and control groups from 2 d prior to the DoD until 4 d after DoD (, ; Fig. 2 and SI Appendix, Fig. S10). Other days in the 4-wk period display the diagnosed and control groups acting similarly.
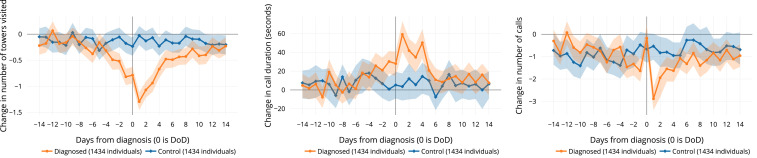
Changes in average phone-use behavior associated with diagnosis. (Left) Users visit fewer locations on days around diagnosis. (Center) They make and receive longer phone calls on days near diagnosis. (Right) They initiate fewer calls on the days after diagnosis, with the exception of the day of diagnosis itself. Graphs display the mean deviation from “normal” routine behavior () for each group on the relative day of illness determined by DoD (day 0). CIs (2.5 to 97.5%) are calculated using bootstrapping (SI Appendix, Visualization).
Mean call duration shows that people tend to make longer calls on average on the day after the DoD (Fig. 2), when significant differences are observed between the diagnosed and control groups (, ; SI Appendix, Fig. S22). On the day following diagnosis, diagnosed individuals spend an average of 41 to 66 s longer on the phone than usual.
Number of outgoing calls gives another perspective of behavior following diagnosis. Although call duration increases around DoD, the number of outgoing calls decreases on the day after the DoD, with an average of 2.3 to 3.3 fewer calls than is routine (, ; SI Appendix, Fig. S18). On the day of diagnosis, diagnosed individuals increase outgoing calls relative to their routine compared to the days before and after.
Statistical significance through FDR-corrected P values is supported by KS CIs for nearly all comparisons (Fig. 2 and SI Appendix, Fig. S9). Notably, the diagnosed group displays significant changes in mobility, even prior to seeking healthcare and receiving a diagnosis (SI Appendix, Visualization).
The results depend on the metadata arising from mobile-phone use, presenting both advantages and drawbacks (21, 33). The increased data bandwidth provided by MNOs and rapid device and app development over the past decade have altered user behavior patterns to communicate more via internet-based applications and less via calls and text. In our dataset, cellular internet data access (denoted general packet radio service [GPRS]) provided additional location information to CDR records of calls and texts, a situation that has likely shifted since the H1N1 outbreak (SI Appendix, Comparing CDR and GPRS Data). At 3 y following the epidemic, the Icelandic CDR and GPRS data contained a stronger location proxy than in 2009 due to more smartphone apps periodically connecting to cellular towers for Internet access, but poorer information for features pertaining to call duration, frequency, and top contacts.
Since many nations experience limited Internet access [53.6% of the world population in 2019 (22)] and smartphone availability [39.4% worldwide (38)], it would be reasonable to assume that call and text usage in these locations may follow similar patterns as in our dataset, but we caution against assuming all cell-phone behavior to be universal (33). Further, mobile-phone ownership may bias against those in greatest need of public health intervention. The results report aggregate behavior changes, which are likely to include patterns caused by other illnesses or injuries. Our approach depends on maintaining individual-level behavioral histories, since the signal we identified concerns departure from routine behavior rather than the actual behavior itself, as seen by comparing the raw and detrended distributions 6 d prior to diagnosis (SI Appendix, Fig. S2) with the day following the DoD (SI Appendix, Fig. S3). Finally, Iceland contains a small, mostly homogeneous, and generally affluent population bound to an island, with idiosyncratic behavior, including unusually high mobile-phone usage. Seasonal effects may be exaggerated in Icelanders compared to other populations due to Iceland’s proximity to the Arctic.
The combination of mobile-phone traces with health records reveals behavior change associated with symptom onset for H1N1v in unprecedented detail. Observations of behavior in CDRs are consistent with our knowledge of influenza pathology: Individuals become infected and begin showing symptoms, which their behavior reflects; they then access healthcare, receive a diagnosis, and display activity patterns different from normal for a period, after which they return to normality. This picture depicts a group trend; however, in an effort to avoid ecological inference fallacy (39), we observe that individuals’ changed behavior varied widely within a group. The variability of individuals’ behavioral responses suggests that CDR data are best suited for aggregate analysis of symptomatic behavior.
Although we cannot know the exact cause in each individual case, collectively, the duration of anomalies is consistent with estimates of influenza symptom duration (40). The use case in Iceland demonstrates that disease-monitoring systems could be expanded with CDRs, already passively collected by local mobile operators, that can discern behavior consistent with ILI symptoms while following a protocol to preserve user privacy, and our approach provides a complementary way of estimating the duration of symptoms and, therefore, an important component for estimating the economic impact of an outbreak.
The results presented here have important implications for modeling disease dynamics. As individuals change behavior due to symptom onset, their potential to transmit is modified, yet modeling efforts that have been central to mitigation measures for novel pathogens tend to ignore behavioral effects, due largely to a dearth of quantitative information. Such limitation is evident in the case of modeling of SARS-CoV-2 transmission—for instance, where different groups vary in their ability to alter their behavior in response to exposure or illness (31, 41). Here, we quantify the direction and magnitude of the behavioral change effect for H1N1v on an atypical population that exhibits fewer sources of variability than most. Other pathogens and populations will have different properties that will require a context-specific investigation. Our work provides a methodology for capturing and quantifying behavior change that can be used to improve the predictive power of models in future outbreaks. We argue that such an approach would have an important part to play in outbreak response for novel pathogens.
A separation of access to private data is vital for ensuring public trust. While aggregation helps protect privacy (31), enabling health officials to interact with the data increases the risk to individual or group privacy. Concerns have been raised over government responses to COVID-19, where contacts of those infected are traced from historical CDR data (34). Our data-sharing protocol (Fig. 3 and SI Appendix, Privacy-Preserving Data Sharing) mitigates risk by ensuring that: 1) Mobile operators that hold cell-phone metadata do not have access to any new health information for their customers held by health officials; and 2) health officials do not access cell-phone metadata. To further strengthen the separation, differential privacy methods can be used to introduce controlled noise to the data in such a manner that aggregate statistics remain unchanged, while provably protecting the privacy of individuals and small groups (42, 43). At the same time, communicating the collective benefit of studies such as this one, and the effort taken to protect data, is necessary to help the public decide when the public health value of the information provided is worth the risk to their privacy.
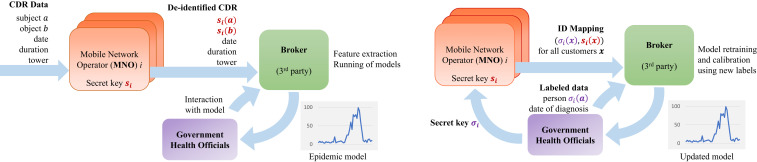
Privacy-preserving data-sharing protocol. Privacy-preserving architecture for syndromic surveillance using CDR data for future experimental design. An independent third-party broker is provided with real-time deidentified CDR data, extracts features, and runs the prediction models to generate an epidemic curve (Left; O1). The broker could also be provided labeled anonymous health information to join with the CDR data to calibrate or retrain the classifiers (Right; O2). The design accommodates mutual distrust, ensuring that health officials cannot monitor behavior or track mobility of individuals, that MNOs are not provided with any health information of customers, and that the broker only operates on deidentified data.
Our results suggest that CDR metadata may allow surveillance of symptomatic diseases whose symptom intervals are sufficiently long and behavioral changes sufficiently pronounced that they produce a signal that is visible at the resolution afforded by the data. The granularity of these data is rapidly refining, both spatially, with denser tower infrastructure being built in response to population growth and newer generations of devices (e.g., 5G), and temporally, as mobile phones become increasingly used for Internet applications. Greater data resolution may help offset the relatively small effect sizes in our results, which are confounded by other brief interruptions to people’s routines, and allow the approach to extend beyond a large-scale epidemic of a transmissible pathogen. Environments lacking health-monitoring infrastructure, but where mobile-phone use is prevalent and consistent (33), have the greatest potential gains from CDR-based epidemic surveillance. In particular, establishing the nature of symptomatic behavior provides an opportunity to use artificial intelligence to identify patterns suggesting that an individual or a group is symptomatic, and thus estimate the numbers of cases. We are optimistic that further study could establish the full generality and versatility of infectious disease surveillance using call-data records on their own.
The work was partially supported by Icelandic Centre for Research Award 152620-051; an Emory University Research Council Award; NSF Faculty Early Career Development (CAREER) Grant 1553579; and a hardware donation from NVIDIA Corporation. L.D. was supported by the Leverhulme Trust Early Career Fellowship and The Alan Turing Institute Engineering and Physical Sciences Research Council Grant EP/N510129/1. L.D. and E.B.-P. are supported by Medical Research Council Grants MC_PC_19067 and MR/V038613/1. E.B.-P. acknowledges support from the National Institute for Health Research (NIHR) Health Protection Research Unit in Evaluation of Interventions at the University of Bristol.
All study data are included in the article and/or SI Appendix. The code and documentation used in our analysis are available at https://github.com/SimBioSysLab/cdr-open-code.
January 26, 2021: The author line has been updated.
1
2
3
5
6
7
8
9
10
11
12
13
14
15
16
17
18
19
20
21
22
23
24
25
27
28
29
30
31
32
33
34
35
36
37
38
39
40
41
42
43
 Cell-phone traces reveal infection-associated behavioral change
 Facebook
 Twitter
 Linkedin
 Whatsapp

