
Biomineralization occurs in aqueous environments. Despite the ubiquity and relevance of CaCO3 biomineralization, the role of water in the biomineralization process has remained elusive. Here, we demonstrate that water reorganization accompanies CaCO3 biomineralization for sea urchin spine generation in a model system. Using surface-specific vibrational spectroscopy, we probe the water at the interface of the spine-associated protein during CaCO3 mineralization. Our results show that, while the protein structure remains unchanged, the structure of interfacial water is perturbed differently in the presence of both Ca2+ and CO32– compared to the addition of only Ca2+. This difference is attributed to the condensation of prenucleation mineral species. Our findings are consistent with a nonclassical mineralization pathway for sea urchin spine generation and highlight the importance of protein hydration in biomineralization.
Calcium carbonate (CaCO3) is an abundant bio- and geomineral on Earth and is highly relevant to the environment, being a significant repository of carbon dioxide (CO2).1 Knowledge of the mechanism of CaCO3 nucleation is of central importance for the fabrication of bioinspired materials and CO2 sequestration. So far, much progress has been made in our understanding of the mechanism for inorganic CaCO3 generation.2−5 It has recently been argued that the nucleation of CaCO3 involves stable prenucleation species, i.e., prenucleation ion clusters (PNCs)2,6,7 or a metastable liquid condensed phase.8,9 Water plays a key role in the mineralization: the release of water molecules from hydrated mineral ions results in the formation and stabilization of PNCs and, later, in their dehydration and transformation into metastable dense liquid and amorphous intermediates, thereby kinetically directing the mineralization pathway.6,9−12 This nonclassical nucleation pathway remains debated3,4 but has not been disproven.5 Rather, the nonclassical nucleation theory unifies various experimental observations, for instance, the liquid mineral intermediates (polymer-induced liquid precursors8) for bioinspired material fabrication.13
Different from inorganic CaCO3 mineralization,2,5−8 CaCO3biomineralization in nature is more complex, taking place in the presence of proteins and other biomolecules. The process relies on the concerted interfacial interactions among protein, mineral, and water.14,15 Despite the available studies,10,16 it remains unclear whether CaCO3 mineralization by proteins involves prenucleation species (e.g., PNCs) and what is the role of solvent water.
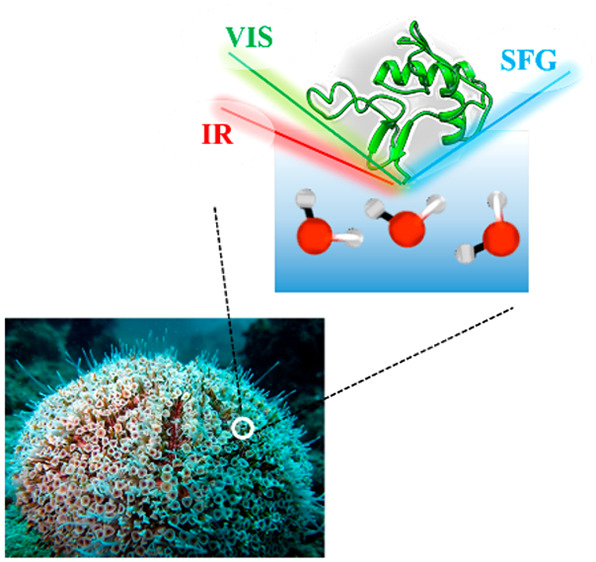
To shed light on the role of water for CaCO3 mineralization by proteins, we focus on one particularly remarkable system in nature—the sea urchin spine. Its hierarchical supramolecular structure and fascinating material properties have intrigued material scientists for decades.17−19 We probe the water at the interface of a spine-associated protein during CaCO3 mineralization in situ using surface-specific vibrational sum frequency generation (SFG) spectroscopy. SFG is a second-order nonlinear spectroscopy, where the signal is only generated at the surface and interface where centrosymmetry is broken.20−22 Thus, this method provides the vibrational response of the water molecules only at the spine protein interface for CaCO3 mineralization.
We select one specific spine-associated protein SpSM50, which has unique structural motifs: an N-terminal C-type lectin domain and a residual glycine- and proline-rich repeat region.23 We study the N-terminal C-type lectin domain (abbreviated as SM50-CTL below); this domain has been recognized as being functional in regulating early nucleation stages and subsequent phase transitions of the CaCO3 mineral phase, in this and other proteins.23,24
To improve our understanding of CaCO3 mineralization by SM50-CTL proteins, we first perform a potentiometric titration experiment. In this experiment, Ca2+ ions are gradually dosed into a 5 μM SM50-CTL solution in 10 mM carbonate buffer (pH 9.0) to initiate the CaCO3 mineralization process.2,6 The concentration of free Ca2+ ions in solution is quantified by a Ca2+ ion-selective electrode (see Supporting Information for details). The obtained titration curve (black), as shown in Figure 1A, allows different mineralization regimes to be distinguished: I–III correspond to under-supersaturation at prenucleation (I), supersaturation at prenucleation (II), and nucleation into (amorphous) minerals (III).10,19,25,26 As a comparison, the titration curve for Ca2+ into Tris buffer (green), which cannot trigger mineralization, is also shown and nearly overlaps the curve for dosed Ca2+ (red).

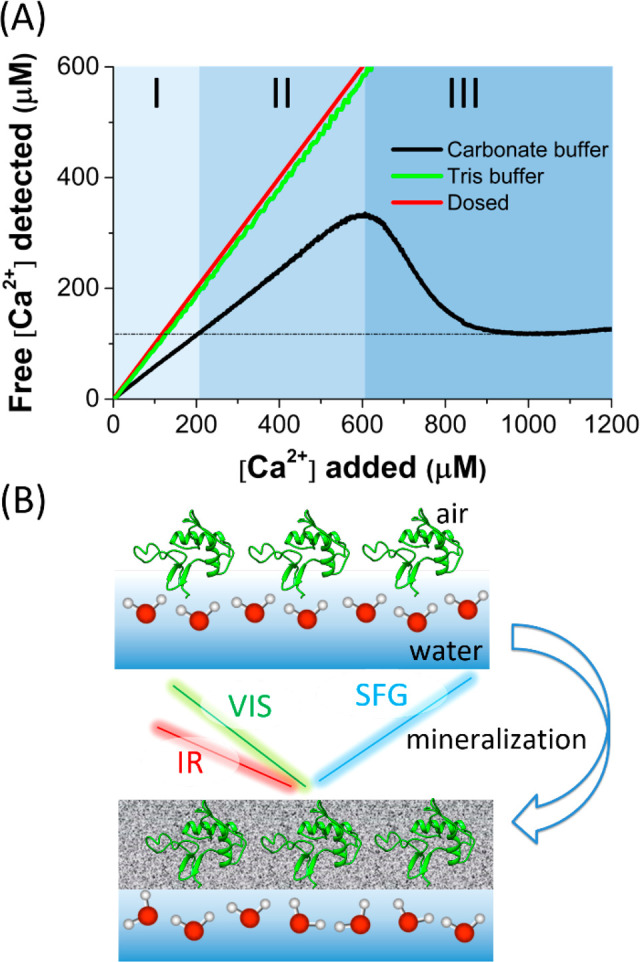
(A) Titration curve of Ca2+ into 5 μM SM50-CTL protein in 10 mM carbonate buffer. Different mineralization regimes are marked: under-supersaturation (I), supersaturation (II), and nucleation into (amorphous) minerals (III).10,19,25,26 The curves for dosed Ca2+ (red) and Ca2+ titrated into Tris buffer (green) are also shown. (B) Experimental scheme illustrating the interfacial mineralization and SFG spectroscopy. Spectra reported here were recorded with S-, S-, and P-polarized SFG, visible (VIS), and infrared (IR) light, respectively.
Figure 1B illustrates our experimental scheme to investigate the interface of SM50-CTL proteins during CaCO3 mineralization. The proteins were first allowed to adsorb to the air–carbonate buffer interface. Surface pressure measurement shows the proteins adsorb rapidly to the interface, reaching an equilibrium surface pressure of ∼30 mN/m. The gradual injection of Ca2+ has been reported to generate prenucleation CaCO3 species with the size of several nanometers6,10 and hydrated CaCO3 nuclei at early nucleation.10 These mineral species, together with Ca2+ ions, will screen the protein charge but apparently do not change the surface pressure (Figure S1).27,28 SFG measurements were performed in parallel with the titration experiment (Figure 1A), allowing the different mineralization stages in the SFG measurement to be probed.
Figure 2A shows the SFG spectra in the amide I region for the SM50-CTL protein assembled at the air–carbonate buffer interface with various Ca2+ concentrations. The spectra for the protein in the absence of Ca2+ show a distinct band at ∼1665 cm–1, suggesting a well-ordered secondary folding structure at the interface. The response can be adequately described by two sub-bands: one at 1642 cm–1, consistent with a combination of α-helical and β-turn structures,29,30 and one at 1679 cm–1, pointing to extended β-strands.29,31 When the Ca2+ concentration is varied, no noticeable spectral changes are observed. Accordingly, the inferred amplitudes of the two bands (Figure 2B) also show negligible changes. While a full structural characterization would require elaborate NMR experiments,32,33 the insensitivity of the amide vibrations points toward negligible conformational changes of the SM50-CTL proteins in the early stage of nucleation, which is further supported by the constant surface pressure (Figure S1) and circular dichroism spectra (Figure S3). The structural components inferred from the CD spectra are consistent with those inferred from SFG.
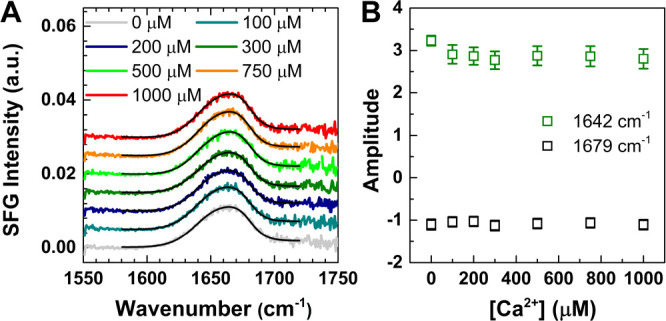
(A) Amide I SFG spectra for SM50-CTL protein at the air–carbonate buffer interface, with various amounts of Ca2+ ions indicated in the legend. The fits are shown as black lines. (B) Fitting amplitudes for two amide I bands with different amounts of Ca2+. Error bars represent the standard deviations of amplitudes.
Figure 3A shows the SFG spectra in the CH/OH region for the SM50-CTL protein at the air–carbonate buffer with various Ca2+ concentrations. The spectra are dominated by intense OH bands, with peaks at ∼3243 and ∼3432 cm–1, which reflect a distribution of strongly and weakly hydrogen-bonded (H-bonded) OH groups.22,34 The contribution from protein N–H groups is not discernible in the spectra.35 The negligible N–H contribution is further supported by the weak chiral PSP SFG signal (Figure S4), to which protein N–H groups and chiral water can contribute.36,37 The fitted spectra reveal main C–H bands at 2876, 2938, and 3065 cm–1, attributed to symmetric CH3 stretch, a combination of CH3 Fermi resonance and CH2 stretch from different amino acid side chains,38,39 and ν2 modes from aromatic sites,40 respectively. The observed intensity change of the CH bands upon adding Ca2+ ions is caused by interference effects with the changing OH response,40,41 as confirmed by spectra recorded in isotopically diluted D2O/H2O buffer solutions. The CH bands of the protein are unaffected by adding Ca2+ ions (Figure S5), in line with the amide I results (Figure 2).
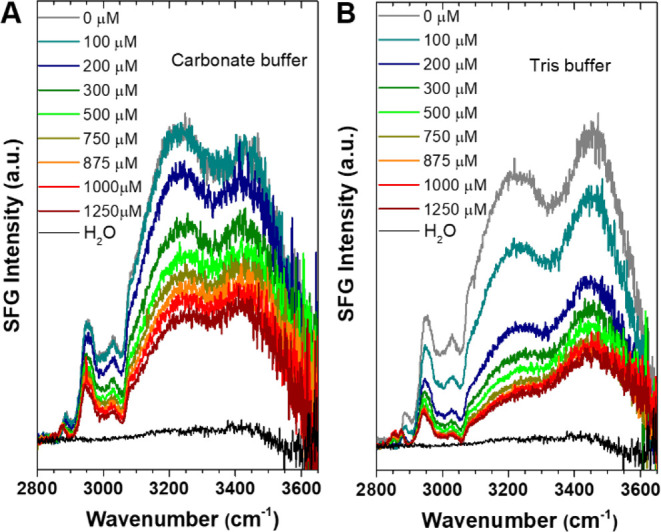
SFG spectra in the CH/OH region for SM50-CTL proteins at the interfaces of air with (A) 10 mM carbonate buffer and (B) 10 mM Tris buffer, at different, indicated Ca2+ concentrations. The spectra for pure H2O are shown for comparison.
In contrast to the protein amide/CH response, the water response changes substantially with increasing Ca2+ concentration. For charged interfaces, the SFG signal of water stems from the interfacial layer (χ(2) contribution) and the diffuse layer (χ(3)).42−45 For the moderate ionic strengths used in the present work, the contributions of the diffuse layer dominate, and as such, the SFG intensity of water reports on the surface potential (ϕ0). Figure 3 shows that, upon addition of Ca2+ ions, the water SFG intensity is reduced. Given the constant pH in our experiment (Figure S2), the reduced SFG intensity can stem from neutralization of the negative protein charge or more effective screening of the surface charge due to the increased ionic strength.27,28,46
As a reference, we also report SFG spectra for proteins in Tris buffer with the same pH (pH 9) and ionic strength (10 mM) (Figure 3B). Unlike carbonate buffer, the addition of Ca2+ ions into Tris buffer cannot induce CaCO3 mineralization. Therefore, this control experiment examines the effect of “pure” charge screening upon adding Ca2+ ions. The different spectral lineshapes for proteins in two buffers without Ca2+ can be attributed to the different interference between various (χ(2), χ(3), and nonresonant) signal sources and/or differences in coupling between OH oscillators.47 Comparing spectra for pure and isotopically diluted buffers (Figure S6 and S7) reveals such coupling effects but confirms the trends of the changing OH intensity with varying [Ca2+] (Figure S8). As clearly seen in Figure 3, upon adding Ca2+ ions, the OH bands decrease in intensity and shift toward higher frequency. The change is more pronounced for the Tris (Figure 3B) than for the carbonate (Figure 3A) buffer.
To quantify the above changes, Figure 4A shows the integrated intensity for the OH bands: ∑∫31003600I(ω)dω, reflecting the degree of water alignment. Upon adding Ca2+ ions to Tris buffer, Σ decreases rapidly; for the carbonate buffer, Σ decreases less dramatically. The weaker response of H-bonded water with Ca2+ for carbonate buffer is further supported by quantifying the first moment of the spectral distribution: μ = ∫31003600ωI(ω)d(ω)/∫31003600I(ω)d(ω). Figure 4B shows the change of μ versus [Ca2+] for the two buffers: μ increases much less for the carbonate buffer than for the Tris buffer. After nucleation ([Ca2+] = 1000–1200 μM), the absolute SFG intensity is higher, and μ has changed less for the carbonate buffer than for the Tris buffer. Both observations point to the interfacial water retaining a more ordered structure at the protein interface with CaCO3 than that with only Ca2+ cations.
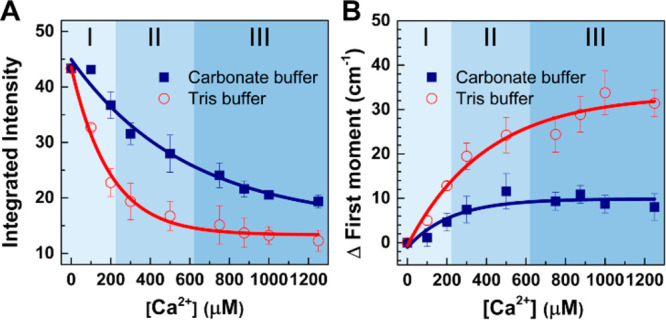
Integrated SFG intensity (A) and change of the first moment (B) of the two OH bands with adding different Ca2+ concentrations into carbonate (navy) and Tris buffer (red). The data were all fit to a single-exponential function (shown as lines). The background colors correspond to the different mineralization regimes in accordance with Figure 1A. Error bars show the standard deviations of the integrated intensities from multiple data sets.
The perturbation of interfacial water alignment, as mainly caused by the screening of protein charges, is illustrated in Figure 5. The interfacial water molecules are well-aligned by the charged proteins; this alignment can be readily perturbed by the screening of the protein charge with Ca2+ cations. In the mineralization environment (i.e., carbonate buffer), the charge screening appears less effective, and the first moment indicates that water molecules retain their bulk-like response. The observed water behavior can be rationalized by the co-condensation of other mineralization species, together with Ca2+ ions at the interface. Following previous studies on inorganic CaCO3 mineralization,6,9−12 these species are likely charge-neutral CaCO3 PNCs, which show great protein binding affinity. The presence of neutral PNCs at the protein interface would perturb the water structure, but not so much the alignment, and would explain the relatively rapid change of μ with increasing [Ca2+] while Σ changes more gradually.
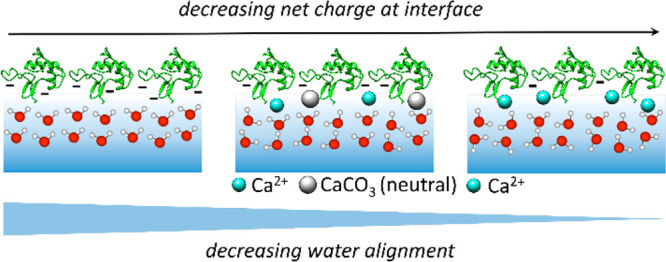
Sketch illustrating decreasing water alignment according to decreasing net charge at the SM50-CTL interface, with (center, carbonate buffer) and without (right, Tris buffer) prenucleation.
Previous experimental6,10,11 and simulation9,12 studies state that the stable PNCs further aggregate into nanodroplets in a later prenucleation stage, and the process goes along with water release from the hydration shell and has been related to microscopic liquid–liquid phase separation. This is possibly also relevant for the CaCO3 biomineralization in the presence of SM50-CTL proteins; the largest water perturbations occur in regime II ([Ca2+] = 300–500 μM, Figure 4A), at the point that liquid phase separation may also occur.
In conclusion, surface-specific SFG spectroscopy was applied to probe the SM50-CTL protein and, in particular, water at the interface for mineralization of the sea urchin spine. While the protein structure is unchanged, the structure of interfacial water is perturbed already at prenucleation. The perturbation is caused by the screening of protein charge. However, this screening appears less effective in the presence of carbonate for mineralization than the screening caused by only Ca2+ ions, which can be explained by the simultaneous condensation of both CaCO3 and Ca2+ to the protein, in line with the formation of PNCs at the protein interface. Our findings provide evidence for the presence of water in the nonclassical nucleation pathway for mineralization of sea urchin spine. The inferred nonclassical mineralization pathway is possibly relevant for other CaCO3 biominerals.
The Supporting Information is available free of charge at https://pubs.acs.org/doi/10.1021/jacs.0c11976.
Details of the experiments and more characterization data: surface pressure, pH variation during titration experiment, circular dichroism, chiral SFG spectra, SFG spectra for experiments in isotopically diluted buffers (PDF)
The authors declare no competing financial interest.
We acknowledge financial support from Max Planck Society and the MaxWater Initiative of the Max Planck Society.
 Role
of Water in CaCO3 Biomineralization
Role
of Water in CaCO3 Biomineralization
 Facebook
 Twitter
 Linkedin
 Whatsapp
