 One
Site, Two Cations, Three Environments: s2 and s0 Electronic Configurations Generate Pb-Free Relaxor
Behavior in a Perovskite Oxide
One
Site, Two Cations, Three Environments: s2 and s0 Electronic Configurations Generate Pb-Free Relaxor
Behavior in a Perovskite Oxide
Journal of the American Chemical Society


- Altmetric
The piezoelectric devices widespread in society use noncentrosymmetric Pb-based oxides because of their outstanding functional properties. The highest figures of merit reported are for perovskites based on the parent Pb(Mg1/3Nb2/3)O3 (PMN), which is a relaxor: a centrosymmetric material with local symmetry breaking that enables functional properties, which resemble those of a noncentrosymmetric material. We present the Pb-free relaxor (K1/2Bi1/2)(Mg1/3Nb2/3)O3 (KBMN), where the thermal and (di)electric behavior emerges from the discrete structural roles of the s0 K+ and s2 Bi3+ cations occupying the same A site in the perovskite structure, as revealed by diffraction methods. This opens a distinctive route to Pb-free piezoelectrics based on relaxor parents, which we demonstrate in a solid solution of KBMN with the Pb-free ferroelectric (K1/2Bi1/2)TiO3, where the structure and function evolve together, revealing a morphotropic phase boundary, as seen in PMN-derived systems. The detailed multiple-length-scale understanding of the functional behavior of KBMN suggests that precise chemical manipulation of the more diverse local displacements in the Pb-free relaxor will enhance performance.
Introduction
Piezoelectrics are important components of many types of everyday technology, employed in applications as varied as radio-frequency sensors in cellular phones to ultrasonic transducers for medical imaging.1 The highest-performing material families locate Pb2+ on the A-site of the ABO3 perovskite oxide structure, which can accommodate a range of local displacements driven by the stereochemically active 6s2 electronic configuration of the cation (Figure 1a).2

![(a) Diagram illustrating the Pm3m cubic aristotype for ABO3 perovskite
and displacements of the A-site that create polarization. The A-site,
B-site, and oxygens are shown in purple, orange, and red, respectively.
Displacement directions are shown, and the resulting symmetries are
given. Displacement directions, in brackets, are all relative to the
cubic cell, whereas lattice planes, in parentheses, are relative to
the cubic cell only if the subscript c is used. Displacements lying
on mirror planes result in monoclinic symmetry, which are illustrated
as gray lines on the top left. For example, a Cm symmetry
represents polarization in the (011)c mirror plane. Proposed
phase progressions for PZT and PMN-PT are given, with the MPB symmetry
shown in bold. (b–d) Calculated electron density distribution
from a maximum entropy method analysis of SXRD data and the contour
plots of A-site cross sections corresponding to the (b) (020), (c)
(011), and (d) (112) planes. Arrows have been added to the cross sections
to illustrate displacement directions associated with [001], [011],
and [111] displacements. (e) Results of combined Rietveld refinement
of SXRD and three sets of NPD data, with the high-resolution NPD data
(bank 5, Polaris) shown, using the disordered cubic model with three
A-sites, K+ in the center, Bi3+ displaced along
[001] and [111], and anisotropic displacement parameters on the oxygen.
Observed data are shown as black circles, calculated are shown as
a magenta line, the difference is shown as an orange line, hkl ticks for KBMN are shown in green, and hkl ticks for the vanadium sample holder are shown in cyan. The high-Q region is shown in the inset.](/dataresources/secured/content-1765862689572-152c0d79-f74e-4c38-8fa0-a9c456feb82e/assets/ja0c10572_0001.jpg)
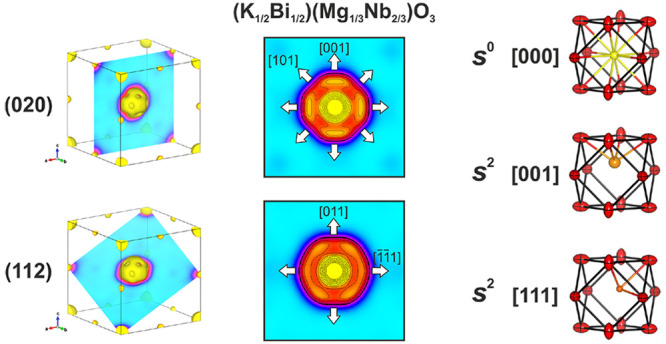
(a) Diagram illustrating the Pm3m cubic aristotype for ABO3 perovskite and displacements of the A-site that create polarization. The A-site, B-site, and oxygens are shown in purple, orange, and red, respectively. Displacement directions are shown, and the resulting symmetries are given. Displacement directions, in brackets, are all relative to the cubic cell, whereas lattice planes, in parentheses, are relative to the cubic cell only if the subscript c is used. Displacements lying on mirror planes result in monoclinic symmetry, which are illustrated as gray lines on the top left. For example, a Cm symmetry represents polarization in the (011)c mirror plane. Proposed phase progressions for PZT and PMN-PT are given, with the MPB symmetry shown in bold. (b–d) Calculated electron density distribution from a maximum entropy method analysis of SXRD data and the contour plots of A-site cross sections corresponding to the (b) (020), (c) (011), and (d) (112) planes. Arrows have been added to the cross sections to illustrate displacement directions associated with [001], [011], and [111] displacements. (e) Results of combined Rietveld refinement of SXRD and three sets of NPD data, with the high-resolution NPD data (bank 5, Polaris) shown, using the disordered cubic model with three A-sites, K+ in the center, Bi3+ displaced along [001] and [111], and anisotropic displacement parameters on the oxygen. Observed data are shown as black circles, calculated are shown as a magenta line, the difference is shown as an orange line, hkl ticks for KBMN are shown in green, and hkl ticks for the vanadium sample holder are shown in cyan. The high-Q region is shown in the inset.
Two standout material families have been fundamental for the design of these advanced electroceramic components. A solid solution between the antiferroelectric PbZrO3 and ferroelectric PbTiO3 affords the PbTi1–xZrxO3 (PZT) family, while a solid solution between the canonical relaxor (CR) Pb(Mg1/3Nb2/3)O3 and ferroelectric PbTiO3 affords the (1 – y)Pb(Mg1/3Nb2/3)O3-yPbTiO3 (PMN-PT) family. A common feature in these families is the observation of enhanced piezoresponse (d33 = 200–600 pm V–1 in PZT ceramics; for PMN-PT d33 = 720 pm V–1 in ceramics and 2100 pm V–1 in single crystals) in a narrow compositional range known as a morphotropic phase boundary (MPB).3−7 An MPB arises between two ferroelectric phases of distinct symmetry and polarization direction. In PZT, increasing sthe ubstitution of Ti4+ for Zr4+ results in a rhombohedral R3m phase with [111] polarization along the body diagonal of the cubic perovskite unit cell transforming to a tetragonal P4mm phase with [001] polarization along the cell edge (Figure 1a), due to ordered displacements of the 6s2 Pb2+ cation in these directions.1,3 The complex interplay of chemical bonding and physical response at the MPB continues to be debated in mechanistic terms, but the ability to reorient the electrical polarization between distinct crystallographic directions at low energy cost is felt to underpin the functional performance.2,6,8−10
PMN-PT also displays an MPB (Figure 1a), but in contrast to PZT, it arises from a solid solution between the ferroelectric PbTiO3 and the canonical relaxor Pb(Mg1/3Nb2/3)O3 (PMN, Pm3m), adding additional complexity.2,5,11−13 In PMN, the relaxor behavior is driven by disordered displacements of the 6s2 Pb2+ cation from the A-site center that create local dipoles. Relaxors are a class of compositionally disordered, centrosymmetric materials that show temperature-dependent relaxations in their dielectric response.13−15 These dipole relaxations are attributed to different sizes of polar nanoregions (PNRs), arising from chemical inhomogeneity. The interplay of local chemical and dipole ordering responsible for PNRs is currently a topic of intense debate.16−23 Relaxor properties can express themselves in slightly different ways, but relaxors have been traditionally defined according to the behavior of PMN, making it the canonical relaxor (CR).13,14
The outstanding functional performance of the Pb-based materials discussed above makes their replacement with Pb-free alternatives, which would be environmentally desirable, challenging. Design strategies for Pb-free systems have focused entirely on the structural and functional analogy with the PZT family by a solid solution between Pb-free ferroelectric (FE) parent materials with distinct polarization directions: e.g., rhombohedral R3c ([111]) symmetry in (Na1/2Bi1/2)TiO3 with tetragonal P4mm symmetry in BaTiO3 or (K1/2Bi1/2)TiO3 (KBT).3,24,25
To pursue the PMN-PT design route to Pb-free piezoelectrics, a Pb-free CR analogue of PMN is needed. We present the Pb-free canonical relaxor (K1/2Bi1/2)(Mg1/3Nb2/3)O3 (KBMN), produced by substitution of Pb2+ in PMN with (K1/2Bi1/2)2+ on the A-site of the perovskite. This substitution preserves the charge balance, maintains the presence of stereochemically active 6s2 cations, and has an appropriate mean ionic radius ((K1/2Bi1/2)2+, 1.50 Å; Pb2+, 1.49 Å). Previously reported as a rhombohedral ferroelectric,26,27 our dielectric, polarization, strain, and heat capacity measurements combined with maximum entropy and Rietveld analysis of neutron powder diffraction (NPD) and synchrotron X-ray diffraction data (SXRD) reveal that KBMN is a cubic relaxor, but with key differences from PMN that are attributable to the underlying chemistry. Both materials show local A-site displacements that do not break their centrosymmetric average structures and thus drive their relaxor characteristics, but those displacements differ because of the distinct behaviors of the s2 and s0 cations occupying the A-site in KBMN, which generate three distinct local sites in its cubic average structure. These chemical differences result in KBMN having a lower dielectric permittivity, a greater dielectric relaxation, and more entropic degrees of freedom in comparison to PMN. We then explore the PMN-PT design route by combining the Pb-free CR KBMN with the Pb-free FE KBT in (1 – x)KBMN-xKBT. The transition through two monoclinic symmetries observed in the SXRD data of this solid solution is exactly that seen in PMN-PT and affords polarization, strain, and relaxation responses demonstrating that the Pb-free CR-FE system also displays an MPB. This relaxor–ferroelectric (CR-FE) solid solution strategy opens new directions for the design of Pb-free ferroelectrics.
Experimental Section
Materials were synthesized using standard solid-state synthesis methods via a mixed oxide route to prevent the formation of pyrochlore impurities. The mixed oxide method has been routinely employed in the synthesis of PMN and PMN-PT for this reason.28 A columbite precursor (MgNb2O6) was made by mixing (MgCO3)4Mg(OH)2·5H2O (99.99%, Sigma) and Nb2O5 (99.9%, Alfa Aesar) in stoichiometric amounts and grinding them in an agate pestle and mortar before reaction in an Al2O3 crucible at 1450 °C for 3 h with a 5 °C/min ramp rate on both heating and cooling. Pure MgNb2O6 was then ground and mixed with stoichiometric amounts of Bi2O3 (99.999%, Alfa Aesar), K2CO3 (99.99%, Sigma), and TiO2 (99.999%, Alfa Aesar) in a pestle and mortar to achieve the desired composition. Mixed reagents were then milled in a planetary ball mill (Fritsch, Pulverisette) in zirconia pots with seven 10 mm zirconia balls and 10 mL of ethanol for 15 min, with 10 min pauses, before reversing the milling direction, over 20 cycles. Milled samples were dried at 80 °C before being calcined in a Al2O3 crucible for 3 h with a 5 °C/min ramp rate on both heating and cooling. Calcined powders were pressed into 10 mm cylindrical disks, placed in Al2O3 crucibles, buried in a sacrificial powder of the same composition, covered, annealed twice for 12 h each, with a 5 °C/min ramp rate on both heating and cooling, and intermittently ground to achieve pure phase powders. The calcining and annealing temperatures increased with increasing x substitution, and the temperatures can be found in Table S1. The composition of these materials was confirmed to be stoichiometric using optical emission spectroscopy with an inductively coupled plasma atomizer (ICP-OES) and by energy dispersive X-ray spectroscopy (EDX). Scanning electron microscopy (SEM) and EDX were performed with a Hitachi S4800 instrument equipped with an EDX detector from Oxford instruments. Powder samples were dispersed on a carbon tape attached to an alumina stub and coated with a thin film of carbon before performing imaging and EDX. Chemical quantification was performed using Aztec software. EDX correction factors, for the different elements, were estimated by measuring the EDX spectra of appropriate standards. The purity of the standards was confirmed using X-ray diffraction.
The purity of samples was determined in the laboratory by powder X-ray diffraction (XRD) using a Panalytical X’pert Pro instrument with Co Kα1 (λ = 1.788960 Å) radiation. Synchrotron XRD (SXRD) data were collected at the Advanced Photon Source at Argonne National Laboratory on beamline 11BM (λ = 0.4128370 Å). Samples were prepared by coating a 0.8 mm Kapton capillary and nesting it inside a 1.5 mm Kapton capillary. For neutron powder diffraction (NPD), 8.4562 g of the sample was loaded into a 10 mm diameter, thin-walled vanadium can. Data were collected on the Polaris diffractometer at ISIS, the U.K. time-of-flight neutron source, for 120 min. The neutron absorption was corrected by processing NPD data using the experimental composition, mass, and sample volume to ensure that the peak intensities were representative of the material. Three detector banks were used for analysis with 2θ = 52.21, 92.59, and 146.72°, banks 3–5, respectively. Selected area electron diffraction (SAED) on different zone axes was performed on a JEOL 2100+ instrument using a double-tilt holder. Powder samples were dispersed on a carbon-coated copper TEM grid. ED patterns were simulated using Single Crystal software. All previously mentioned XRD, NPD, and SAED experiments were performed at room temperature. Low-temperature XRD data were measured on a Rigaku SmartLab diffractometer using a Mo Kα rotating anode source and a PheniX cooling chamber (Oxford Cryosystems).
All data were analyzed using a Pawley or Rietveld analysis as implemented in the Topas Academic software package.29 X-ray peak profiles were fit with the Stephens model30 to account for micro strain, and the Gaussian size contribution and NPD profiles were fit with a pseudo-Voigt function. Backgrounds were fit with a Chebyshev polynomial function with 12 terms for X-ray data and 18 terms for NPD data. For Rietveld refinements of KBMN, the initial Pawley configurations were used as the initial models, with fixed backgrounds, instrumental parameters, and profile parameters. Atomic positions and isotropic displacement parameters were constrained to be equal for different cations on a shared site. Anisotropic displacement parameters were used on the oxygen position. Split oxygen sites and anisotropic displacement parameters were both investigated, but the latter model yielded better fits, reducing the Rwp from 4.85% to 4.33% and improving the visual fit. Occupancies of all sites were restrained to match the target stoichiometry as these were confirmed using analytical methods. Refinement of the occupancies was attempted but resulted in occupancies of greater than 1, leading us to constrain the occupancies to the measured stoichiometry. Additional A-site positions in the [001] and [111] directions were added by analyzing the maximum entropy method (MEM) outputs and determining displacement magnitudes. The atomic positions of K+ and Bi3+ were constrained to be the same when they were on the same displaced site to ensure that the displacement magnitudes were equal. Occupancies on A-sites were restrained to match the stoichiometry, factoring in the site occupancy. The occupancies of K+ and Bi3+ were initially constrained to be equal across the three A-sites in the model ([000], [001], and [111]). Attempts to refine of a [011] displaced site always resulted in a 0 occupancy. All atomic positions, atomic displacement parameters, lattice parameters, profile parameters, backgrounds, zero errors, and occupancies were refined to yield the final structural model. A crystallographic information format (CIF) file has been submitted with this publication. Root-mean-square displacements of bonds were calculated by accounting for how Bi3+ and O2– atomic displacements, and their errors, affect the distribution of possible bond lengths for each displaced A-site. The atomic displacement contribution from O-sites was determined by finding the displacement along the trace of the anisotropic strain tensor where the bond vector intersects it. All MEM inputs were created using Jana2006,31 3D electron density distributions were calculated with BayMEM,32 and outputs were visualized in VESTA.33
Pure phase powders were sintered into dense ceramics using spark plasma sintering (SPS) in a Thermal Technology LLC DCS10 furnace. Samples (∼0.75 g) were loaded into a 10 mm diameter graphite die lined with a graphite foil and loaded into a sample chamber which was evacuated and backfilled with He three times. The sample was pressed uniaxially at 60 MPa, heated to the desired temperature at a rate of 200 °C/min, held for 1 min, and cooled at the same rate. The sintering temperatures for each composition can be found in Table S1. Temperatures were controlled by a pyrometer through a bore hole in the side of the die; the emissivity of the die set was not accounted for, and so the true temperature of the powder during pressing likely varied from the measured value. These disks were then heated in a tube furnace under an O2 atmosphere at the calcining temperature for 12 h with a 5 °C/min ramp rate on heating and cooling. Firing the disks under O2 allowed for the oxidation of any residual graphite from the surface of the pellets as well as relief of any residual stress from the interface of grains. This process resulted in pure phase pellets with densities of 95% of the crystallographic density or greater as determined by the Archimedes method.
Dense pellets were polished on a Struers automatic polishing machine using #800 and #1200 SiC foils (Struers). Pellets for dielectric measurements were polished down to a thickness of 500–900 ± 10 μm. A high-temperature gold paste (Koartan 4129) was used to form electrodes and was painted on faces of the cylinders and fired on at 650 °C for 30 min with a 5 °C/min ramp rate on heating and cooling. The dielectric permittivity (ε′) and loss tangent (tan δ) were measured using an Agilent 4980A instrument with a home-built sample holder and a program created in LABVIEW.34 Data were collected from room temperature to 600 °C on heating and cooling and reported on cooling. Curie–Weiss fitting was done on the high-temperature linear region of the inverse ε′, and the Burns temperature was determined to be where 1/έ deviated from that Curie–Weiss fit.35 Low-temperature dielectric and thermally stimulated depolarization current (TSDC) measurements were performed in a Delta 9023 environmental test chamber under liquid nitrogen.
Samples for piezoelectric and ferroelectric measurements were polished in a way similar to that for dielectric samples but to a thickness of 150–400 ± 10 μm and subsequently polished to a mirror finish with #4000 SiC foil (Struers). Gold electrodes were attached to surfaces by sputtering the disks for 60 s on each face. An aixPES instrument (aixACCT GmbH, Germany) was used to perform P(E), S(E), and I(E) measurements at room temperature. The maximum polarization (Pmax) and the remnant polarization (Pr) were taken from P(E) loops under a positive electric field at 80 kV/cm. The coercive field (Ec) was determined as the peak of the current in I(E) data, under a positive field at 80 kV/cm. P(E) data on KBMN were measured at 200 K in a Delta 9023 environmental chamber under liquid nitrogen using a Radiant Ferroelectric Test Kit. Electric fields were applied to the samples while they were submerged in silicone oil in order to prevent electrical breakdown, and all measurements were done at 1 Hz. Samples for TSDC were heated to 413 K and then field cooled at 60 kV/cm to 100 K at a rate of 1 K/min. Once the temperature was reached, the sample was short-circuited to dissipate any accumulated charge for 30 min before heating, leaving only current from intrinsic polarization. The current was measured with a Keithley 6430 sub-femtoampere remote source meter with heating at 1 K/min. Polarization was calculated by integrating the current with respect to time using the equation

Heat capacity measurements were performed on dense pellets that were made into rectangular shapes to fit in the instrument. Data from 1.8 to 350 K were measured on a Quantum Design Physical Properties Measurement System (PPMS) using the heat capacity option. The heat capacity values were determined by the relaxation method. The sample was affixed to the stage using N-grease from 1.8 to 250 K and using H-grease from 250 to 350 K, the contribution of which to the heat capacity was subtracted by measuring an addendum prior to sample measurement. Three data points were collected at every temperature to measure an average. Data from 313 to 967 K were collected on a Netzsch Pegasus 404 DSC instrument with a Pt furnace attachment in a Pt crucible under a 50 mL/min flow of N2. The heat capacity was determined from the heat flow by the ratio method comparing to a sapphire crystal measured in exactly the same way. The heat capacity data were analyzed in Mathcad using a linear combination of Debye functions with the general formula
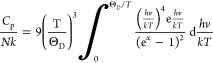
A linear term (γ) was also found to be necessary to fit the heat capacity. Usually, these terms are attributed to the electronic contribution to the heat capacity, but it can also be from any two-level quantum system wherein an atom can tunnel between two states and is found to be present in disordered solids.36,37 This term is likely to then be due to the disorder present in the material, which can create atomic positions that are close in energy. The contributions from the two ΘD temperatures, three ΘE temperatures, and γ were found to be 0.35 for ΘD1 (280 K), 0.6051 for ΘD2 (803 K), 0.0006 for ΘE1 (27 K), 0.0069 for ΘE2 (50 K), 0.0374 for ΘE3 (81 K), and 0.45 for γ (3.182 × 10⁻⁵ J mol–1 K–2).
To calculate the additional Cp from dipoles, the calculated Cp from our phenomenological model was subtracted from the measured Cp by interpolating the value of the measured Cp for each calculated value. The additional Cp was then divided by the temperature and integrated over the temperature range to determine the dipole entropy, divided by the gas constant (R) to normalize the value, and multiplied by the atoms per formula unit to determine the entropy per atom. To calculate the dipole entropy per Bi3+, this value was multiplied by 2.
Results and Discussion
Synthesis of (1 – x)KBMN-xKBT required the mixed oxide method using a MgNb2O6 precursor to suppress pyrochlore impurities, adapted from PMN-PT.28 Full synthetic and ceramic processing details can be found in Table S1 and Figure S1 in the Supporting Information. Materials were confirmed to be stoichiometric by SEM-EDX and ICP-OES (Figure S2a,b). KBMN was first compared to PMN structurally, at room temperature. SXRD patterns index to Pm3m symmetry, and Pawley fits show no signs of symmetry lowering (Tables S2 and S3). Rietveld refinement of these data in Pm3m symmetry yield a high-quality fit (Figure S3 and Tables S4 and S5), but the A-site isotropic displacement parameter (Biso) is 10.90(18) Å2. Relatively high A-site Biso values of 3–4.5 Å2 are common in CRs such as PMN, Pb(Sc1/2Nb1/2)O3, and (K1/2Bi1/2)(Sc1/2Nb1/2)O3.38−41 A Fourier difference analysis of SXRD fits (Figure S4) reveals missing electron density from the model, distributed isotropically around the A-site. A Fourier difference analysis of NPD data (Figure S5) shows oxygen disorder, which was better modeled with anisotropic displacement parameters than with multiple oxygen sites, as described in the Experimental Section.
To investigate the local structural origin of the large A-site Biso value, we analyzed SXRD data using the maximum entropy method (MEM), which reconstructs the electron density directly from the measured Bragg intensities.31,32 The resulting 3D electron density distributions can be seen in Figure 1b–d and accurately reproduce the perovskite structure, but the A-site distribution is clearly and distinctly nonspherical. Contour plots of (020), (011), and (112) lattice planes can be seen in Figures 1b–d, respectively. The electron density shows a maximum for the central A-site position (1/2, 1/2, 1/2)—another maximum is displaced along the ⟨001⟩ directions. There is a continuous distribution of electron density from ⟨001⟩ to ⟨111⟩ directions, which is reduced in the ⟨011⟩ directions.
Guided by the MEM analysis, we created a structural model for Rietveld refinement with three A-sites in order to capture the measured electron density: one central site ([000]) and two additional sites corresponding to displacements along [001] and [111]. Displacements in [011] directions were attempted but were found to not contribute, as described in the Experimental Section. The atomic positions, Biso values, and occupancies for K+ and Bi3+ on each A-site were constrained to be equal, but these parameters were allowed to refine independently for each A-site, as the high-Q diffraction data permitted this. The atomic displacement parameters, displacement magnitudes of [001] and [111] A-sites from the A-site center, and A-site occupancies were refined simultaneously while the overall composition was restrained to match the measured stoichiometry. The resulting combined refinement has reasonable Biso values (Table S6) and fits the NPD data well (Figure S6) but has large intensity mismatches with SXRD data. Refinements against SXRD data only result in different occupancies and a large intensity mismatch with NPD data. The observation of two local minima separately consistent with X-ray and neutron data led us to allow different K+ and Bi3+ occupancies on each of the three A-sites to account for the scattering contrast, while the overall composition was continued to be restrained to maintain the measured stoichiometry. This allowed the model to rapidly converge to fit both data sets very well simultaneously (Figure S7) and afforded reasonable structural parameters (A-site Biso ≤ 1.6 Å2, Table S7). The separation of the K+ and Bi3+ occupancies on the three components of the A-site led, within error, to solely K+ occupancy of the [000] position at the A-site center, with only Bi3+ on the displaced, lower point symmetry [001] and [111] sites. This led us to restrict the K+ to the [000] site and let Bi3+ refine on the other sites (Figure 1e and Figure S8). All bond lengths and bond valence sums (Table S8) in this final model are reasonable.
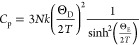
The refined parameters are shown in Table 1, and the refined structure is shown in Figure 2a. The s0 K+ cations occupy the cubic symmetry [000] position (m3m point group, Figure 2b) and the s2 Bi3+ cations are displaced away from it. Of the total A-site cations, 32(2)% are Bi3+ on the 4mm symmetry [001] displaced position (Figure 2c) and 18(2)% are Bi3+ on the 3m symmetry [111] position (Figure 2d). B-site polyhedra are shown in Figure S9. The local displacements of Bi3+ from the A-site center correspond to local dipoles, and their inability to drive global symmetry lowering provides a route to the possible formation of polar nanoregions (PNRs) through a shorter-range correlation. Previously reported disordered cubic perovskites have refined a single A-site that is displaced from the site center and thus not the roles of s0 and s2 configurations were not distinguished.38−44 We are able to distinguish the average structure effect of these different chemistries in creating three sites, which are differentially occupied in a manner that is driven by the contrast in electron configuration between K+ and Bi3+. This is because of the Q range, counting statistics, and scattering contrast of the two data sets. The A-site displacements in KBMN are 0.6005(17) Å along [001] and 0.5901(11) Å along [111], whereas PMN and (K1/2Bi1/2)(Sc1/2Nb1/2)O3 have displacements of 0.31 Å along [111] and 0.44 Å along [001], respectively.39,41 The displacements in KBMN are therefore the largest seen in a disordered cubic model but result in more reasonable bonding environments for Bi3+.

![(a) Final refined structure from Rietveld analysis of (K1/2Bi1/2)(Mg1/3Nb2/3)O3. The [000] A-site is yellow, [001] sites are orange, [111] sites
are red-orange, B-sites are shown as cyan octahedra, and oxygens are
shown as red displacement ellipsoids (90% probability). The sizes
of all atoms are representative of the refined atomic displacement
parameters. Polyhedral environments of the (b) [000], (c) [001], and
(d) [111] A-sites. The polyhedral centroid is shown as a light gray
sphere, an d the shortest A–O distances within the respective
polyhedra are both shown as bonds, and the value is given. (e) Bond
lengths for the [001] and [111] A-sites, where the error bars account
for the rms displacements of both the A-site and the O atoms. The
rms displacement of the oxygen atom is calculated from its anisotropic
displacement tensor in the direction of the A–O bond vector.
Average bond lengths are shown as white circles, and the [000] A-site,
PMN, KNbO3, [001] A-site (intersecting the O two different
ways), the [111] A-site, Bi(Zn1/2Ti1/2)O3 (BZT), and BiFeO3 (BFO) are shown to illustrate
that the displaced A-sites are more consistent with Bi3+ environments. Selected area electron diffraction data (SAED) along
(f) [111] and (g) [103] zone axes shown in black and white, with calculated hkl Bragg reflection positions displayed in red. Selected
reflections have been indexed for clarity. Arrows have been added
to the [111] zone axis to call attention to sheets of diffuse scattering
between the 220 Bragg reflection and both 120 and 211 Bragg reflections. A red
box has been added to the [103] zone axis which lies in the [331] direction, the line profile of which is shown in
(h). Arrows in the line profile highlight sheets of diffuse scattering
that are indicated by the red circles in the [103] zone axis.](/dataresources/secured/content-1765862689572-152c0d79-f74e-4c38-8fa0-a9c456feb82e/assets/ja0c10572_0002.jpg)
(a) Final refined structure from Rietveld analysis of (K1/2Bi1/2)(Mg1/3Nb2/3)O3. The [000] A-site is yellow, [001] sites are orange, [111] sites are red-orange, B-sites are shown as cyan octahedra, and oxygens are shown as red displacement ellipsoids (90% probability). The sizes of all atoms are representative of the refined atomic displacement parameters. Polyhedral environments of the (b) [000], (c) [001], and (d) [111] A-sites. The polyhedral centroid is shown as a light gray sphere, an d the shortest A–O distances within the respective polyhedra are both shown as bonds, and the value is given. (e) Bond lengths for the [001] and [111] A-sites, where the error bars account for the rms displacements of both the A-site and the O atoms. The rms displacement of the oxygen atom is calculated from its anisotropic displacement tensor in the direction of the A–O bond vector. Average bond lengths are shown as white circles, and the [000] A-site, PMN, KNbO3, [001] A-site (intersecting the O two different ways), the [111] A-site, Bi(Zn1/2Ti1/2)O3 (BZT), and BiFeO3 (BFO) are shown to illustrate that the displaced A-sites are more consistent with Bi3+ environments. Selected area electron diffraction data (SAED) along (f) [111] and (g) [103] zone axes shown in black and white, with calculated hkl Bragg reflection positions displayed in red. Selected reflections have been indexed for clarity. Arrows have been added to the [111] zone axis to call attention to sheets of diffuse scattering between the 220 Bragg reflection and both 120 and 211 Bragg reflections. A red box has been added to the [103] zone axis which lies in the [331] direction, the line profile of which is shown in (h). Arrows in the line profile highlight sheets of diffuse scattering that are indicated by the red circles in the [103] zone axis.
Figure 2e shows the A–O bond lengths and root-mean-squared (rms) displacement for both K–O bonds and the shortest of the Bi–O bonds in [001] and [111] polyhedra. The shortest Bi–O bonds are in the direction in which the A-site is displaced (Tables S9 and 10). The rms displacement accounts for how the bond vector intersects the oxygen anisotropic displacement tensor. For the two BiO12 polyhedra in KBMN the Bi–O bond lengths are very close to those observed for the 100% Bi3+ A-site perovskites Bi(Zn1/2Ti1/2)O3 (BZT, [001] ordered A-site displacement P4mm, shortest Bi–O 4 × 2.384 Å) and BiFeO3 (BFO, [111] ordered A-site displacement R3c, shortest Bi–O 3 × 2.365 Å), which feature the same displacement directions, as seen in Table S8.45,46 Lower valence A-sites (K+, Pb2+) have longer bond lengths in comparison to Bi3+. The bond lengths for both PMN (2.861 Å, [000], Pm3m) and KNbO3 (2.763 Å, [011], Amm2) are longer than the measured Bi–O bond lengths in KBMN and are at the maximum of the rms displacement (2.772 Å) for the [001] displaced Bi3+ in KBMN.47,48 For disordered cubic models of PMN with [111] displacements, the Pb–O bond length (2.599 Å) is closer to Bi–O bonding environments but is still at least 0.126 Å longer. The A-site bond lengths in PMN ([000]) and KNbO3 are comparable to the isotropic KO12 bond length (2.861301(2) Å) in KBMN. The local symmetries of all cations are labeled in Table 1. The Rietveld model can only define one oxygen position; thus, additional information about local displacements is contained in the atomic displacement parameters. The bonding environments observed highlight the different structural roles of these ions. The smaller, 6s2 Bi3+ undergoes substantial (∼0.6 Å) displacements from the A-site center in two distinct directions to satisfythe valence requirements, breaking symmetry locally consistent with the bonding expected from its electronic configuration and creating a dipole at each A-site occupied by Bi3+, while the larger, spherical K+ maintains its centrosymmetric position, thus preventing octahedral rotation driven by Bi3+. The direct analysis of the electron density through MEM represents a new approach for studying relaxors. An MEM analysis would be interesting to apply to other relaxors, such as PMN, and raises questions of whether these disordered cubic systems have [000] sites. In cubic perovskite oxides, the chemical preference for local scale A-site displacements has only ever been seen in 0.6BaTiO3-0.4BiScO3 (300 K, Pm3m) and KBT (673 K, Pm3m) using reverse Monte Carlo modeling of total scattering data.49−51 The observation of a disordered cubic average structure with local cation displacements creating dipoles is consistent with a CR—the Q resolution of the data allows high confidence in the diagnosis of cubic symmetry for KBMN.
The Rietveld and MEM analyses determine the average structure and capture local disorder. Intermediate-length-scale pair correlations are revealed in selected area electron diffraction (SAED) data (Figures 2f,g). Diffuse scattering is observed between Bragg reflections along the [111] zone axis (Figure 2f) and as lines across the [103] zone axis (Figure 2g), which indicates correlations between dipoles. The same sheets of diffuse scattering seen in the [111] zone axis are present in PMN52 and give rise to linear diffuse streaks running along adjacent zone axes. In the [111] zone axis, sheets about the (220) reflection project toward adjacent (120) and (211) reflections, which have been marked with arrows in Figure 2f.52 These transverse {111}* sheets of diffuse scattering originate from linear correlations of cation displacements. The sheets of diffuse intensity are clearly observable in the line profile (Figure 2h) across the [103] zone axis. Along the [103] zone axis, in addition to diffuse sheets there are diffuse superlattice reflections observable, marked by arrows in Figure 2g. Diffuse superlattice reflections of this nature are indicative of nanoscale cation ordering. In PMN, diffuse superlattice reflections have been observed in SAED52−54 and single crystals,16,21,55,56 which arise from rock salt type ordering of the B-site cations. KBMN has the same B-site sublattice as PMN. These nanometer-scale chemically ordered regions with 1:1 ordered Mg2+ and Nb5+ cations, within a Nb5+-rich matrix, aid in the formation of PNRs in PMN.16,56 This observation of diffuse scattering in KBMN suggests that the local dipoles observed in the average structure refinement are correlated. The nature of these correlations, the roles of the A-site and B-site sublattices in these diffuse features, and the correlation lengths are all important parameters to understand further in order to deepen the analogy to, and differentiate from, PMN. Quantitative analysis of the diffuse scattering would likely require single-crystal diffuse scattering data, as the data acquisition times for SAED were limited due to sample damage from the electron beam. The diffuse scattering illustrates both that cation displacements are correlated and that B-site cations order on intermediate length scales. The local cation displacements identified in the average structure and these intermediate range correlations together are consistent with the formation of PNRs, in analogy with PMN.
The signature of relaxor properties is in the dielectric response. The temperature dependence of the real (ε′) and imaginary (ε′′) dielectric permittivity (Figure S10) from 300 to 900 K shows a peak (Tm) in ε′ at 413 K in 1 MHz data. Curie–Weiss fitting of 1 MHz data yields a Weiss constant (θW) of −2675 K, indicating antiferroelectric correlations, consistent with SAED. At low frequency Tm is not clearly visible, particularly in ε′′ data, indicating that the measurement ends in the middle of a frequency-dependent phase transition. To observe the full phase transition, ε′ and ε′′ were measured from 100 to 500 K (Figure 3a) to identify Tm for all frequencies. The frequency dependence of Tmfrom 1 MHz to 1 kHz (ΔTm) is determined to be 98 K. In PMN Tm is 266 K at 1 MHz, ΔTm is 18 K, and ε′ at Tm (ε′max) is 12000.57 The dielectric response of KBMN is in contrast to this, notably the ε′max value of 220. A decrease in ε′max by 2 orders of magnitude is seen in (Pb1/2Ba1/2)(Mg1/3Nb2/3)O3, indicating that the decrease in ε′ is associated with the removal of half of the s2 cations.58 This reduction in s2 cation content is likely not the only mechanism resulting in low permittivity, as the large off-centroid displacement in the absence of an electric field or the diversity of possible polarization vectors that within PNRs may also reduce the response reveal another key nuance differentiating the A-site chemistry of KBMN and PMN.59 The relaxation mechanisms were investigated using a Vogel–Fulcher analysis (Figure 3b), which yields a freezing temperature (Tf = 193 K) and activation energy (Ea = 0.0330 eV) for glasslike dipoles. KBMN has a ΔTm value that is almost 5 times that of PMN. The larger ΔTm indicates a larger size distribution of PNRs, but their activation energy is similar to that of PMN (Ea = 0.0786 eV).60 A larger ΔTm value is consistent with the Rietveld analysis of KBMN, which shows two large local A-site displacements instead of the single smaller displacement seen in PMN. The additional displacement coupled with the large variety of ferroelectric and antiferroelectric correlations possible, leading to more diverse PNRs, then readily explains the large dielectric relaxations observed. The shorter A–O bond lengths for Bi3+ than for Pb2+ would lead to stronger interactions between correlated dipoles, explaining the similar activation energies and higher Tm value in KBMN.
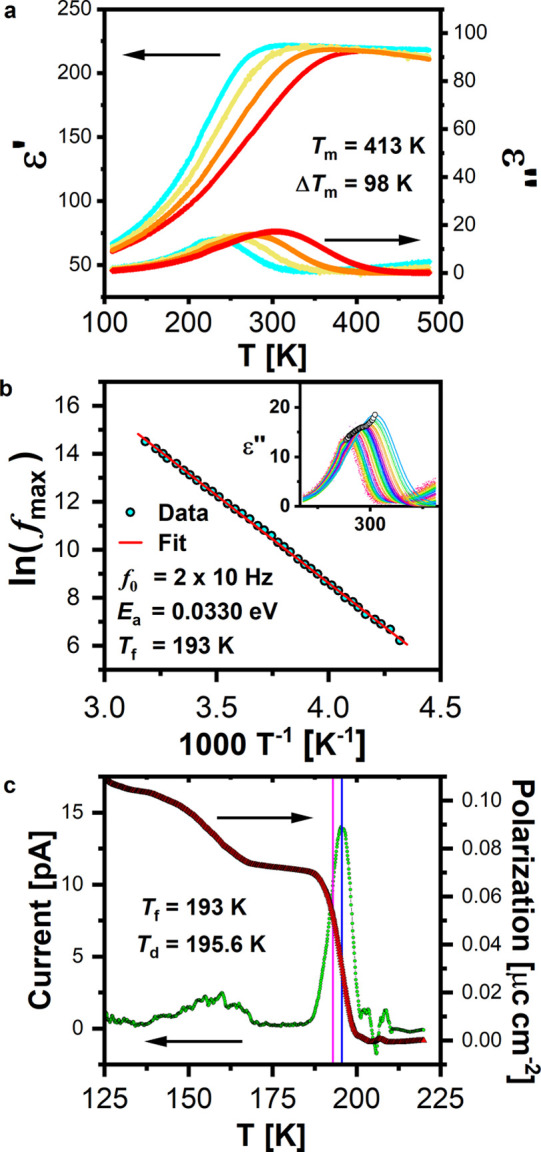
(a) Temperature dependence of real (ε′) and imaginary (ε′′) dielectric permittiviies of KBMN: 1 kHz (cyan); 10 kHz (yellow); 100 kHz (orange); 1 MHz (red). The temperature of ε′max (Tm) at 1 MHz and the difference in Tm from 1 MHz to 1 kHz (ΔTm) are shown. (b) Frequency dependence of Tm fit using a Vogel–Fulcher analysis. Tm values are shown as cyan circles and the fit as a red line. Tm values taken from ε′′ collected from 500 Hz to 2 MHz are labeled with white circles in the inset. The critical frequency (f0), activation energy (Ea), and freezing temperature (Tf) are shown. (c) Thermally stimulated depolarization current, showing the measured current in green and the polarization (red) derived from the integration of current with respect to time. The depolarization temperature (Td) determined from this measurement and the freezing temperature (Tf) from Vogel–Fulcher analysis are labeled in blue and magenta, respectively.
Our design strategy was to make a Pb-free CR, which requires that we preclude dipole glass or relaxor ferroelectric (RFE) mechanisms. A CR has a globally centrosymmetric structure which is maintained below dielectric transitions, despite measurable polarization, with no ferroelectric symmetry appearing in average structural data.13,14 A dipole glass and RFE both have dielectric relaxations, but the ground state dipole configuration leads to either no polarization or a ferroelectric symmetry below Tm, respectively. The ground state configuration of dipoles was investigated by measuring P(E) loops at room temperature and 200 K. Room-temperature P(E) data (Figure S11a) show a linear response, consistent with a lossy dielectric (tan δ = 0.122). At 200 K (Figure S12) the loops are still linear, but the slope of the loops increases with increasing applied field, indicating polarization of domains, but saturation is not observed at fields up to 100 kV cm–1.61 A high coercive field is consistent with the large Bi3+ off-centering, another distinction between KBMN and PMN. To further confirm polarization, the electrical current was measured while poled samples were heated. The thermally stimulated depolarization current (TSDC; Figure 3c) shows a peak for the depolarization temperature (Td) at 195.6 K, which is close to the calculated Tf value (193 K). The feature in the current response below 170 K is an experimental artifact from the freezing dielectric fluid. This low-temperature feature was also seen when the transition-free standard Al2O3 was measured, where no feature at 195.6 K is observed. Finally, variable-temperature XRD was measured from 295 to 12 K (Figure S13). These data show no indication of new reflections or peak splitting through the temperature range. A Pawley fitting of these data yields a smooth change in lattice parameters (Figure S14) with no sign of changes in symmetry. The observations of polarization in TSDC and P(E) data, the lack of emergent ferroelectric properties in P(E) data, and the maintenance of a globally cubic symmetry well below Tm, Td, and Tf allow us to classify KBMN as a CR.
The classification of KBMN as a CR through dielectric and polarization data adds insights into our structural analysis. The observation of local Bi3+ displacements through MEM and Rietveld analysis, the diffuse sheets representative of correlated cation displacements, and the diffuse superlattice reflections from B-site ordering indicate dipoles, the correlation of those dipoles, and local chemical ordering, respectively. These correlations are consistent with the observed relaxor behavior, which arises from the dynamics of regions of correlated polarization vectors (PNRs), which are confirmed via dielectric and polarization data. The details of whether [001] and [111] displacements aggregate with, or separate from, each other and their correlations with rock salt ordered regions are not available from these data.
Relaxor properties arise from freezing of dipole degrees of freedom, which is thermodynamically quantifiable, as the excess entropy over the phonon contribution to the heat capacity arises from this freezing. Thus, the heat capacity (Cp) of KBMN was measured as a function of temperature (Figure 4a). The phonon contributions to Cp were modeled from 1 to 1000 K with two Debye functions (ΘD1 = 280 K, ΘD2 = 803 K), three Einstein functions (ΘE1 = 27 K, ΘE2 = 50 K, ΘE3 = 81 K), and an additional linear term (γ = 3.182 × 10⁻⁵ J mol–1 K–2). The KBMN model is more complex than that of PMN, which has one Debye function (ΘD = 165 K), two Einstein functions (ΘE1 = 28 K, ΘE2 = 60 K),37 and a linear contribution, attributed to tunneling of atoms through nondegenerate states in a two-well potential,36 which can arise from the distribution of local environments in a relaxor. This enhanced complexity can be associated with the greater chemical heterogeneity arising from the more complex A-site chemistry and local displacement patterns (Table 1 and Figure 2a) quantified in the average structure of KBMN.
![(a) Temperature dependence of the heat
capacity (Cp) of KBMN shown as green circles
and the fit of the phonon
contribution as a red line. The orange line is the Dulong–Petit
limit, which is 3 times the gas constant (3R) and
represents the maximum phonon contribution. The model consists of
two Debye functions (ΘD), three Einstein functions
(ΘE), and a residual linear term (γ). (c) CpT–3 is inset
in and illustrates that the model fits well at low temperature and
that three ΘE functions are necessary, shown as ΘE1 in dark yellow, ΘE2 in purple, and ΘE3 in green. (b) Additional degrees of freedom per Bi3+ beyond phonons as a function of temperature are shown in orange,
which come from the integral of the additional Cp (excess over the phonon fit in (a), shown in the inset of
(b)). Local dipole degrees of freedom associated with the center-of-symmetry-breaking
displacements on the A-site in both (c) [001] and (d) [111] directions.](/dataresources/secured/content-1765862689572-152c0d79-f74e-4c38-8fa0-a9c456feb82e/assets/ja0c10572_0004.jpg)
(a) Temperature dependence of the heat capacity (Cp) of KBMN shown as green circles and the fit of the phonon contribution as a red line. The orange line is the Dulong–Petit limit, which is 3 times the gas constant (3R) and represents the maximum phonon contribution. The model consists of two Debye functions (ΘD), three Einstein functions (ΘE), and a residual linear term (γ). (c) CpT–3 is inset in and illustrates that the model fits well at low temperature and that three ΘE functions are necessary, shown as ΘE1 in dark yellow, ΘE2 in purple, and ΘE3 in green. (b) Additional degrees of freedom per Bi3+ beyond phonons as a function of temperature are shown in orange, which come from the integral of the additional Cp (excess over the phonon fit in (a), shown in the inset of (b)). Local dipole degrees of freedom associated with the center-of-symmetry-breaking displacements on the A-site in both (c) [001] and (d) [111] directions.
Above 200 K, the measured Cp diverges from this phonon model. The divergence arises due to additional entropy from melting dipoles and is at a temperature consistent with the onset of dielectric relaxations (Figure 3a), the calculated Tf (193 K), and Td (195.6 K) from TSDC (Figure 3c). The additional entropy from dipoles can be quantified, the integral of which (Figure 4b) gives the additional degrees of freedom (DOF) arising from the dipoles. The integration yields 0.92 DOF A-site–1 from dipole entropy, slightly smaller than the 1.1 DOF A-site–1 seen in PMN.62 This result is consistent with the refined average structure, with KBMN having 1.85 DOF (Bi3+)−1 and two Bi3+ displacement directions along [001] and [111] (Figure 4c,d), in comparison to PMN having 1.1 DOF (Pb2+)−1 and one [111] displacement. These Cp data further strengthen the assignment of KBMN as a CR by identifying the excess entropy associated with the two displacement directions that form the local A-site dipoles. The difference in excess entropy between PMN and KBMN also highlights the distinct chemical differences arising from the A-site chemistry. The additional degree of freedom presents an opportunity for additional tuning of functional properties, which is not available in PMN.
To increase the operational temperature of PMN and improve the piezoresponse through formation of an MPB, a solid solution with FE PT is needed. Therefore, we explored the formation of an MPB from the Pb-free CR KBMN through a solid solution with the Pb-free FE KBT. The solid solution (1 – x)KBMN-xKBT forms pure phase perovskite materials through the entire range of x with no impurities (Figure S15). Diffraction patterns at room temperature appear cubic when x < 1; however a Pawley fitting reveals subtle peak splitting of (111)c and (002)c reflections when x ≥ 0.7, indicative of lower symmetry. In (1 – y)PMN-yPT as y increases, the structure goes through two monoclinic phases: Cm (y = 0.10–0.32) and then to Pm (y = 0.32–0.40).5,11,12,21 These symmetries are commonly referred to as the MB (Cm) and MC (Pm) phases.5,11,12,21 Above y = 0.40 tetragonal (P4mm) symmetry is observed. A detailed single-phase and multiphase Pawley fitting of SXRD data using the fundamental parameter method with anisotropic strain terms was done to identify symmetries for x = 0.8 and 0.9 in (1 – x)KBMN-xKBT (Figures S16 and S17). Polar subgroups of Pm3m which arise from cation displacements were considered.63 These analyses show that the symmetry lowering observed cannot be explained by R3m or P4mm distortions alone; monoclinic symmetries must be employed to describe the profiles observed. The highest quality fit for x = 0.8 was found with Cm symmetry (Figure 5a and Figure S16) and with Pm symmetry for x = 0.9 (Figure 5b and Figure S17). Fitting with two low-symmetry phases improved the Rwp value but increased errors and did not improve the visual fit.
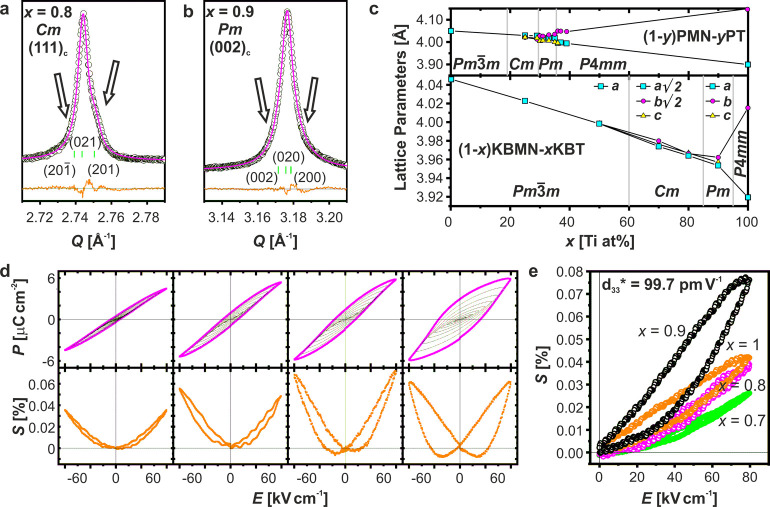
Structure and functional behavior of the (1-x)KBMN-xKBT solid solution at room temperature. Pawley fitting of SXRD data showing (a) the (111)c reflection for x = 0.8 in Cm symmetry and (b) the (002)c reflection for x = 0.9 in Pm symmetry. The observed diffraction data are shown as white circles, the fits are shown as magenta lines, the difference is shown as orange lines, and the hkl ticks are shown in green and labeled corresponding to their symmetry. Black arrows have been added to highlight subtle peak broadening that necessitates lower symmetry. (c) Lattice parameters for (1 – x)KBMN-xKBT as a function of Ti4+ substitution (x) with gray lines separating regions with Pm3m, Cm, Pm, and P4mm symmetry. Selected lattice parameters and regions of symmetry, taken from refs (11 and 12) for PMN-PT are shown above. All lattice parameters are presented relative to the cubic aristotype, and a, b, and c lattice parameters are shown as cyan, yellow, and magenta points, respectively. All lattice parameters are summarized in the Supporting Information. (d) Bipolar polarization and strain as a function of electric field, P(E) and S(E) respectively, for x = 0.7, 0.8, 0.9, 1.0. Lines through P/S = 0 and E = 0 are shown to illustrate the evolution of linearity in P(E) and negative strain in S(E). (e) Unipolar strain for the same four compositions with the extracted piezoelectric figure of merit for x = 0.9.
Refined parameters for all samples are given in Tables S11–S18. All data where x < 0.7 fit best in Pm3m symmetry. Lattice parameters for (1 – x)KBMN-xKBT (Figure 5c) validate the formation of a continuous solid solution and are consistent with previous reports.26 The evolution of symmetry seen is identical with that of PMN-PT, but at different quantities of Ti4+ substitution. The additional disorder created by (K1/2Bi1/2)2+ substitution is observed in all aspects of this system: as additional A-site displacements in the refined structure producing extra excess entropy in the heat capacity, a larger ΔTm, additional ΘD and ΘE functions, and the need for greater quantities of Ti4+ substitution to stabilize a ferroelectric ground state.
High-temperature ε′ and ε′′ values for samples with x > 0 can be seen in Figures S18–S23. These data show a Tm value which increases with x, from 413 K at x = 0 to 667 K in KBT. When x < 1, Tm is frequency dependent, consistent with relaxor behavior. ΔTm decreases with increasing x, showing a large decrease from 24 K for x = 0.8 to 6 K for x = 0.9. In PMN-PT when y = 0.32–1, Tm is not frequency dependent, and in pure PMN ΔTm is 18 K; therefore in (1 – x)KBMN-xKBT when x ≤ 0.8 there is a larger ΔTm in comparison to that at any PMN-PT composition.57,64 A Curie–Weiss fitting of dielectric data shows a crossover from negative, antiferroelectric θW values to positive, ferroelectric θW values for x ≥ 0.5. The negative θW is consistent with the observed diffuse scattering in SAED data for KBMN and furthers the connection with PMN-PT, where the suppression of disordered antiferroelectric correlations has been associated with the improved piezoresponse.21 The divergence of the dielectric data from the Curie–Weiss law (the Burns temperature, TB) was also extracted. TB is believed to be the temperature at which dipoles disappear, but the change in TB with x closely follows Tm, indicating that it is likely more associated with the basic chemistry of the system than with dipoles.35 All parameters extracted from ε′ and ε′′ are given in Table S19.
Room-temperature polarization (P(E)) and strain (S(E)) as a function of electric field (Figure 5d and Figures S24–S28) measurements confirm that when x ≥ 0.7 materials have ferroelectric (FE) properties. Hysteresis is observed in P(E) loops, and the linearity of loops increases with increasing applied field, indicative of FE domain wall motion.61,65 A current spike appears at about 40 kV cm–1 and reveals the coercive field (Figures S24c–S28c), a direct observation of FE switching. P(E) loops transition from a slim but not linear shape, characteristic of RFEs, to a classic FE shape with appreciable hysteresis.15,66S(E) also shows a progression from RFE to FE. A “sprout”-shaped loop with no negative strain component is seen for x = 0.7, 0.8 characteristic of RFEs. Negative strain is observed at x = 0.9, and KBT has a classic FE butterfly shape. The highest strain response in both bipolar and unipolar (Figure 5e) measurements is for x = 0.9, which has the same Pm symmetry as the MPB composition in PMN-PT (y = 0.32). The piezoelectric charge constant (d33) at x = 0.9, taken from unipolar strain loops (d33*), shows a modest d33* = 99.8 pm V–1, which is almost double that of x = 0.8, 1. In PMN-PT, the d33 values of polycrystalline samples are enhanced from y = 0.28 to y = 0.45, and the best properties (720 pm V–1) are found in a narrow range within 2% of y = 0.345.7 These measurements show the potential for similar property enhancement near the MPB in KBMN-KBT, with composition optimization over a narrower x range and targeted substitution coupled with single-crystal growth targets for further research. A greater than expected enhancement of piezoresponse is seen in PMN-PT on going from ceramics to single crystals. Whether this enhancement is seen in KBMN-KBT should also be explored, as it may reveal the mechanistic differences between these materials. There are other figures of merit such as the piezoelectric voltage constant (g33), which is relevant for sensor and energy-harvesting applications.67 The largest piezoelectric voltage constant is also at x = 0.9, where g33 = 17.5 × 10⁻³ V mN–1. This g33 makes the performance of KBMN-KBT better than those of KBT-NBT and BaTiO3 (10.4 × 10⁻³ and 12.6 × 10⁻³ V mN–1, respectively) and is competitive with optimized PZT and PMN-PT ceramics (19.7 × 10⁻³ and 21 × 10–3 V mN–1, respectively),68−70 without further composition optimization of KBMN-KBT.
From these data we construct the KBMN-KBT phase diagram in Figure 6. The phase boundary temperatures have been determined by Tm at 1 MHz, but from our analysis of KBMN it is clear that Tm does not correspond to a structural phase transition but instead to a dipole response. These Tm values are consistent with previous reports.26 Of note is that the peak in ε′ for x = 0.9 is at 631 K, which is close to that for PZT (653 K) and higher than the melting point of electrical solder (450–460 K), allowing these materials to be poled prior to device fabrication, a shortcoming of PMN-PT (y = 0.32, 430 K), which prevents its wide use in devices.4,5,11,12 On comparison of the electromechanical response to the phase diagram, there is a clear peak in response at x = 0.9. This region is identified as having Pm symmetry. The MPB in PMN-PT is on the Pm side of the interface between Pm and Cm symmetry, and at this point there is a suppression of the relaxor properties.12 In KBMN-KBT, the degree of dielectric relaxation (ΔTm) shows a marked decrease at x = 0.9, indicating a similar suppression of relaxor behavior in favor of FE properties. The suppression of relaxor properties is a key distinction of the physics at the MPB in PMN-PT from that of PZT, which is an interface between two FE phases. Finally, the observation of antiferroelectric ordering in dielectric data and its suppression with increased Ti4+ substitution is consistent with PMN-PT.21 Diffuse scattering observed in PMN and PMN-PT single crystals reveals these local antiferroelectric correlations, the suppression of which has been associated with improved piezoresponse.21 The effect of these intermediate-length-scale interactions needs to be better understood, as their signatures are clearly important in both PMN-PT and KBMN-KBT.
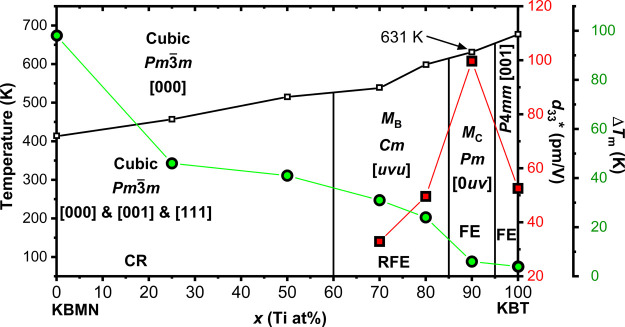
Phase diagram for (1 – x)(K1/2Bi1/2)(Mg1/3Nb2/3)O3-x(K1/2Bi1/2)TiO3. Phase boundary temperatures are Tm values taken from ε′ measurements at 1 MHz, shown as white squares. The compositional phase boundaries were estimated both from a Pawley fitting of XRD data and from the onset of ferroelectric properties. The symmetry of each region is labeled, with monoclinic regions referred to by MB (Cm), and MC (Pm) nomenclature. The polarization directions and regions with CR, RFE, and FE properties are also labeled. The piezoelectric figures of merit (d33*) extracted from unipolar S(E) measurements are shown as red squares. The relaxor characters (ΔTm) taken from dielectric measurements are shown as green circles. The symmetries observed, the suppression of the relaxor character, and the increase in the piezoresponse indicate the same type of MPB seen in PMN-PT.
With the analogy between KBMN-KBT and PMN-PT established, some differences and opportunities should be discussed. To access the best performance in PMN-PT, single crystals must be used, and these high-performance single crystals are reported to have rhombohedral symmetry.22 The best-performing composition in these single crystals is at y = 0.28. The best-performing ceramics have been reported at y = 0.345.7 The discrepancies in structural assignments and optimal physical response underpins the complexity of these relaxor-based systems and the importance of the sample state. The underlying physics in PMN-PT as well as PZT is believed to be related to a rotating polarization vector. In both of these models, the properties of experimental samples are optimized when going from a rhombohedral (R[111]) to a tetragonal (T[001]) phase, allowing the full arc of the polarization. The MA, MB, and MC phases represent paths between these R[111] and T[001] phases. Whether the presence of the M phases exists homogeneously though the sample is the result of a vector sum between coexisting R[111], T[001], or orthorhombic (O[011]) phases;18 interfacial anomalies due to twinned nanodomains71 is an ongoing debate as to how to appropriately model the complexities of these materials. Regardless, these M phases represent intermediate, and perhaps metastable, phases between R[111] and T[111] phases and therefore facilitate polarization rotation by reducing the activation energy of this change.
Conclusions
KBMN is a canonical relaxor. The two A-site cations in KBMN that replace the single Pb2+ in PMN have distinct structural roles which arise from their different electronic configurations. Spherical s0 K+ is located symmetrically at the center of the A-site and inhibits octahedral rotations, while the polarizable s2 Bi3+ undergoes locally polar displacements along two directions to generate lower symmetry environments consistent with the bonding at Bi3+ in pure Bi A-site perovskites. The underlying physics is thus not that of PMN, with a single cation producing a single degree of freedom through displacements of a compositionally homogeneous A-site. In KBMN, there are two A-site cations, one of which is active and executes two distinct displacements that relax involving two degrees of freedom, while the second cation remains locally undistorted, increases heterogeneity in the system, and prevents octahedral rotations. The greater diversity of local environments in KBMN is identified by diffraction, dielectric, and heat capacity analyses and can now be used to control the functional response with substitution approaches that will need to differ from those in Pb-based systems because of the distinct chemistry if they are to fully exploit that difference. The identification of a Pb-free CR with its analogies to and differences from PMN presents opportunities for material discovery, optimization, and understanding of the complex physics driving relaxor phenomena. The identification of one A-site with two cations and three environments also presents opportunities for inorganic solid-state materials design beyond dielectric and piezoelectric materials. KBMN enables the formation of a Pb-free analogue of the PMN-PT piezoelectric family through a solid solution with a ferroelectric with the same polarization direction as PbTiO3. Although the phenomenology is identical (symmetries at and suppression of relaxation mechanisms near the MPB, presence of antiferroelectric correlations) the quantitative behavior is not, as the extent of relaxation and number of degrees of freedom are greater in KBMN. This difference in physics can be traced to the distinct chemistry produced by the substitution that affords KBMN, driven by the heterogeneity of dipolar displacements on the A-site, which are components of the chemical heterogeneity that yield three locally different A-site environments because of the simultaneous presence of s2 and s0 cations. The CR-FE canonical relaxor–ferroelectric MPB strategy for Pb-free piezoelectrics is complementary to the well-studied FE-FE (or AFE-FE) PZT-based approach and may benefit from the diversity of A-site displacements that could be used to generate relaxors tuned to match an accessible FE polarization direction. The control of local A-site chemistry by the electronic configuration in perovskites offers a distinct route to Pb-free piezoelectrics through relaxor formation.
Supporting Information Available
The Supporting Information is available free of charge at https://pubs.acs.org/doi/10.1021/jacs.0c10572.
Notes
The authors declare no competing financial interest.
Acknowledgments
We thank the EPSRC (EP/R011753 and EP/R010293) for funding this research. J.G. and Q.D.G. acknowledge support through EP/N004884. We thank the STFC for access to Polaris (Xpress proposal 1890309) and Dr. Ron Smith for collecting the data and performing absorption corrections. We thank Argonne National Laboratory for access to the 11BM beamline (Rapid Access proposal 65125) and to Dr. Saul Lapidus and Dr. Lynn Ribaud for collecting the data.