
In the search for high energy density cathodes for next-generation lithium-ion batteries, the disordered rocksalt oxyfluorides are receiving significant attention due to their high capacity and lower voltage hysteresis compared with ordered Li-rich layered compounds. However, a deep understanding of these phenomena and their redox chemistry remains incomplete. Using the archetypal oxyfluoride, Li2MnO2F, we show that the oxygen redox process in such materials involves the formation of molecular O2 trapped in the bulk structure of the charged cathode, which is reduced on discharge. The molecular O2 is trapped rigidly within vacancy clusters and exhibits minimal mobility unlike free gaseous O2, making it more characteristic of a solid-like environment. The Mn redox process occurs between octahedral Mn3+ and Mn4+ with no evidence of tetrahedral Mn5+ or Mn7+. We furthermore derive the relationship between local coordination environment and redox potential; this gives rise to the observed overlap in Mn and O redox couples and reveals that the onset potential of oxide ion oxidation is determined by the degree of ionicity around oxygen, which extends models based on linear Li–O–Li configurations. This study advances our fundamental understanding of redox mechanisms in disordered rocksalt oxyfluorides, highlighting their promise as high capacity cathodes.
Advances in high energy density cathodes are crucial for the development of next-generation lithium-ion batteries for portable electronics and electric vehicles. Lithium-rich cathode materials are attracting considerable attention as they offer increased capacities by invoking redox chemistry on both the transition metal and oxide ions,1−26 rather than on only the transition metal as found in traditional oxide-based intercalation compounds.
Recently, there has been growing interest in disordered Li-rich intercalation materials, especially disordered rocksalt structures,27−52 including early work on systems based on Li3NbO4 and Li2VO2F [refs27−29]. House et al.36 presented for the first time an all-manganese oxyfluoride, Li1.9Mn0.95O2.05F0.95, with a disordered rocksalt structure, which exhibits a large capacity utilizing both Mn and O redox. This Li2MnO2F-based cathode has a discharge capacity of ∼280 mA h g–1 (corresponding to 960 W h kg–1) after the initial charge, making it comparable to Li-rich layered oxides such as Li1.2Ni0.13Mn0.54Co0.13O2 and greater than conventional cathodes such as LiCoO2 (170 mA h g–1) and NMC-Li(Ni,Mn,Co)O2 (200–220 mA h g–1). Cathodes comprised of manganese (rather than cobalt or nickel) are also attractive due to its low cost, low toxicity, and high natural abundance.
Layered Li-rich cathode materials commonly undergo extensive structural rearrangement during the first charge/discharge cycle leading to a large voltage hysteresis and O2 gas evolution at the surface; this involves a substantial loss of voltage and therefore energy density. In contrast, the disordered rocksalt Li2MnO2F does not exhibit such large first cycle voltage hysteresis (shown in Figure 1) and also shows minimal oxygen loss, which are major advantages of this system. These differences raise the important question: to what extent does the transition metal and oxygen redox chemistry in the ordered Li-rich layered compounds translate to disordered rocksalt systems?

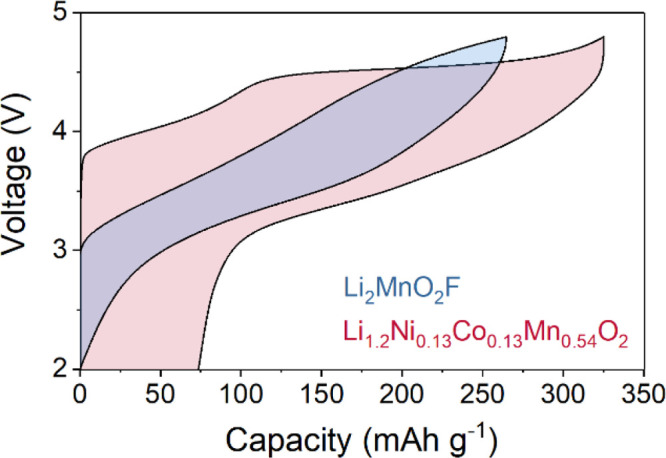
Charge–discharge curves. Representative first cycle load curves for disordered rocksalt Li2MnO2F (blue) and layered Li1.2Ni0.13Co0.13Mn0.54O2 (red) at a current rate of 20 mA g–1. (Second cycle data are presented in Supporting Information, Figure S1).
In this work, combined operando X-ray absorption spectroscopy (XAS), high resolution resonant inelastic X-ray scattering (RIXS), and ab initio modeling techniques are used to elucidate and quantify the Mn and O redox chemistry as well as local structural changes upon delithiation. We show, for the first time, by experimental methods (O K-edge RIXS) and ab initio modeling that Li removal from the rocksalt oxyfluoride is accompanied by the formation of molecular O2 trapped inside the cathode particles. Ab initio molecular dynamics simulations show that the trapped O2 exhibits substantially reduced freedom of mobility, making it more characteristic of a solid-like environment in line with recent solid state 17O NMR measurements for O2 in the layered cathode Li1.2Ni0.13Mn0.54Co0.13O2 [ref (26)]. Previously the significance of the Li+–O−Li+ configurations in Li-rich oxides in pinning O 2p states at the top of the oxygen valence band and hence accessible for O-redox has been emphasized.11 Here, we show that the onset potential of oxygen oxidation varies with the number of coordinating Li+ ions and that, along with the strong modulation of Mn redox potential by its O/F anionic coordination environment, leads to overlap of the Mn and the O redox processes, i.e., transition metal and oxygen redox occur together in the disordered rocksalts.
Li2MnO2F was prepared by mechanochemical ball-milling, and the oxidation state of Mn was subsequently confirmed as +3.00(5) from iodometric titration. Li2MnO2F possesses a cubic rock-salt structure where each cation (Li+ or Mn3+) is octahedrally coordinated to six anions (O2– or F–) and vice versa (illustrated in Figure 2). To investigate the possibility of local ordering, Mn K-edge extended X-ray absorption fine structure (EXAFS) and neutron pair distribution function (PDF) analysis were performed on pristine Li2MnO2F (the experimental methods are detailed in the Supporting Information (SI), Section S1).
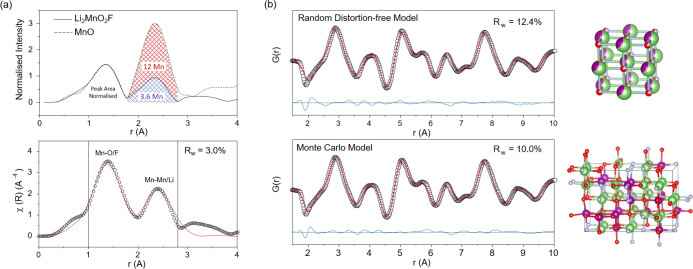
Structure of Li2MnO2F. (a) Mn K-edge EXAFS for pristine Li2MnO2F compared with a MnO reference, each with cubic rocksalt crystal structure. The spectra are normalized to the area under the first peak corresponding to the occupancy of the first nearest neighbor anion site which is the same for both, 6. A good fit of the EXAFS data can also be obtained with a rocksalt model with 4 × 2nd nearest neighbor Mn. (b) Neutron PDF data fitted to structural models of distortion-free random cubic rocksalt and the Monte Carlo derived model for pristine Li2MnO2F. Li, Mn, O, and F atoms are indicated by green, purple, red, and gray spheres, respectively. There is very good agreement between the models and the PDF data showing Li2MnO2F exhibits a close to completely disordered rocksalt structure. The slight asymmetry of the first peak at around 1.9 Å may indicate some element-specific preference for shorter bond length. Refined cell parameters a = 4.117 Å and a = 12.152 Å, b = c = 8.336 Å, and Uiso values 0.027 and 0.014, respectively.
The EXAFS technique is an element-specific probe of local coordination environment, in this case around Mn, giving a plot of the nearest-neighbor (NN) atoms as a function of distance from the central atom. As shown in Figure 2a, the first two peaks in the EXAFS spectrum for Li2MnO2F are a close match in shape and relative position to that of MnO, which has a well-defined cubic rocksalt structure. These peaks correspond to the first and second NN shells of atoms, anions and cations, respectively. Normalizing each spectrum by the first peak area, since O2– and F– are indistinguishable with EXAFS, permits direct comparison of the second peak area. Here, Mn is a much stronger scatterer of the photoelectron wave than Li, which is a very weak scatterer, so Mn dominates the second peak intensity. The difference in peak area between the two materials indicates a much lower amount of second NN Mn for Li2MnO2F than MnO, consistent with the presence of Li on the cation sites in the former. Measuring the peak intensity relative to a baseline of zero scattering from 12 Li and maximum scattering from 12 Mn (as in MnO), shows an average of 3.6 Mn as second NN for Li2MnO2F. This is in line with that expected from a completely random distribution of Li and Mn in a 2:1 ratio, i.e., four Mn. As further confirmation, a good fit was obtained of the EXAFS data using a rocksalt structure with six degenerate first NN O and four degenerate second NN Mn atoms, Figure 2a and Table S1.
PDF is another powerful tool for probing local structure, giving a superposed plot of all atom–atom pairs throughout the structure resolved as a function of increasing separation. Unlike EXAFS, neutron PDF can probe over much longer correlation lengths and is much more sensitive to Li, since neutrons are more strongly scattered by Li than X-rays. The fitted PDF data (Figure 2b), show that the local structure of Li2MnO2F can be well-described by a disordered rocksalt model indicating minimal short-range order. Together with the EXAFS data, the experimental evidence supports a close to completely disordered rocksalt structure for Li2MnO2F.
To obtain a computationally tractable structural model for Li2MnO2F capturing this disorder, a Monte Carlo random sampling approach was employed to generate a 3 × 2 × 2 unit cell which possessed a representative distribution of different sites (computational methods applied to battery cathode materials are well established9,11,53,54 and detailed in the SI, Section S1). The validity of this Monte Carlo-derived model was checked by fitting to the neutron PDF data. The quality of the fit was even better than the distortion-free one showing it is a closer match to the experimentally observed structure. Furthermore, the calculated mean lattice parameter, 4.146 Å, compare well with the experimental value (a = b = c = 4.118 Å) from X-ray diffraction studies.36 Our ab initio simulations confirm that the disordered rocksalt structure of Li2MnO2F does not exhibit the cooperative Jahn–Teller distortion usually associated with Mn3+ in ordered structures, which often leads to poor cycling. The full structural data set for the pristine Li2MnO2F computational model is given in the SI, section S2.
To investigate the redox processes occurring over the first cycle in Li2MnO2F, operando Mn K-edge XANES was performed. Operando experiments allow the intercalation reaction in the cathode to be followed under operating conditions, eliminating the effect of any relaxation phenomena. As shown in Figure 3, a continuous shift in the Mn K-edge is observed during charge and discharge in line with the expected oxidation and reduction from Mn3+ toward Mn4+. Near the top of charge, around x ≈ 1.2 in LixMnO2F, the changes become less pronounced as oxygen oxidation starts to dominate the redox process; this corresponds to a slight inflection in the electrochemical load curve. Note that previous operando electrochemical mass spectrometry studies36 indicate that there is negligible oxygen loss. Given that the edge continues to evolve and the voltage profile remains sloped throughout this region (Figure 1), there must be a significant degree of overlap between the Mn and O redox couples. Close analysis of the Mn K-edge pre-edge (Figure 3d), which is generally considered to be a better measure of oxidation state than the main edge,55 reveals a similar trend.
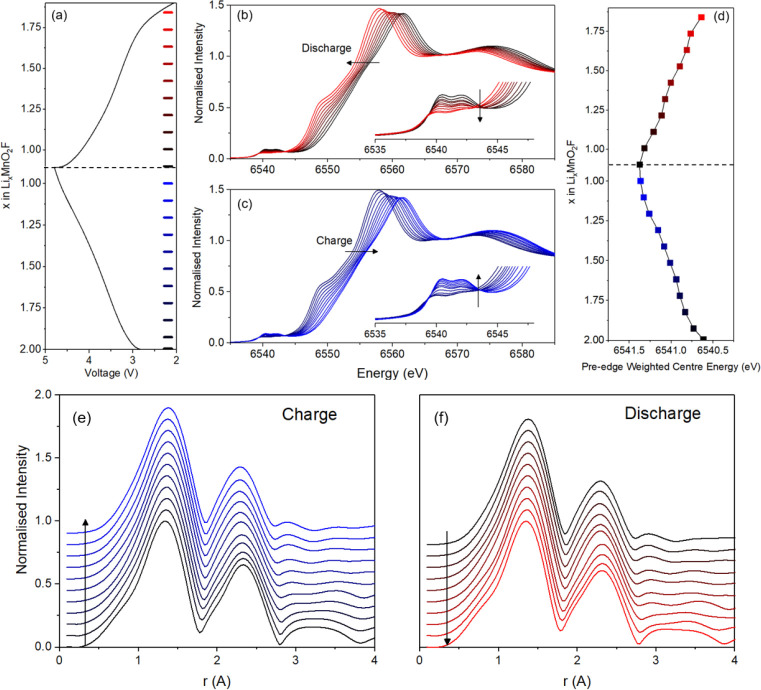
Operando Mn K-edge XANES and EXAFS on Li2MnO2F. (a) Load curve for the cell charged at a rate of 50 mA g–1 between voltage limits of 2 and 4.8 V vs Li+/Li. The XANES spectra (b) and (c) show a continuous shift in edge energy as Mn is oxidized which slows toward the top of charge as O oxidation starts to dominate. There is no substantial increase in pre-edge intensity (inset) which would be expected from tetrahedral Mn5+ or Mn7+. The very slight increase that is observed is characteristic of slight distortions to the octahedra which allows mixing between the Mn 3d and 4p states. (d) Variation in energy of the weighted center of the pre-edge. (e) and (f) EXAFS data for charge and discharge, respectively. The shape of the first two EXAFS peaks showing the octahedral geometry is maintained throughout the first cycle.
The pre-edge shape (insets of Figure 3b,c) does not appear to change much, but there is evidence of a slight increase and decrease in intensity of the twin peaks. These peaks arise from the quadrupole-allowed transition from the Mn 1s to the Mn 3d states, which are subdivided by crystal field splitting, and are weak due to the centro-symmetry of octahedral coordination. The intensity gain can be attributed to a slight distortion of this centro-symmetry allowing mixing between the Mn 3d and 4p states. In contrast, pre-edge features for tetrahedral geometries tend to be of significantly larger intensity, often of comparable height to the main edge, due to the complete lack of centro-symmetry.56 The absence of a substantial increase in pre-edge intensity here means that the presence of Mn5+ or Mn7+, each of which are only known to occupy tetrahedral coordination environments, can be ruled out in Li2MnO2F. It has been recently suggested that tetrahedral Mn7+ forms as an intermediate state in Li-rich manganese oxides before O–O dimerization.57 Our operando data, which should capture intermediate species formed during battery operation, does not suggest this is the case here for Li2MnO2F. Using X-ray spectroscopy techniques, Rana et al.58 also rule out oxidation beyond Mn4+ in Li-rich Mn-oxides.
Interestingly, recent reports for the vanadium-based disordered rocksalt systems, Li1.25Nb0.25V0.5O234 and Li2VO2F,59,60 show XANES data indicating a strong increase in pre-edge intensity, characteristic of vanadium in a noncentrosymmetric coordination environment such as tetrahedral V5+. Baur et al.47 recently confirmed the presence of tetrahedral vanadium by PDF in Li2VO2F, and Chang et al.48 report superoxide formation in this oxyfluoride from computational and EPR studies. We note that Lun et al.41 studied the Li–Mn–O−F chemical space to derive a capacity map of Li percolation and redox properties. In the context of Li-rich oxide structures, Hong et al.19 report that oxygen redox may be stabilized in the local coordination environments created through cation vacancies, and Gent et al.25 find that the defect formation energy landscape is a key factor controlling the electrochemical reversibility of high valent redox. Our previous simulation study9 on Li-rich layered Li2MnO3 suggests that delithiation leads to oxygen dimerization and eventually to the formation of molecular O2.
To further probe the changes in local environment around the Mn during the first cycle, the Mn K-edge EXAFS were analyzed. As shown in Figure 3e,f, the first and second neighbor atoms to Mn do not change as a function of state of charge. This clearly shows Mn remains octahedrally coordinated throughout the charge/discharge cycle, with no evidence of tetrahedral Mn.
To complement our XANES and EXAFS work, we used DFT methods to examine local structures and to quantify the redox chemistry on lithium extraction from LixMnO2F. As in previous studies,9,11 we stress that high level hybrid functionals were employed as they are found to be important in reproducing accurately the electronic structure of oxygen states (further details in the SI, S1 Methods). Figure 4a illustrates the overall contribution of Mn vs O redox as a function of Li content in LixMnO2F derived from the ab initio calculations (Figure S2 shows the change in the average oxidation states of all the component elements of LixMnO2F as Li is removed).
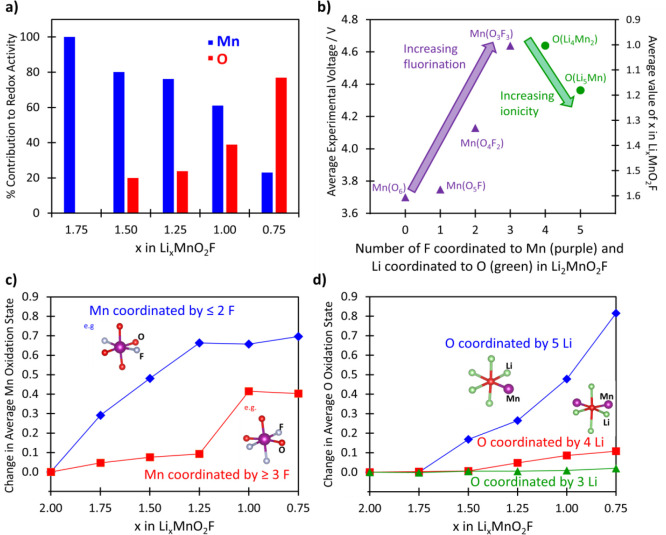
Manganese/oxygen redox activity and impact of local coordination environments in LixMnO2F. (a) Relative contribution (%) of the Mn versus O redox processes to the overall redox activity at a given Li content (x). The data show significant overlap between Mn and O redox couples. (b) Oxidation potentials of Mn and O as a function of their coordination environment in Li2MnO2F; here, the Li content (x) is related to the experimentally measured voltage at that state of charge derived from Figure 1. OLi3Mn3 is omitted for clarity as these O atoms did not show significant oxidation during Li extraction. (c) Change in the average oxidation state of octahedral Mn atoms in Li2MnO2F that are coordinated by three or more F atoms and those that are coordinated by fewer than three F atoms. (d) Change in the average oxidation state of O atoms with coordination environment in Li2MnO2F.
The results clearly show significant overlap between Mn and O redox couples with O redox activity starting from about x ≈ 1.5, well before all of the Mn has been oxidized and in accord with the XANES results; this is attributed to the disordered structure with a range of local ion environments (which we return to below). This behavior contrasts with the redox activity found in layered Li-rich ordered oxides in which there is no significant overlap between Mn and O states.11,14,45 The projected density of states for LixMnO2F (x = 2.0, 1.5, 0.75) (Figure 5) also show the strong hybridization between the Mn 3d and O 2p states, with the energy of the O-2p states raised in the charged systems, which promotes O redox activity.
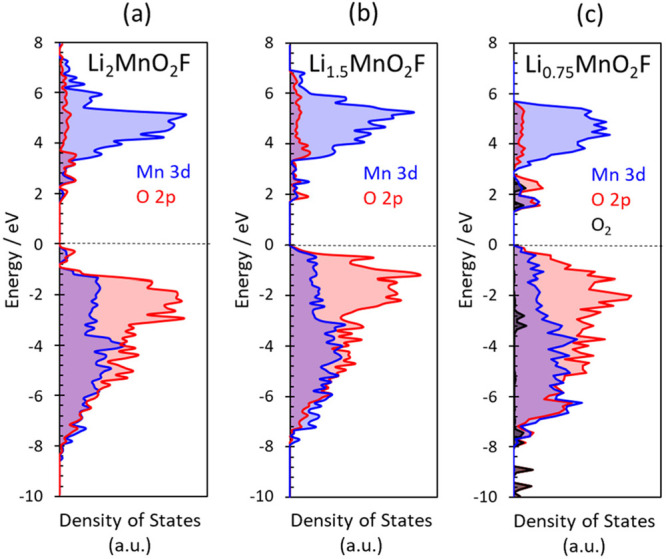
Projected density of states (pDOS) for LixMnO2F. (a) Li2MnO2F, (b) Li1.5MnO2F, and (c) Li0.75MnO2F. The blue and red lines correspond to the Mn 3d and O 2p pDOS, respectively. For the charged structure, Li0.75MnO2F, the black bands represent the electron holes localized on molecular O2. With respect to Li2MnO2F, the occupied states close to the Fermi level (which is set to zero) are composed of a mix of O 2p and Mn 3d states. For the charged structures, the energy of the O-2p states are raised, which promotes O redox activity.
Regarding charge compensation on Li extraction, Mn undergoes oxidation from Mn3+ at x = 2.0 toward Mn4+ at x = 0.75, with no evidence of any change from octahedral to tetrahedral coordination. Our DFT structural analysis also indicate that tetrahedral Mn5+ is not formed during delithiation of LixMnO2F, which agrees with the operando Mn K-edge XANES and EXAFS results. As expected, the oxidation states of Li and F do not change on delithiation. When considering the overall Li deintercalation process (x = 2.00 to 0.75 in Figure 4a), Mn redox activity accounts for approximately 75% of the total capacity, while O redox accounts for the remaining 25%.
To gain an atomistic understanding of the overlapping nature of Mn and O redox, the local coordination environment of each atom was investigated as a function of lithium content (x). Figure 4b shows the oxidation potentials of Mn and O as a function of their coordination environment in Li2MnO2F; the value of x for LixMnO2F in the plot is related to the experimentally measured voltage at that state of charge (from Figure 1). Figure 4c compares the calculated change in the average oxidation state of Mn atoms that are initially coordinated by three or more F atoms with those that are coordinated by fewer than three F atoms. Figure 4d compares the change in the average oxidation state of O atoms with their coordination environments.
At a given Li content, Figure 4c indicates that Mn atoms with low coordination to F (e.g., Mn(O4F2)) are more oxidized than those Mn atoms coordinated to three or more F atoms (e.g., Mn(O3F3)) and helps to explain why O redox is predicted before all the Mn are oxidized. In other words, the redox potential of the Mn3+/4+ couple is raised by an increasing number of F in its coordination shell, shown in Figure 4b. These results suggest that the substitution of O by F leads to greater Mn redox overlap with oxygen.
With respect to the O environments, Figure 4d shows greater oxidation for O atoms with five Li nearest-neighbors (O(Li5Mn)) at the fully lithiated state than those with four or three Li ions. This trend is consistent with that found by Seo et al.,11 who showed that the anion redox chemistry in a variety of Li-intercalation oxide cathodes, including LiNiO2 and Li2MnO3, is dependent on the anion nearest-neighbor coordination environment. They focused on how the presence of linear Li–O–Li configurations promote labile oxygen electrons in the adjoining 2p orbital that effectively pin them at a set energy above the bonding electrons. With the extension of this model, our results show a more continuous variation in the O-redox potential dependent on the number of Li coordinated to a given O2– ion. We note that recent computational screening work on layered oxide cathodes61 report trends in O-redox activity associated with the electrostatic (Madelung) energy at oxygen sites. In general, our findings indicate that a greater number of coordinating Li can promote O oxidation at a lower potential (as shown in Figure 4b). This highlights the more general role of ionicity of the coordination environment around O in tuning its oxidation potential.
In summary, the effect of the local coordination environment has a major effect on the redox potentials of both Mn and O leading to increased competition between the Mn and O redox couples across the voltage range. The results presented here indicate that the O–Li environments in Li2MnO2F encourage O oxidation at lower potentials than the typically observed 4.6 V plateaus for layered Li-rich oxide materials. Meanwhile, the presence of Mn–F bonds increases the voltage of Mn oxidation, leading to increased overlap between Mn and O redox processes.
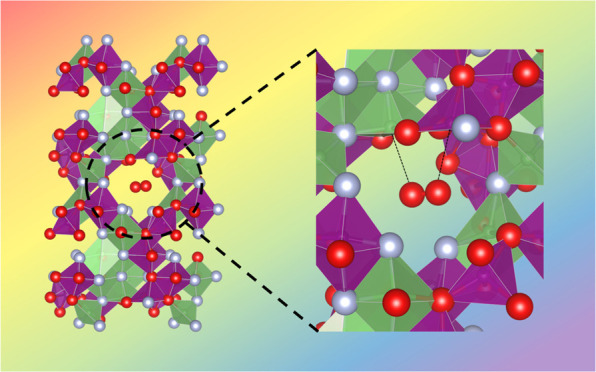
Detailed analysis of the ab initio simulated structures of LixMnO2F on Li removal indicate that the possibility of dimerization of oxidized O species is heavily dependent upon the local environment. At high degrees of Li deintercalation (high states of charge) corresponding to the Li-deficient composition Li0.75MnO2F, some of the oxygen ions will be undercoordinated (fewer than three cations). The calculations indicate that such undercoordination results in molecular O2 formation in the bulk structure (shown in Figure 6a); for this delithiated composition Li0.75MnO2F, when the cations are arranged in such a way that the cation vacancies are clustered together, O2 molecules form during energy minimization to give a structure with a significantly lower total energy (>320 meV/formula unit) than other configurations. Hence, bulk O2 formation is triggered by driving the oxyfluoride electrode to high degrees of Li deintercalation, such that the local coordination around oxidized O ions is reduced to below three with local Li vacancies, e.g., OMn2□4. For instances where the oxidized O species are bonded to three or more cations, dimerization does not occur and the O–O separation remains at 2.3–2.8 Å.
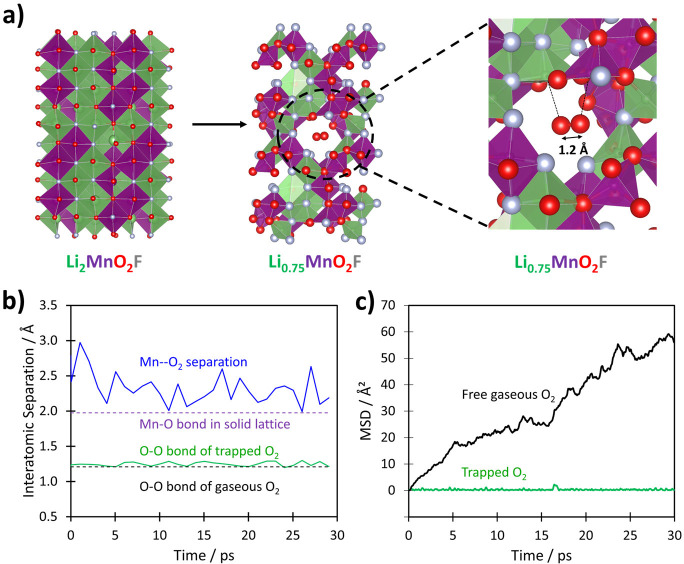
Structures and dynamics of molecular O2 trapped in the bulk. (a) Calculated structures of Li2MnO2F and Li0.75MnO2F, and the local environment of molecular O2 in the bulk of Li0.75MnO2F. Li, Mn, O and F are indicated by green, purple, red, and gray, respectively. The weak Mn–O2 and Li–O2 interactions are indicated with dotted lines. (b) Ab initio molecular dynamics simulations of the molecular O2 in the bulk cavity at 300 K showing the variation in O–O and Mn–O separations vs simulation time. The calculated O–O distances of the trapped molecular O2, and the nearest-neighbor Mn–O2 distances are shown in green and blue, respectively (derived at intervals of 1 ps). (c) Mean square displacements (MSDs) vs simulation time for molecular O2 in the bulk cavity in comparison with free gaseous O2 molecules in a very similar nanosized volume.
The formation of molecular O2 inside the particles is only possible due to the loss of lithium ions at high states of Li deintercalation to create vacancy clusters that accommodate the O2 molecules. From local analysis of the simulated relaxed structure of Li0.75MnO2F, the diameter of the vacancy cluster is approximately 6.5 Å. The undercoordination of oxygen results in O 2p orbitals that no longer interact with any cations, and are at a high energy (shown in the pDOS plots, Figure 5c), which are where the oxygen holes are concentrated. Such undercoordinated oxygen will be unstable in the lattice and leads to molecular O2 formation; this accords with our previous suggestions that undercoordinated oxygen more easily form O–O species,23 and now shown explicitly in disordered rocksalt oxyfluorides.
Figure 6a illustrates the local environment of the O2 molecule with a calculated O–O bond length of 1.23 Å, directly comparable to that of molecular O2, 1.21 Å, and in accord with RIXS results (Figure 7a) discussed in detail below. Analysis of the calculated charge density of O2 within this cavity (Figure S4) indicate the electron density is heavily localized on the O2 molecule as expected from the strong, covalent O=O bonding, with only weak chemical interaction with its neighboring environment. Once O2 is formed, some Mn octahedra around the vacancy cluster may experience greater distortion to accommodate the defect. However, the amount of O2 that is expected to form is small (around 5% of all the oxide ions). Hence, the impact on the distortion to Mn octahedra overall is likely to be limited, consistent with the slight increase in the pre-edge intensity of the Mn K-edge on charge.
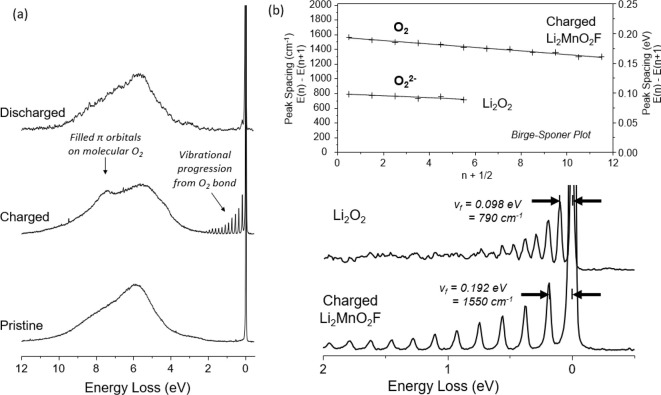
High resolution RIXS data showing molecular O2 trapped in the bulk. (a) Ex situ high resolution O K-edge RIXS data collected at 531 eV excitation energy showing the presence of molecular O2 trapped in the bulk of the charged cathode particles (Li0.8MnO2F), which is reversibly reduced back to O2– on discharge. Both spectral features labeled are also observed in a reference spectrum of pure molecular O2.63 (b) The peak spacing of the vibrational progression decreases linearly with increasing energy loss (Birge–Sponer plot, upper panel) consistent with an anharmonically oscillating O2 diatomic. The initial peak spacing, equivalent to the fundamental vibration frequency (vf), is 0.192 eV (1550 cm–1) in charged Li2MnO2F corresponding closely to molecular O2 indicating negligible interaction with the cathode structure. A reference spectrum for Li2O2 is also included at 531 eV showing a fundamental vibrational frequency of 0.098 eV (790 cm–1) consistent with a peroxide O22– moiety.
In addition, ab initio molecular dynamics simulations of the trapped molecular O2 in the oxyfluoride structure were performed for the first time. We stress that our focus here was to probe the degree of oxygen mobility within the vacancy cluster, rather than long-range diffusion. The variation in O–O bond distance and Mn–O2 separation over the simulation time was analyzed (Figure 6b); we also examined oxygen mobility in the cavity through the mean square displacements (MSDs), which were directly compared with MSDs from simulations of free gaseous O2 molecules within a volume of the same size (Figure 6c).
Two key features emerge. First, the trapped O2 molecule has an O–O bond length that remains directly comparable to that of gaseous molecular O2 (1.21 Å) whereas the nearest-neighbor Mn–O2 distance (mean value of 2.33 Å) is always longer than the Mn–O bond (2.0 Å) in the solid lattice, again confirming weak O2 interactions with the host lattice. Even when the O2 molecule makes very close approach to its nearest-neighbor Mn atom, the O–O distance remains around 1.2 Å.
Second, the increase in the mean square displacement with time for free gaseous O2 (Figure 6c) clearly indicates significant molecular diffusion as expected, whereas this is not the case for the O2 in the solid particle. The results therefore indicate that while the O–O bond length might be similar between the two, the trapped molecular O2 is different from free, gaseous O2 in exhibiting substantially reduced freedom of mobility, making it more characteristic of a solid-like environment (Figure 6c); this result is in line with recent solid state 17O NMR measurements for O2 in Li1.2Ni0.13Mn0.54Co0.13O2.26 The rigid trapping of O2 within close proximity to cation centers in this cavity also helps to rationalize how it could be reduced to O2– with ease on discharge.
To probe experimentally the nature of oxidized oxygen in charged Li2MnO2F, O K-edge RIXS was performed at a higher resolution than previously achieved for this material.36 Previous RIXS data for charged electrodes revealed a more prominent elastic peak when exciting at ∼531 eV and a new energy loss feature, attributed to the formation of localized electron holes on oxygen. The new high-resolution data in Figure 7a show that the broad elastic peak can in fact be resolved into a progression of sharp peaks, as also observed for the layered O-redox material Li1.2Ni0.13Mn0.54Co0.13O226 This peak progression arises from the molecular vibrations of an O–O diatomic with well-defined frequency matching that of molecular O2 (1550 cm–1) and clearly distinguishable from superoxide O2– and peroxide O22– which have vibrational frequencies of around 1100 and 790 cm–1, respectively.62 The peak spacing decreases linearly with increasing energy loss (Birge–Sponer plot Figure 7b) consistent with an anharmonically oscillating diatomic. A reference RIXS spectrum for Li2O2 is also included showing a peak spacing consistent with peroxide O22– as expected, demonstrating the ability of RIXS to distinguish different O–O bond orders.
The other energy loss feature at 8 eV also belongs to molecular O2 and can be assigned to the filled π molecular orbitals. These results show that the localized electron hole states appearing at 531 eV reside on O2 molecules, which, since the RIXS experiment was performed under ultrahigh vacuum conditions, must be trapped within the bulk of the cathode as found from our ab initio simulations. The similarity of the peak spacing to that of gaseous molecular O2 suggests that there is minimal bonding interaction with the host lattice in agreement with the ab initio simulations, which would accord with the expectation for strong localization of electron density in the heavily hybridized O=O bond. However, as has been noted previously,64,65 the excitation energy at which these O-redox RIXS features appear is slightly higher relative to O2 in the gas phase by about 0.5 eV. This is consistent with the O2 molecules being trapped in a solid-like environment.
On discharge, the signal is no longer evident indicating that the O2 that formed in the fully charged samples is no longer present in the bulk material. The lack of O2 gas evolution at the surface during discharge from differential electrochemical mass spectrometry measurements36 which, coupled with the disappearance of the O2 signal from the RIXS data, indicates that the trapped O2 is reduced back to O2–. It is worth mentioning that O2– ions and molecular O2 are the most stable forms of oxygen.
To investigate the possibility of the RIXS features being beam-induced, we undertook low temperature measurements (20 K) to suppress sample heating by the beam. The data, Figure S5, show negligible difference between the spectra indicating no such effect. Taken together, the full outgassing of the electrode under UHV conditions and the reversible reduction of O2 rule out O2 being trapped anywhere other than in the particle bulk, where it can still be reversibly reincorporated back into the structure as O2–. Overall, the reversible O-redox process involves O2– being oxidized to form bulk molecular O2 on charge, followed by its reduction on discharge to reform O2–.
The observation of molecular O2 in layered O-redox cathode materials and here, for the first time, in disordered rocksalts, suggests the two systems share the same O-redox mechanism, (i.e., 2O2– ⇋ O2+ 4e–). However, Li2MnO2F does not exhibit the commonly observed O-redox charging plateau at 4.6 V vs Li+/Li, nor such large first cycle voltage hysteresis (Figure 1). Both phenomena have been recently linked with the irreversible loss of highly ordered honeycomb superstructures belonging to the layered cathodes. In Li1.2Ni0.13Mn0.54Co0.13O2,26 all oxide ions in the honeycomb lattice will be coordinated by at least two transition metal (TM) ions (O(Li4TM2)) which, during charge, are oxidized to On– at a high potential of 4.6 V. However, this honeycomb arrangement of On– is highly unstable. In-plane TM migration to form vacancy clusters occurs, causing some O to become coordinated by fewer than two TM ions which then dimerize to form stable O2 molecules. On discharge, these vacancy clusters are repopulated by Li leading to O(Li5TM) and O(Li6) configurations which remain in the structure explaining the lack of further voltage plateaus. In contrast, Li2MnO2F is already intrinsically disordered in the pristine state, possessing a range of coordination environments including some O(Li5Mn) and O(Li6) regions. Therefore, O− redox can occur without such severe structural rearrangement and hence less pronounced voltage hysteresis. After the first cycle, the load curves for both compounds (Figure S2) exhibit a similar degree of voltage hysteresis in line with the presence of preformed sites for O2 formation in both materials after disordering of the TM ions within the TM layer of Li1.2Co0.13Ni0.13Mn0.54O2.
Our observations on Li2MnO2F are unexpected in the context of previous work, which cannot be simply translated from ordered Li-rich layered compounds to disordered rocksalt oxyfluorides, and are important in future strategies to develop new high capacity cathodes.
The oxygen redox mechanism in the disordered rocksalt cathode, Li2MnO2F, involves the formation of molecular O2 trapped inside the bulk structure of the charged material, which is reversibly reduced to O2– on discharge. Combined RIXS and ab initio simulation studies show that molecular O2 is held within vacancy clusters in the structure. Bulk O2 formation is triggered by driving the disordered rocksalt oxyfluoride structure to high degrees of Li deintercalation, such that the local coordination number decreases around oxidized O ions with local Li vacancies. The trapped molecular O2 also exhibits minimal mobility unlike free gaseous O2, making it more characteristic of a solid-like environment. This rigid trapping of O2 within close proximity to cation centers also helps to rationalize how it could be reduced to O2– with ease on discharge.
The Mn redox process occurs between 3+ and 4+, with no evidence of tetrahedral Mn5+ or Mn7+. We show that the significant overlap between the Mn and O redox couples is determined by the different local coordination environments in the disordered oxyfluoride structure: more ionic Li-rich O environments (e.g., O(Li5Mn)) are oxidized at lower voltages than the typically observed 4.6 V plateaus for layered Li-rich oxides, whereas F-rich Mn coordination (e.g., Mn(F3O3)) increases the voltage for Mn oxidation, leading to the overlapping nature of the Mn and O redox processes.
Since Li2MnO2F already possesses an intrinsically disordered structure, it avoids the extensive structural rearrangement observed in layered honeycomb cathodes resulting in reduced voltage hysteresis on the first charge/discharge cycle. This work advances our understanding of fundamental redox mechanisms in Li-rich disordered rocksalts and highlights their promise as more structurally stable oxygen-redox cathodes.
The Supporting Information is available free of charge at https://pubs.acs.org/doi/10.1021/jacs.0c10270.
Experimental and computational methods, EXAFS fitting, Buckingham potentials, DFT-computed structural data, change in oxidation states and magnetic moments, charge density of the O2 and local environment, RIXS spectra collected at 20 and 300 K (Figures S1–S5 and Tables S1–S3) (PDF)
The authors declare no competing financial interest.
We thank the EPSRC (LiBatt programme grant EP/M0009521/1), the Faraday Institution CATMAT project (EP/S003053/1, FIRG016) and the Henry Royce Institute for financial support. We also thank the HEC Materials Chemistry Consortium (EP/R029431), the Isambard HPC (EP/P020224/1), and the Balena HPC service (Bath) for supercomputer facilities. We gratefully acknowledge Diamond Light Source/STFC beamtime allocation (SP20363, MM23889), and useful discussions with Dr Oriol Lamiel-Garcia (Bath) and Dr Kit McColl (Bath). M.J.C. thanks the CDT in Sustainable Chemical Technologies (EP/L016354/1) and CFH Docmail for his PhD studentship.
 Redox
Chemistry and the Role of Trapped Molecular
O2 in Li-Rich Disordered Rocksalt Oxyfluoride Cathodes
Redox
Chemistry and the Role of Trapped Molecular
O2 in Li-Rich Disordered Rocksalt Oxyfluoride Cathodes
 Facebook
 Twitter
 Linkedin
 Whatsapp
