
Pages 796–797. The graphics for Figures 5 and 6 are swapped in the published article. The correctly identified figures with their respective captions are shown here.

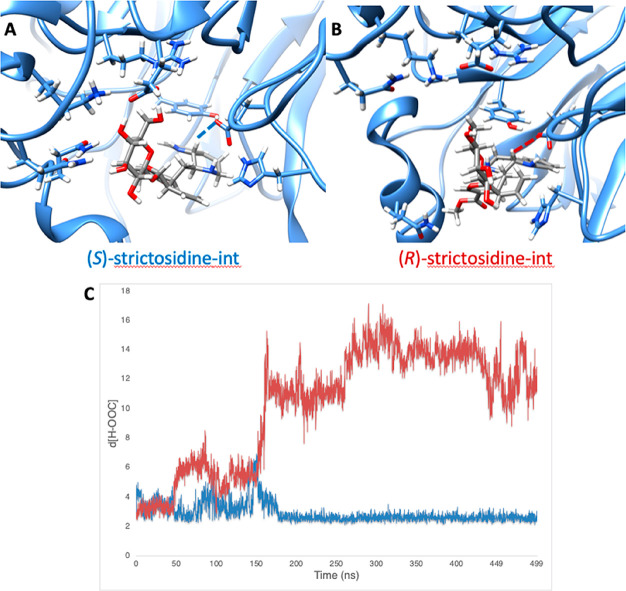
Results from MD simulation with (S)- and (R)-strictosidine-int. (A) Snapshot of MD trajectory of (S)-strictosidine-int. (B) Snapshot of MD trajectory of (R)-strictosidine-int. (C) Plot of hydrogen (of (R/S)-strictosidine-int) to oxygen (of glutamate) distances vs time in nanoseconds throughout the MD trajectory. The blue line represents the distance for (S)-strictosidine-int and the red line represents the distance for (R)-strictosidine-int.
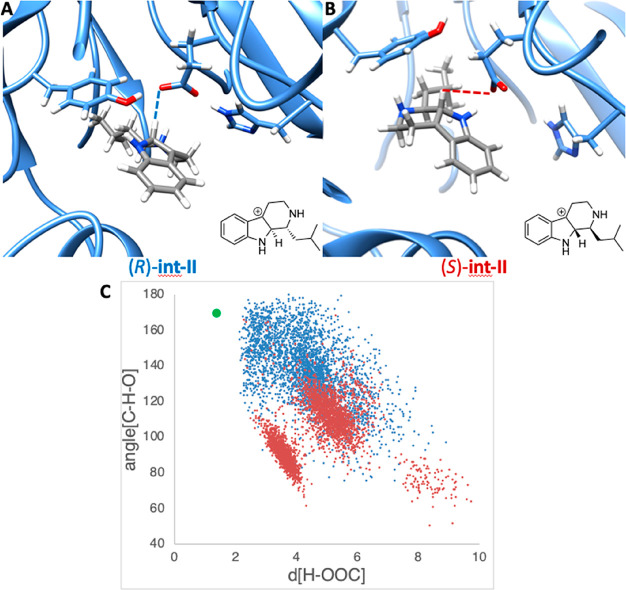
Results from MD simulation with (R)- and (S)-int-II. (A) Snapshot of MD trajectory of (R)-int-II. (B) Snapshot of MD trajectory of (S)-int-II. (C) Plot of hydrogen (of int-II) to oxygen (of glutamate) distances vs C–H–O angles throughout the MD trajectory, with the transition state geometry shown in green. The blue data points are results from the MD trajectory with (R)-int-II, and the red data points are results from the MD trajectory with (S)-int-II.
 Correction
to “Inverted Binding of Non-natural
Substrates in Strictosidine Synthase Leads to a Switch of Stereochemical
Outcome in Enzyme-Catalyzed Pictet–Spengler Reactions”
Correction
to “Inverted Binding of Non-natural
Substrates in Strictosidine Synthase Leads to a Switch of Stereochemical
Outcome in Enzyme-Catalyzed Pictet–Spengler Reactions”
 Facebook
 Twitter
 Linkedin
 Whatsapp
