
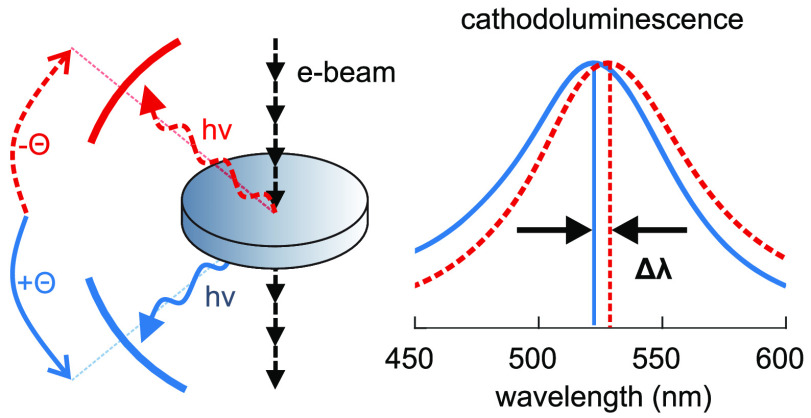
We use cathodoluminescence (CL) spectroscopy in a transmission electron microscope to probe the radial breathing mode of plasmonic silver nanodisks. A two-mirror detection system sandwiching the sample collects the CL emission in both directions, that is, backward and forward with respect to the electron beam trajectory. We unambiguously identify a spectral shift of about 8 nm in the CL spectra acquired from both sides and show that this asymmetry is induced by the electron beam itself. By numerical simulations, we confirm the observations and identify the underlying physical effect due to the interference of the CL emission patterns of an electron-beam-induced dipole and the breathing mode. This effect can ultimately limit the achievable fidelity in CL measurements on any system involving multiple excitations and should therefore be considered with care in high-precision experiments.
The insight in light–matter interaction at the nanoscale currently strongly benefits from developments in electron spectroscopy. In particular, electron energy loss spectroscopy (EELS) and cathodoluminescence (CL) in combination with scanning transmission electron microscopy (STEM) provide high spatial and spectral resolution.1−4 Of equal importance, advances in the theoretical understanding enable us to relate electron-based signals to local optical properties.5 Because of their strong optical effects on the nanoscale and the related rich physical phenomenology, plasmonic nanostructures are a prominent research field in STEM-based electron spectroscopy. Fast electrons, focused to a small spot, can excite plasmon modes on a local scale. Measuring electron energy loss in EELS yields information on both radiating and nonradiating plasmons,6−9 whereas CL only probes radiative excitations, that is, modes coupling to light.10−15
An intriguing effect from single plasmonic nanoparticles is directional light scattering. Upon excitation with light, scattering directionality is observed from geometrically asymmetric nanoparticles when different plasmon modes are excited within a narrow spectral range. The shape asymmetry can then lead to angle-dependent interference of the light fields scattered by different plasmon modes.16 In a STEM, this can be achieved even with symmetric particle geometries when locally exciting the particle nonsymmetrically, taking advantage of the highly confined electron beam. Extended to angle- and polarization-resolved schemes, this opened new venues in probing the field profiles, oscillation strengths and phases, and the light coupling properties of plasmon modes on the nanoscale.17−21 Applying STEM-CL as a standard high-resolution tool, any factors distorting or limiting the fidelity of angle- and wavelength-resolved CL measurements evidently have to be known. For example, the role of the substrate for CL emission has been characterized22 or for layered semiconductors the importance of considering waveguide modes or Cherenkov radiation has been emphasized.23 In this Letter, we show that the symmetry breaking due to the propagation direction of the electron beam itself can ultimately limit the spectral data interpretation. As the electrons pass perpendicularly through a plasmonic silver nanodisk, slightly different charge densities are excited on both disk faces, thus generating a dipole moment aligned with the electron trajectory. Spectrally overlapping the plasmonic radial breathing mode (RBM) of the nanodisk, the far field interference of the CL patterns of these two modes leads to a distinct spectral shift of about 8 nm in the backward and forward directions with respect to the beam trajectory. Importantly, this effect is also present when symmetrically exciting a geometrically symmetric particle. Our experimental results are supported by numerical simulations that we also apply to illustrate the individual role of the involved parameters. Although demonstrated here for a specific nanodisk geometry, the effect might be noticeable in a wide range of nanooptical systems featuring multiple excitations and should therefore be taken into account in high-precision CL experiments.
We prepared silver nanodisks of 30 nm thickness on a 5 nm thick SiNx membrane by electron beam lithography, high vacuum metal deposition, and lift-off. The disk diameter was varied between 200 and 400 nm; for a sample overview, see Figure S1 in Supporting Information. The CL experiments were performed on a FEI Tecnai F20 at 200 kV, equipped with a Gatan VULCAN CL spectrometer, consisting of two mirrors located above and below the sample, allowing the detection of the upward and downward emission of light separately, as schematically shown in Figure 1a. The simulations were based on the boundary element method, applying the MNPBEM toolbox.24 The dielectric function of silver was taken from tabulated data.25,26 For further details, see Methods.

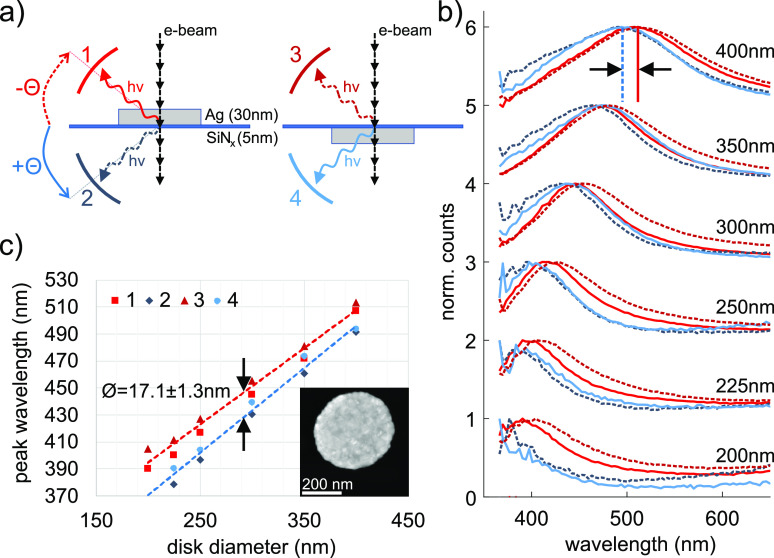
Experimental two-mirror CL spectroscopy. (a) Sketch of the measurement setup: A 200 keV electron beam traverses a silver nanodisk (200–400 nm diameter) on a 5 nm thick SiNx substrate along its symmetry axis, exciting the RBM. CL is collected by two mirrors above (red) and below (blue) the sample for both orientations of the substrate, corresponding to the sequentially measured spectra 1–4. (b) Normalized CL spectra acquired in backward (red) and forward directions (blue). The solid lines indicate detection facing the particle, while the dashed lines correspond to detection through the substrate. (c) Peak positions from the spectra in (b) plotted versus disk diameter. The red data points are clearly spectrally shifted with respect to the blue ones, as emphasized by the linear fits and the black arrows.
We excite the RBM mode by an electron beam transversing the nanodisk perpendicularly along its symmetry axis.27 While the RBM is a dark mode, that is, a mode with a zero net dipole moment, retardation lifts the dark character, giving rise to size-dependent CL emission.9 For the RBM, light is emitted around the ±45° directions with respect to the disk plane.28 CL is detected by two mirrors that collect light in the backward (1) and forward (2) directions, as illustrated in Figure 1a, over polar angle ranges of [−21°,–61°] and [+19°,+63°], respectively, when defining the sample plane direction as 0° and the electron beam direction as 90°. The mirrors focus the CL light onto glass fibers which are coupled to a spectrophotometer. Although the CL spectra 1 and 2 have to be acquired consecutively (acquisition time around 15 s, see Methods), the CL system stability allows us to exclude any relevant instrumental signal drifts. However, increasing sample contamination from measurement to measurement due to carbon deposition plays a role, as discussed below. To probe the role of the orientation of the SiNx substrate, the sample holder is removed from the STEM, and the sample is turned upside down and reinserted into the microscope to repeat the measurements on the same nanodisk, but with a reversed substrate orientation, corresponding to the measurements backward (3) and forward (4), as sketched in Figure 1a.
Figure 1b shows the CL spectra from silver disks with diameters of 200–400 nm in the backward (1, 3; red) and forward (2, 4; blue) directions. All spectra clearly show the RBM peak, which redshifts with increasing disk diameter.27 This is accompanied by an increase of the peak width, due to enhanced radiation damping for larger disks. The measured peak positions are summarized in Figure 1c, together with linear fits that yield an average spectral shift between backward and forward CL peaks of approximately 17 nm. For a detailed discussion of the peak position evolution and the error estimation, see Methods. We find in addition a quite small but significant redshift between spectra 1 and 3 (red squares and triangles in Figure 1c) and spectra 2 and 4 (blue circles and tilted squares). As the measurements were done consecutively in the order 1-2-4-3, electron-beam-induced contamination causing a redshift due to increasing the permittivity of the disk surrounding because of carbon deposition is the most likely cause.29 The simulation results discussed below confirm this assumption. It is important to note that the substrate, 5 nm thin, shows no discernible influence on the CL peak position.
Next, we simulate the CL spectra with the MNPBEM toolbox.24 To simplify the problem, we neglect the substrate (which seems to play no important role in our system; for further discussion, see Figure S2 in the Supporting Information) yet take into account the limited angular range of the experiment by summing the CL intensity in the θ ranges [−60°,–20°] and [+20°,+60°]. Figure 2b shows the simulated spectra for disk diameters of 150–300 nm. Beside the diameter-dependent peak shift and broadening, we recover the RBM peak shift between the backward and forward spectra. The extracted peak values are plotted in Figure 2c, yielding an average peak shift of about 6 nm. The considerable difference to the experimental result (17 nm) can be attributed to the contamination effect discussed above with possible further contributions from deviations in the simulated and experimental geometries and permittivities.
![Simulated CL spectra.
(a) Sketch of the excitation geometry: A
200 keV electron beam traverses a 30 nm thick silver nanodisk along
its symmetry axis, exciting the RBM. (b) CL spectra from the RBM for
disk diameters of 150–300 nm, integrated over the [−60°,–20°]
and [+20°,+60°] angular ranges. The main peak is attributed
to the RBM, whereas the second peak on the left side of the main peak
originates from the radially excited breathing mode RBM*. (c) Gaussian
fitted peak positions from (b) are plotted as a function of disk diameter,
showing the spectral shift between forward and backward CL.](/dataresources/secured/content-1765769275212-ce140324-9464-4603-ba3f-608a369b6104/assets/nl0c04084_0002.jpg)
Simulated CL spectra. (a) Sketch of the excitation geometry: A 200 keV electron beam traverses a 30 nm thick silver nanodisk along its symmetry axis, exciting the RBM. (b) CL spectra from the RBM for disk diameters of 150–300 nm, integrated over the [−60°,–20°] and [+20°,+60°] angular ranges. The main peak is attributed to the RBM, whereas the second peak on the left side of the main peak originates from the radially excited breathing mode RBM*. (c) Gaussian fitted peak positions from (b) are plotted as a function of disk diameter, showing the spectral shift between forward and backward CL.
We now take a closer look at the angular dependence of the RBM CL emission from a 250 nm diameter nanodisk. Figure 3a displays simulated CL spectra for discrete θ values between ±20° and ±60°. We find that (i) neither the peak wavelength nor the CL intensity is symmetric with respect to the particle plane (θ = 0°), (ii) the peak intensity is maximum around 45°, as expected for the RBM,28 and (iii) the spectral peak shift increases for increasing deviations from the electron trajectory, that is, smaller values of θ, as illustrated in Figure 3b. Further simulations shown in the Supporting Information illustrate that the spectral asymmetry increases with the thickness of the nanodisk (Figure S3), while it is practically independent of the disk diameter (Figure S4). Furthermore, the forward and backward CL peak positions are symmetrically shifted to higher and lower wavelengths with respect to the EELS peak (Figure S5). Finally, the peak intensities and angles of maximum emission are plotted in Figure S6. To summarize so far, we find a spectral shift between the forward and backward CL emission from silver nanodisks that is not due to the presence of the substrate, carbon contamination, or the intrinsic angular dependence of the RBM emission. We thus conclude that the underlying reason is symmetry breaking due to the electron trajectory itself, a claim that we will now substantiate.
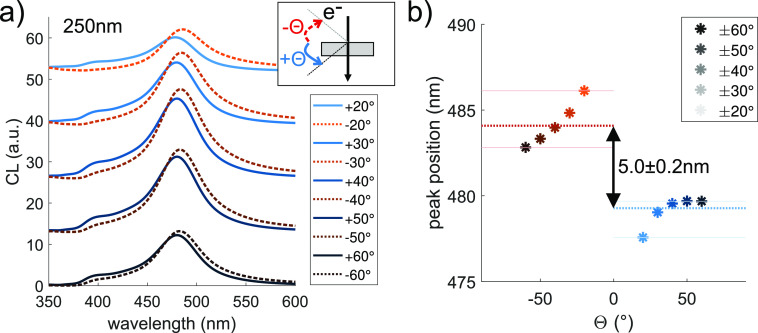
Simulated angular dependence of RBM CL. (a) CL spectra simulated for different emission angles from ±60° (bottom) to ±20° (top) of a silver nanodisk, 250 nm in diameter, and 30 nm thick. (b) Gaussian-fitted peak positions of the CL spectra in (a) versus emission angle. The dotted lines and the arrow show the peak position difference between the spectra in forward (integrated from +20° to +60°) and in backward directions (integrated from −20° to −60°).
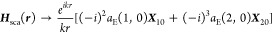
The electron beam approaching the nanodisk along its symmetry axis excites the RBM on both disk faces. The symmetry breaking due to the electron propagation direction leads to different charge densities on both sides of the disk, inducing a vertical dipole moment. Indeed, the corresponding spectral peaks are retrieved by CL spectra simulated around the direction normal to the electron trajectory (dashed arrows in Figure S7), while they are absent for larger angles (Figure S8), as expected for a vertically oriented dipole (Supporting Information). The spectral signatures of this mode are as well evident in Figures S3c and S4c, marked there by the red circles. For a more quantitative analysis, we take from our simulation results (CL and EELS spectra in Figure 4a) the scattered CL fields far away from the nanodisk and perform a multipole decomposition, following the procedure described in detail in Chapter 9 of Jackson.30 For the scattered magnetic field along direction n we obtain
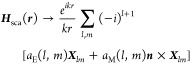
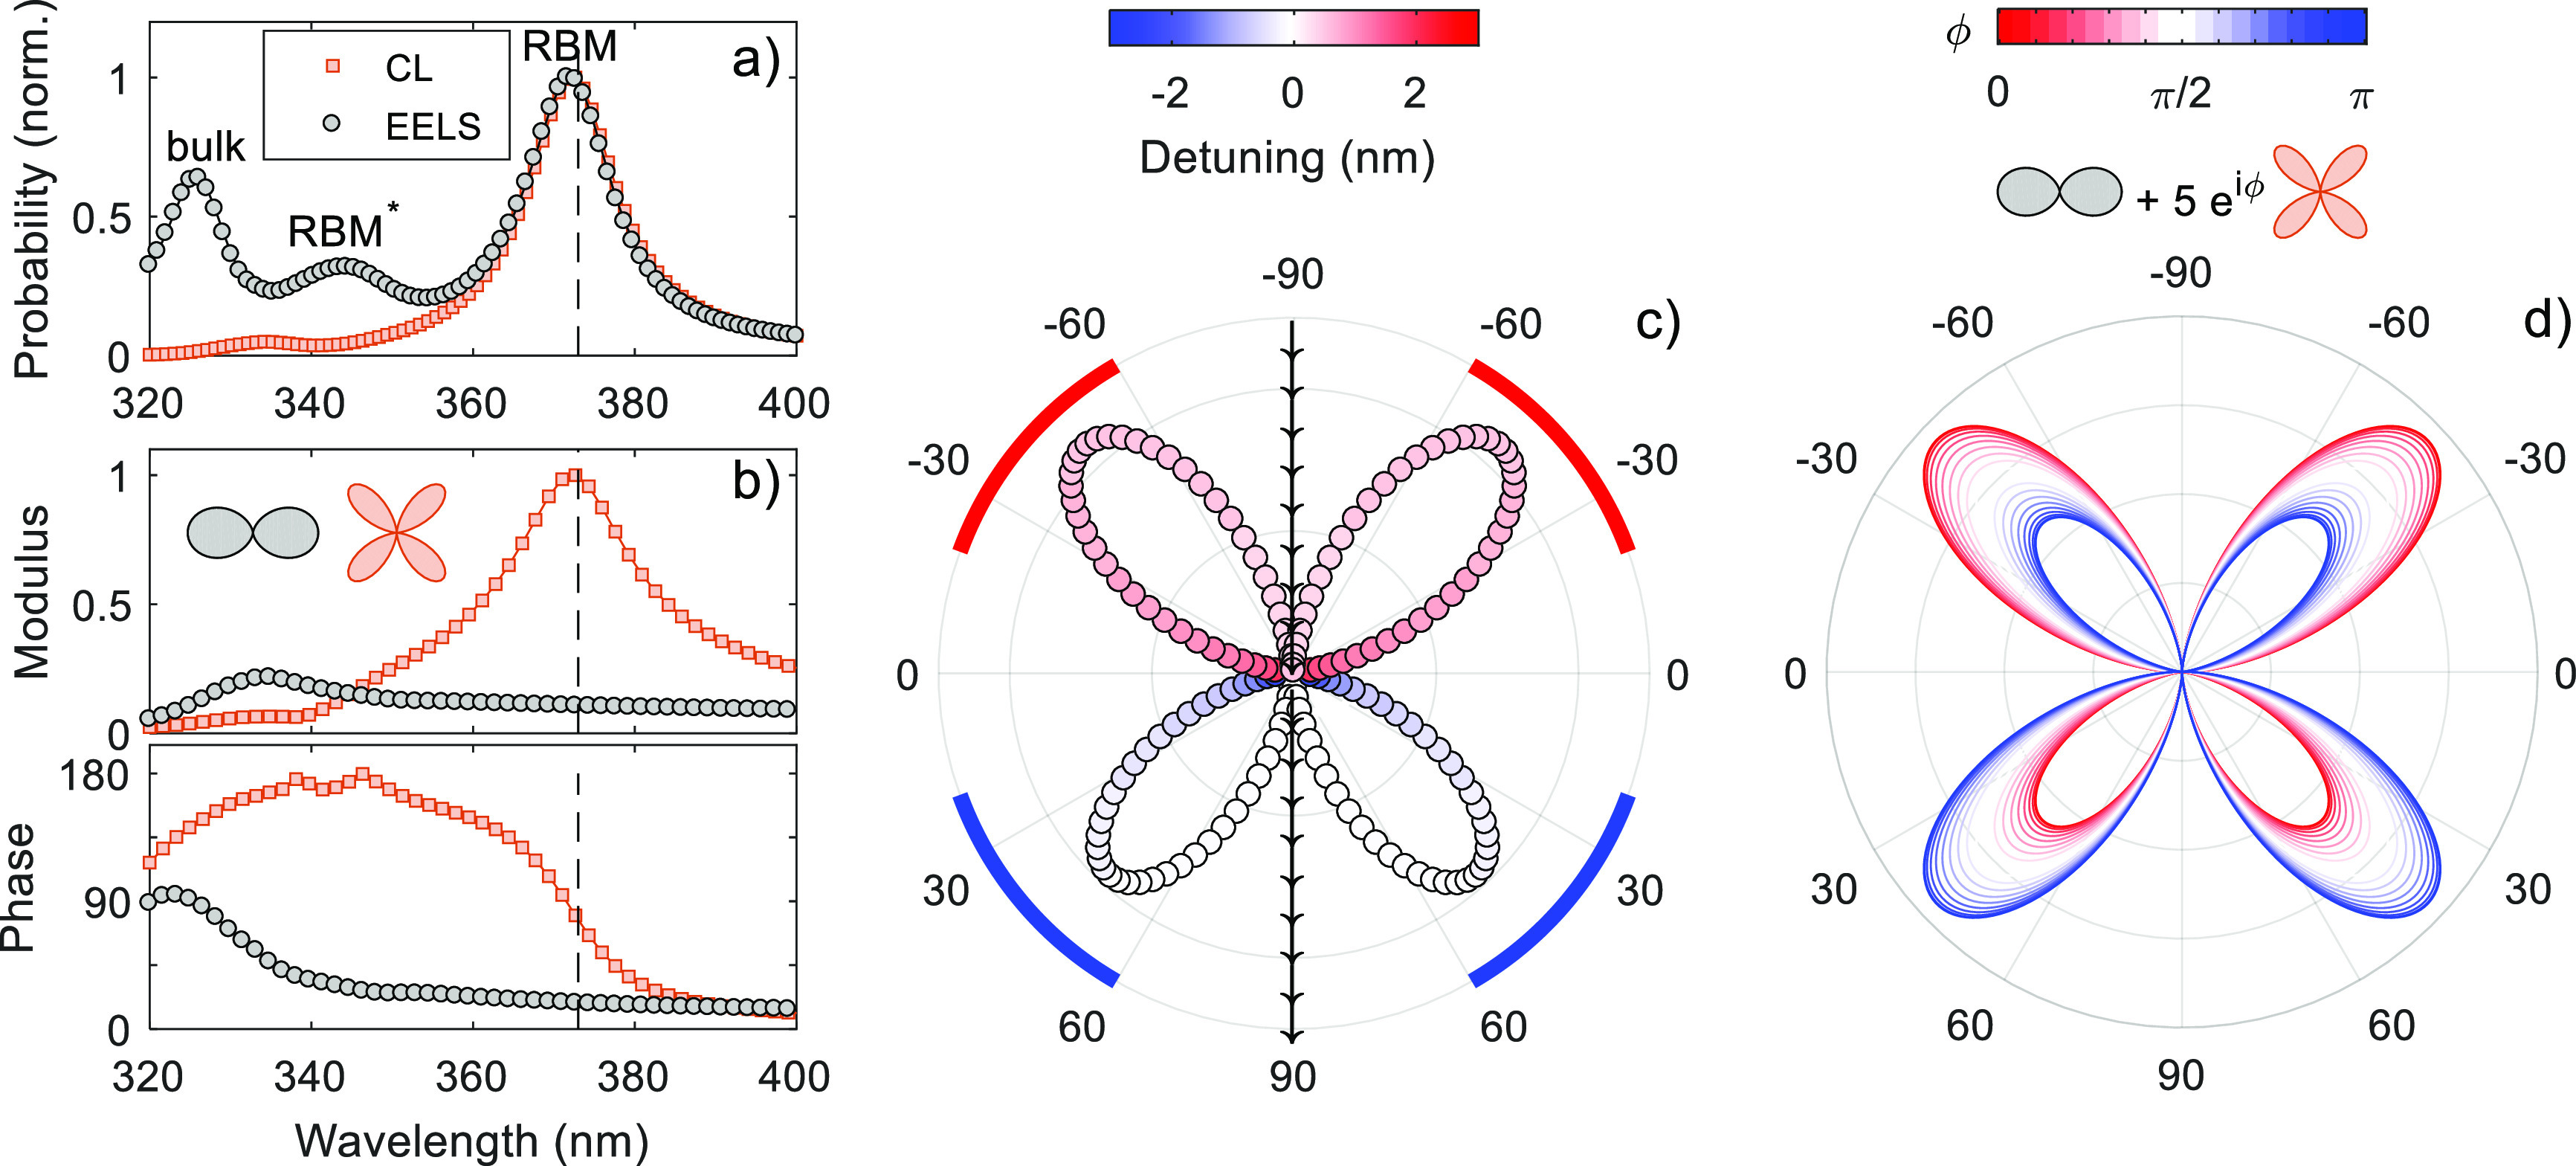
(a) Normalized simulated CL and EELS spectra for a silver nanodisk with a diameter of 200 nm and a thickness of 30 nm. The EELS spectra show three pronounced peaks, which are attributed to the radial breathing mode (RBM), a radially excited breathing mode (RBM*), and bulk losses. (b) Multipole decomposition of the CL in the far field. We show the modulus and phase of the multipole coefficients for the vertical dipole (black circles) and the quadrupole (red squares). (c) Polar plot of emitted CL. The radii scale with the maxima of the spectra emitted in a given spatial direction, and the colors encode the detunings of the wavelengths at the maxima with respect to the RBM peak maximum at 373 nm given in (a). The red and blue arcs indicate the directions covered by the collecting mirrors in the experiment. (d) Emission pattern of generic vertical dipole and quadrupole fields for different phase relations ϕ between the fields, see eq 2. For ϕ = 0 (ϕ = π) the CL emission into the backward (forward) direction dominates.
In conclusion, we have shown that the electron beam in STEM-CL can induce asymmetric surface charge densities giving rise to a dipole mode aligned with the electron trajectory. Even when spectrally well separated from a mode of interest (in our case the spectral peaks of the plasmonic vertical dipole and RBM are separated by 40 nm), their far-field interference can lead to direction-dependent significant spectral shifts. We thus face an ultimate limit to the achievable fidelity in CL measurements on systems involving multiple excitations. This should evidently be considered in high-precision experiments, together with a choice of optimized operation parameters, where appropriate.
Silver nanodisks were prepared by electron beam lithography on a 5 nm thin SiNx membrane. The membrane was plasma cleaned for 10 s in air plasma prior to resist deposition (poly(methyl)methacrylate) and baking at 180 °C for 5 min. After electron beam exposure in a RAITH eLINE+ system at 20 kV and 33 pA, the sample was developed and 30 nm silver was thermally evaporated at a rate 1 nm/s followed by a standard lift-off in acetone at 40 °C.
CL experiments were performed on the TEM FEI Tecnai F20 equipped with the Gatan VULCAN CL spectrometer. The spectrometer consists of two mirrors. One is located above the sample covering the collection angles ranging from −61° to −21° and one is located below the sample covering the collection angles ranging from +19° to +63° when measured from the sample plane. This allows the detection of the upward and downward emission of light separately. The azimuthal angle of both mirrors varies between −π/2 to + π/2. The microscope was operated at 200 kV in scanning regime with the electron beam current of 8 nA. CL linescans across the disk were acquired with an exposure time of 1.5 s per pixel, resulting in acquisition times of 13.5 to 18 s for the spectra shown in Figure 1 averaged over the center pixels of the disks.
The spectra shown in Figure 1a were first intensity corrected, accounting for the wavelength-dependent sensitivity of the mirrors, optical fiber, grating, and CCD camera.31 After normalization of each spectrum by diving through its acquisition time, a reference spectrum, acquired close to the disk on the bare SiNx substrate, was subtracted. It is important to note that this step strongly enhanced the data quality in terms of signal-to-noise ratio. Because of a systematic noise, most likely originating from the detection camera, we could reduce this contribution by just subtracting the reference, including no other signal. Finally the spectra were normalized to their maxima for better comparison of the RBM peak shifts (Figure 1b). The peak positions plotted in this manuscript were obtained by Gaussian fitting of the corresponding spectra, while the given error was related to twice the standard deviation. The energy split values given in Figure 3 and in Supporting Information are calculated from CL spectra, which where summed over the relevant angle range (−60° to −20° and +20° to +60°, respectively) before Gaussian fitting. The spectral shift of 17.1 nm given in Figure 1c is calculated from averaging the difference between red and blue mean values for each disk size. The red and blue mean values correspond to the arithmetic mean of 1 and 3, and 2 and 4, respectively, again for each disk size. The given error of ±1.3 nm is calculated from the fit errors, including error propagation. Carbon deposition during the experiment may lead to an additional redshift, which is a possible explanation for the observed shift between the red data points 1 and 3, and the blue data points 2 and 4 in the order of half of the spectral shift value mentioned above. This results in an effective spectral shift between forward and backward emission of approximately 8 nm, close to the simulated value of 6 nm.
The CL experiments were modeled using the retarded solver of the MNPBEM toolbox,32 following the classical electrodynamics framework described in ref (2). The electron beam was assumed to transverse the nanodisk along its symmetry axis, and the induced far-field was calculated at discrete orientation angles, characterized by both polar and azimuthal angles. The light intensity emitted toward a given polar angle was then calculated as the Poynting vector integrated over the azimuthal angles with constant polar angle. Calculations were performed using the relative permittivity of silver taken from ref (25), for both nanodisks only and nanodisks sitting on top of a SiNx membrane, except for data shown in Figure 4, where ref (26) was used, which highlights that the findings in this work are not limited by the chosen tabulated silver data. In case of nanodisks only (without substrate), the objects were embedded within an effective dielectric medium with constant relative permittivity33 of 1.7, resulting in RBM peak energies in good agreement with the calculations that include the membrane with a relative permittivity of 4 (see Figure S2 in the Supporting Information). Only in case of Figure 4 we have chosen a relative permittivity of 1, which shows the independence (embedded medium vs vacuum) on the discussed effect. Further details can be found in the methods section of ref (9). The detection angle of the simulated CL spectra spanned over the range as indicted in the figure legends or captions, whereas in Figure 4a,b the signal emitted in all directions (4π) was collected.
The Supporting Information is available free of charge at https://pubs.acs.org/doi/10.1021/acs.nanolett.0c04084.
Overview of the EBL prepared silver nanodisks (Figure S1), influence of the substrate (Figure S2), influence of the disk thickness (Figure S3), influence of the disk diameter (Figure S4), comparing EELS and CL (Figure S5), CL peak intensities (Figure S6), CL emission to lower angles (Figure S7) and higher angles (Figure S8) (PDF)
The authors declare no competing financial interest.
This work was supported by the FWF SFB NextLite (F4905–N23), FWF under project P 31264, NAWI Graz, the Graz Centre for Electron Microscopy (ZFE), and the University Service Centre for Transmission Electron Microscopy (USTEM). This work was partially supported by European Union’s Horizon 2020 program (project SINNCE, No. 810626). We thank Thomas Götsch, Christoph Pratsch, and Thomas Lunkenbein for fruitful discussions on electron-matter interaction and carbon contamination in transmission electron microscopes. M.H. acknowledges the support of Thermo Fisher Scientific and CSMS scholarship 2019.
Dedicated to the memory of Mark Stockman. We are grateful to Mark Stockman who, at the Nano & Photonics Meeting in Mauterndorf in 2013, first dismissed our dark plasmonic breathing mode (of course) but finally approved it. We will always miss his vision and passion for the field of plasmonics.
 Fundamental Limit of Plasmonic Cathodoluminescence
 Facebook
 Twitter
 Linkedin
 Whatsapp
