 A versatile EPR toolbox for the simultaneous measurement of oxygen consumption and superoxide production


- Altmetric
In this paper, we describe an assay to analyze simultaneously the oxygen consumption rate (OCR) and superoxide production in a biological system. The analytical set-up uses electron paramagnetic resonance (EPR) spectroscopy with two different isotopically-labelled sensors: 15N-PDT (4-oxo-2,2,6,6-tetramethylpiperidine-d16-15N-1-oxyl) as oxygen-sensing probe and 14N-CMH (1-hydroxy-3-methoxycarbonyl-2,2,5,5-tetramethylpyrrolidine, a cyclic hydroxylamine, as sensor of reactive oxygen species (ROS). The superoxide contribution to CMH oxidation is assessed using SOD or PEGSOD as controls. Because the EPR spectra are not superimposable, the variation of EPR linewidth of 15N-PDT (linked to OCR) and the formation of the nitroxide from 14N-CMH (linked to superoxide production) can be recorded simultaneously over time on a single preparation. The EPR toolbox was qualified in biological systems of increasing complexity. First, we used an enzymatic assay based on the hypoxanthine (HX)/xanthine oxidase (XO) which is a well described model of oxygen consumption and superoxide production. Second, we used a cellular model of superoxide production using macrophages exposed to phorbol 12-myristate 13-acetate (PMA) which stimulates the NADPH oxidase (NOX) to consume oxygen and produce superoxide. Finally, we exposed isolated mitochondria to established inhibitors of the electron transport chain (rotenone and metformin) in order to assess their impact on OCR and superoxide production. This EPR toolbox has the potential to screen the effect of intoxicants or drugs targeting the mitochondrial function.

•
OCR and superoxide production are crucial to assess mitochondrial (dys)function.
•The EPR toolbox analyzes simultaneously the OCR and superoxide production.
•The EPR toolbox was validated in enzymatic system, cells and isolated mitochondria.
•The EPR toolbox has the potential to screen compounds altering mitochondrial function.
Introduction
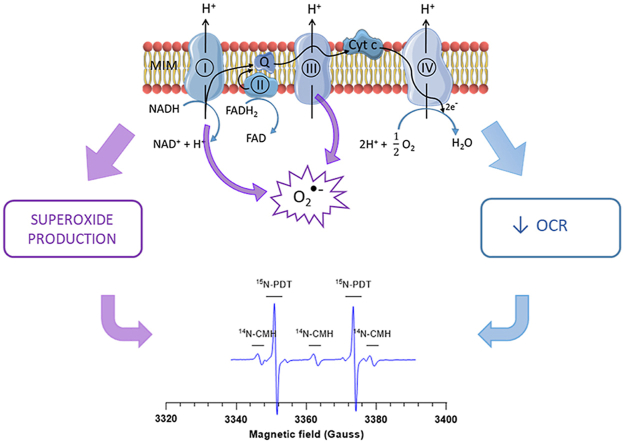
Over the past decades, research on mitochondria witnessed an important gain of interest, highlighting its implication in many physiological and pathological processes like diabetes [1], cardiovascular diseases [2] and neurodegenerative disorders. A growing body of evidence also indicates that mitochondria plays a key role in cancer progression and response to treatment due to its involvement at the crossroad of many cellular pathways. Mitochondrial implication in mediating programmed cell death has led to a great interest in exploiting radio- and chemo-therapeutic agents to trigger cancer cell death [3]. Also, altering the mitochondrial respiration has been associated with alleviation of tumor hypoxia and a consequent increase in radiosensitivity [[4], [5], [6]]. Mitochondria are the major producers of superoxide and other downstream ROS in the cell, the main sources of superoxide being complexes I and III of the electron transport chain (ETC). Cellular ROS are maintained in stable balance by antioxidant systems and enzymes such as superoxide dismutase (SOD), catalase, glutathione peroxidase and other accessory enzymes such as thioredoxins and peroxiredoxins [7]. When this balance is disrupted, increase in ROS concentration can cause DNA damage, lipid peroxidation and defects in cell signaling [8]. ROS induction is also a well-established cause of carcinogenesis [9,10]. Superoxide may trigger cell death when produced in large excess but, at moderate levels, it was suggested to be a key driver promoting cancer cell migration and metastasis [11].
Taken together, the dual dose-dependent effects on oxygen consumption rate (OCR) and superoxide production are crucial to consider when assessing mitochondrial function and/or dysfunction. So far, no technology is able to analyze simultaneously the oxygen consumption and superoxide production coming from the ETC. The ultimate goal of this paper was to provide an analytical set-up able to assess at the same time OCR and superoxide leakage on a single mitochondrial preparation. For the purpose, we used electron paramagnetic resonance (EPR) spectrometry. OCR determination using EPR oximetry is based on the signal variation (change in EPR linewidth) of a paramagnetic oxygen sensing probe (for example, a nitroxide) in the presence of oxygen consuming cells in a closed system [4,[12], [13], [14]]. In addition, EPR is a suitable technology for the detection of superoxide. It has been shown that superoxide production can be monitored by the oxidation of cyclic hydroxylamines into nitroxides [15,16]. Because their oxidation into paramagnetic nitroxide can be due to several redox reactions, the contribution of superoxide to the nitroxide formation has to be deduced from experiments carried out in the presence and in the absence of SOD or PEGSOD (pegylated-superoxide dismutase) as appropriate controls [17]. In order to measure OCR and superoxide production simultaneously, we designed an assay with the ability to measure the variation of the EPR linewidth of one nitroxide, on the one hand, and the formation of another nitroxide, on the other hand. To separate the EPR signals coming from both nitroxides, we used different isotopically-labelled probes. For OCR measurements, we used 15N-PDT (4-oxo-2,2,6,6-tetramethylpiperidine-d16-15N-1-oxyl) as oxygen-sensing probe (Fig. 1A). The EPR signal from this nitroxide is a doublet because of the coupling of the electron spin with 15N which possess a nuclear spin I = 1/2. Because deuterium substitutes hydrogen in 15N-PDT, the EPR linewidth is very narrow, providing a high sensitivity to measure the broadening induced by the oxygen content in the preparation [4,12]. For superoxide production, we used 14N-CMH (1-hydroxy-3-methoxycarbonyl-2,2,5,5-tetramethylpyrrolidine, Fig. 1B), a cyclic hydroxylamine that detects superoxide in complex biological media with high sensitivity [17]. The superoxide-induced transformation of CMH into a nitroxide provides a three-lines EPR spectrum due to the coupling of the electron spin with 14N which possess a nuclear spin I = 1. Because both EPR spectra are not superimposable, the variation of the linewidth of 15N-PDT (linked to OCR) and the formation of 14N-CMH (linked to superoxide production) can be recorded simultaneously over time on a single preparation (Fig. 1C).
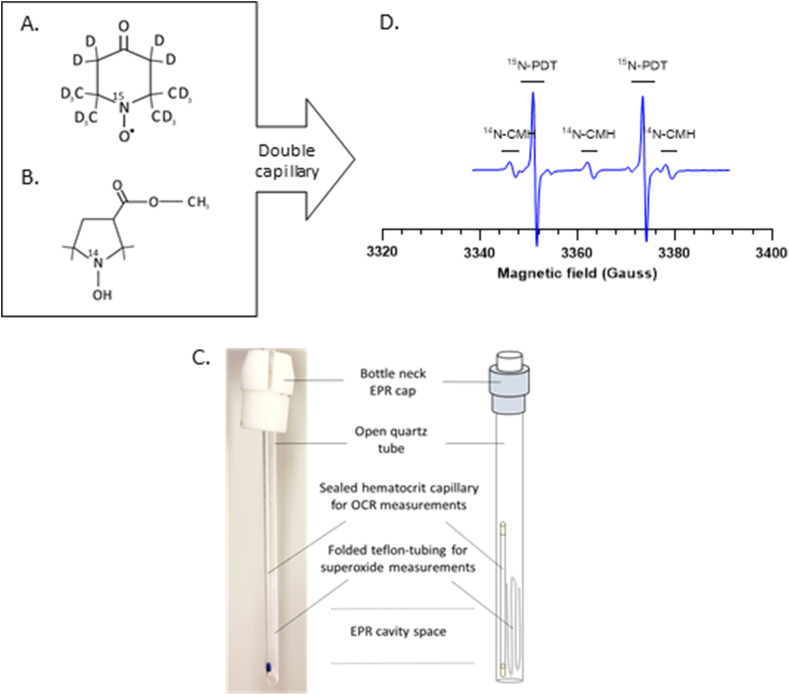
Experimental set-up of the EPR-mitotoolbox.
(A) Chemical structure of 15N-PDT, a paramagnetic nitroxide.
(B) Chemical structure of 14N-CMH, a diamagnetic cyclic hydroxylamine.
(C) Schematic view of the double capillary device.
(D) Representative global EPR spectrum obtained by combining 15N-PDT and 14N-CMH in PBS buffer into a double capillary device, at a final concentration of 100 μM and 0.5 mM respectively.
The validation of this EPR assay was carried out in several steps. In a preliminary step, we optimized the experimental set-up in order to avoid cross-reaction between the nitroxide and the cyclic hydroxylamine. Then, we assessed the ability of the system to measure simultaneously OCR and superoxide production in biological systems of increasing complexity. First, we used an enzymatic assay based on the hypoxanthine (HX)/xanthine oxidase (XO) which is a well described model of oxygen consumption and superoxide production. Second, we used a cellular model of superoxide production using macrophages exposed to phorbol 12-myristate 13-acetate (PMA) which stimulates the NADPH oxidase (NOX) to consume oxygen and produce superoxide. Finally, we exposed isolated mitochondria to established inhibitors of the ETC in order to assess their impact on OCR and superoxide production.
Material & methods
Reagents
14N-CMH (1-hydroxy-3-methoxycarbonyl-2,2,5,5-tetramethylpyrrolidine) and metformin were purchased from Enzo Lifescience (Antwerpen, Belgium). 15N-PDT (4-oxo-2,2,6,6-tetramethylpiperidine-d16-15N-1-oxyl) originates from CDN Isotopes. Rotenone, superoxide dismutase (SOD), superoxide dismutase conjugated with polyethylene glycol (PEGSOD), xanthine oxidase (XO), hypoxanthine (HX), diethylenetriaminepentaacetic acid (DTPA), dextran from leuconostoc mesenteroides (average MW 60000–76000), adenosine triphosphate (ADP), pyruvate, succinate, malate and phorbol 12-myristate 13-acetate (PMA) were from Sigma-Aldrich (Overijse, Belgium). Mitochondrial assay buffer (MAS) concentrated 2 times (MAS 2x) was composed of sucrose (70 mM), mannitol (220 mM), KH2PO4 (10 mM), MgCl2 (5 mM), HEPES (2 mM), EGTA (ethyleneglycol bis (α-aminoethylether)-N,N1-tetraacetic acid, 1 mM) and FA-free BSA (fatty acid free Bovine Serum Albumin, 0.2%). All MAS components were also purchased from Sigma-Aldrich.
Preliminary experiment showing the cross reaction between nitroxide and hydroxylamine
Perdeuterated nitroxides as 15N-PDT (Fig. 1A) are very sensitive probes to measure oxygen levels in a medium using EPR-oximetry. Besides, cyclic hydroxylamines such as CMH (Fig. 1B) are capable of being oxidized into paramagnetic nitroxides (CM●) and therefore becoming EPR-visible. CMH, when used with appropriate controls, is a highly sensitive EPR tool to detect superoxide in complex biological media [17]. A preliminary experiment was performed using those two spin probes mixed together in PBS buffer into a single sealed hematocrit capillary to detect possible interferences. 15N-PDT and 14N-CMH were both mixed in PBS buffer at a final concentration of 100 μM and 0.5 mM respectively. 14N-CMH was flushed with argon while pipetting to avoid oxidation by air. The final mixture was injected into a hematocrit capillary and inserted in a quartz tube into the EPR cavity. Acquisitions wer taken 1min after the probes were blended together. After 10 min, PDT spectrum was reduced to silence (supplementary data Fig. 1SA) while CM● signal intensity increased (supplementary data Fig. 1SB). These changes in spectra are due to electron transfer between both spin probes, oxidizing CMH without any superoxide source and transforming PDT into a diamagnetic hydroxylamine. To avoid this unspecific signaling in the experiments, both spin probes were each blended into a specific mix (respiration versus superoxide) and injected into two separate capillaries. In this way, both probes remain separated while being inserted into the same quartz tube and placed into the EPR cavity (Fig. 1D).
hx/xo superoxide production model
Hypoxanthine/xanthine oxidase couple forms a well described model of superoxide production. HX/XO were used at a final concentration of 1 mM and 5mU/mL, respectively in PBS, mixed with DTPA (1 mM). EPR probes (15N-PDT and 14N-CMH, 5 μL) were then each added to this final base mixture (95 μL) separately at final concentration of 100 μM and 0.5 mM, respectively and put into a sealed hematocrit capillary (Hirschmann Laborgeräte). Both capillaries were inserted into a quartz tube and placed into the EPR cavity. Superoxide production was determined by the addition of SOD at a final concentration of 200U/mL. Table 1A (Supplementary data) describes the stock solutions of all the used agents whereas Table 1B describes the exact base mixture formulation of the experiment (Supplementary data).
Whole cell superoxide production model
RAW 264.7 macrophages were purchased from ATCC (Manassas, USA) and cultured at 37 °C in a humidified atmosphere with 5% CO2 maintained in Dulbecco's Modified Eagle Medium (DMEM, Thermo Fisher Scientific) supplemented with 10% heat-inactivated fetal bovine serum (FBS). At confluence, cells were exposed to 5 μM of PMA during 20 min at 37 °C, then washed with phosphate buffered saline (PBS), harvested and resuspended at two different concentrations (10x106 cells/mL for respiration and 20x106 cells for superoxide production) in PBS to perform EPR experiments. At first, cells were mixed with a 20% dextran solution and DTPA (1 mM) at a final concentration of 5x10⁶ cells/mL and incubated with the oxygen sensor 15N-PDT (100 μM) in order to measure oxygen levels in a sealed hematocrit capillary (Tab.2A supplementary data). At last, another mix was also prepared with macrophages (20x106 cells/mL) and DTPA (1 mM) incubated with 14N-CMH (0.5 mM) injected in a gas-permeable polytetrafluoroethylene (PTFE) tubing (ZEUSS) to measure superoxide production (Tab.2B supplementary data). 14N-CMH was flushed with argon while pipetting to avoid oxidation by air. Both capillaries were inserted into a quartz tube open at both ends and placed into the EPR cavity. Control experiments were carried out on PMA-unstimulated macrophages and specific superoxide production on PMA-stimulated cells was assessed using PEGSOD at a final concentration of 200 U/mL (10min preincubation). EPR acquisitions were started 3min after the probes were blended with the cells. Cell viability was verified after all experiments using trypan blue assay.
Fibroblast culture & mitochondrial isolation
3T3 fibroblasts were purchased from ATCC (Manassas, USA) and routinely cultured in Dulbecco's Modified Eagle Medium (DMEM containing High glucose (4.5 g/L), l-glutamine and HEPES) supplemented with 1% sodium pyruvate (Sigma) and 10% newborn calf serum (NCS) at 37 °C in a humidified atmosphere with 5% CO2. Confluent cells were washed with PBS, then harvested and resuspended in PBS for mitochondrial isolation. 3T3 mitochondria were obtained by performing isolation based on Frezza's procedure [18] described on mouse embryonic fibroblasts (MEFs). At last, mitochondrial protein quantification was assessed by BCA protein assay for data normalization.
mitochondrial enrichment
Efficiency of mitochondrial isolation as well as mitochondrial enrichment was assessed by western blotting comparing whole cell lysate with mitochondrial lysate obtained after mitochondrial isolation (as previously described). Protein from whole cell lysates were extracted using RIPA lysis and extraction buffer (Thermo Scientific) supplemented with 1% phosphatase inhibitors and 1% protease inhibitors. Mitochondrial and whole cell lysate protein were then quantified by BCA assay. Fifteen micrograms of protein were resolved by SDS-polyacrylamide gel 4–15% (Bio-Rad) electrophoresis and transferred to PVDF membranes. Membranes were probed with the following primary antibodies: mitochondrial biomarker anti COX IV (1D6E1A8, Invitrogen) and cytosolic biomarker GAPDH (A21994, Invitrogen). Membranes were then incubated with a horseradish peroxidase‐coupled secondary antibody (Cell Signaling Technology) and developed using SuperSignal™ West Pico Plus chemiluminescent substrate kit (Thermofisher). Films were scanned using ImageQuand LAS 500 and analyzed using the image processing software ImageJ.
Mitotoolbox procedure
Two different mixtures were made in order to measure oxygen consumption rate (OCR) and superoxide production simultaneously. Respiration mix contained respiratory substrates diluted in MAS buffer, DTPA (1 mM) and dextran to avoid sedimentation (Tab.3A supplementary data). The second mix contained the same components at identical concentration as the first one, except for dextran which is replaced by PBS (Tab.3B supplementary data). Substrates supply included NADH-linked substrates; pyruvate (5 mM), malate (2.5 mM) and FADH2-linked substrate; succinate (5 mM), as well as ADP (1.5 mM) to support state 3 respiration. 3 μL of concentrated mitochondria were homogenized in each mix (90 μL), followed up by the EPR probes (15N-PDT and 14N-CMH at 100 μM and 0.5 mM respectively). Final respiratory mix with oxygen sensor PDT was transferred rapidly into a sealed hematocrit capillary whereas superoxide mix with CMH was carefully injected into a PTFE tubing of 12 cm and folded in 4. Both capillaries were inserted into a quartz tube open at both ends and placed into the EPR cavity. For better functional responses, freshly isolated mitochondria were kept concentrated and stored on ice during the whole experiment. According to the protocol, mitochondria should also be used within 1–3 h after isolation.
etc modulation
Mitochondrial ETC was modulated using two known and well described mitochondrial complex I inhibitors, rotenone and metformin. Mitochondria were treated without preincubation with the drugs at 1 μM and 3 mM final concentration, respectively. Superoxide production was assessed using PEGSOD (200U/mL, 10min preincubation) in control mitochondria as well as in modulator-treated mitochondria.
epr settings
EPR measurements of all experiments were performed using a Bruker EMX-Plus spectrometer (Bruker, Germany) operating in X-band (9.85 GHz) and equipped with a PremiumX ultra low noise microwave bridge and a SHQ high sensitivity resonator. Typical parameters were set as follow: microwave power: 2.518 mW, modulation frequency: 100 kHz; modulation amplitude: 0.005 mT (for PDT) or 0.1 mT (for CMH); time constant: 20.48 ms; conversion time: 10.24 ms; sweep width: 1.5 mT.
epr measurements & data analysis
The EPR cavity was heated at 310 K with air during all experiments. CMH measurements were performed 3 min after the probe injection and then every 2min after that (odd numbers of minutes) whereas PDT measurements were performed 4 min after the probe injection and then every 2 min after that (even number of minutes). All experiments were done in triplicates. Acquisitions and data were acquired and collected using the Bruker Xenon Spin fit program. All acquisitions were saved at each timepoint to analyze separately. OCR was calculated by measuring PDT spectrum's linewidth which is proportional to oxygen level in the capillary. CMH probe oxidation were analyzed by calculating the double integration of the spectrum over time. Superoxide net production was calculated by subtracting the double integration value at timepoint 15min of the CMH spectrum with PEGSOD to the CTR value.
Statistics
Data are represented as means ± SEM. All experiments were performed in triplicates except for mitochondrial ETC modulation who were repeated 6 times. Student T tests were applied for HX/XO experiments and mitochondrial enrichment experiments whereas One-way ANOVA were performed on all other experiments.
Results
EPR spectra analysis
When using the double capillary device, 15N-PDT and 14N-CMH spectra are recorded with their specific EPR settings and saved to analyze separately. Oxygen consumption is assessed by measuring the linewidth of 15N-PDT spectra during time. The linewidth of 15N -PDT spectra is narrowed during time as oxygen is consumed (Fig. 2A). The linewidth is then correlated to the oxygen level present in the media thanks to a calibration curve of the probe made with known % of oxygen. Oxygen consumption rate (OCR) is determined by calculating the slope of oxygen consumption during time (Fig. 2B). To assess superoxide production, initial recorded CM● spectra (Fig. 2C) are double integrated to obtain signal intensity (SI) values that can be plotted in function of time (Fig. 2D). PEGSOD is added as a control in order to determine the contribution of superoxide in the CMH oxidation by subtracting the PEGSOD SI value to the CTR SI value obtained after 15min of acquisition.
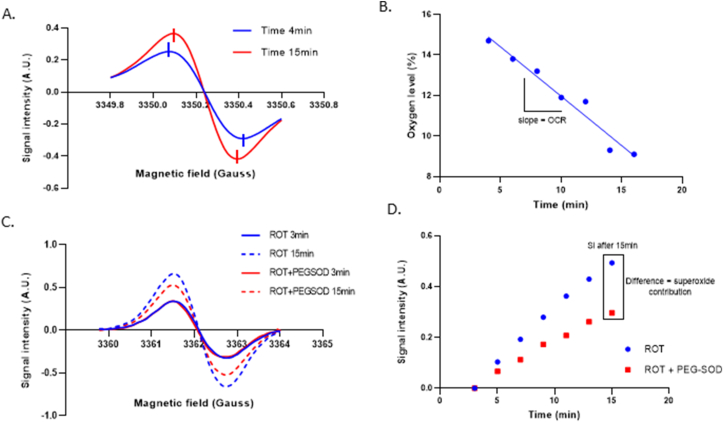
Experimental methodology of the EPR-mitotoolbox.
(A) Representative zoomed spectra of 15N-PDT linewidth decrease during time, assessing oxygen consumption by control 3T3 isolated mitochondria resuspended in MAS buffer and pyruvate/malate/succinate/ADP substrates. 15N-PDT spectrum at time point 4min is represented in dark blue while time point 15min is represented in red. Vertical lines represent peak to peak linewidth of each spectrum.
(B) Evolution over time of the oxygen level in sealed tubes containing control 3T3 isolated mitochondria resuspended in MAS buffer and pyruvate/malate/succinate/ADP substrates. The exact oxygen consumption rate (OCR) of each experimental condition is determined by measuring the slope of oxygen level decrease in the medium after 15min.
(C) Representative spectra of CMH oxidation by 3T3 isolated mitochondria during time after rotenone treatment (1 μM) with and without PEG-SOD (200U/mL). CM● at time point 3min is represented with a continuous line while dotted line represent time point 15min (dark blue for rotenone and red for rotenone + PEG-SOD).
(D) Evolution of CM● signal intensity over time. Previous CMH oxidation spectra shown in (C) were double integrated to calculate signal intensities linked to every condition. Signal intensity (SI) of the first measurement (3min) is subtracted to all other SI values in order to plot them according to time. SI values at time point 15min are used to determine superoxide contribution.
Substrate-enzyme couple: hypoxanthine/xanthine oxidase
We first tested the double capillary device with the duo of probes on a known system of superoxide production, notably the Hypoxanthine/Xanthine Oxidase (HX/XO) couple. XO uses oxygen to transform HX into xanthine and superoxide (Fig. 3A). The addition of SOD in the mix allows to consume the superoxide before it interacts with CMH, measuring in this way the specificity of the probe for superoxide. In addition, DTPA is incorporated each time to avoid Fenton reaction. Respiration was not altered in any of the conditions (Fig. 3B&C). HX/XO produces superoxide as proven by the addition of the SOD control (Fig. 3D&E).
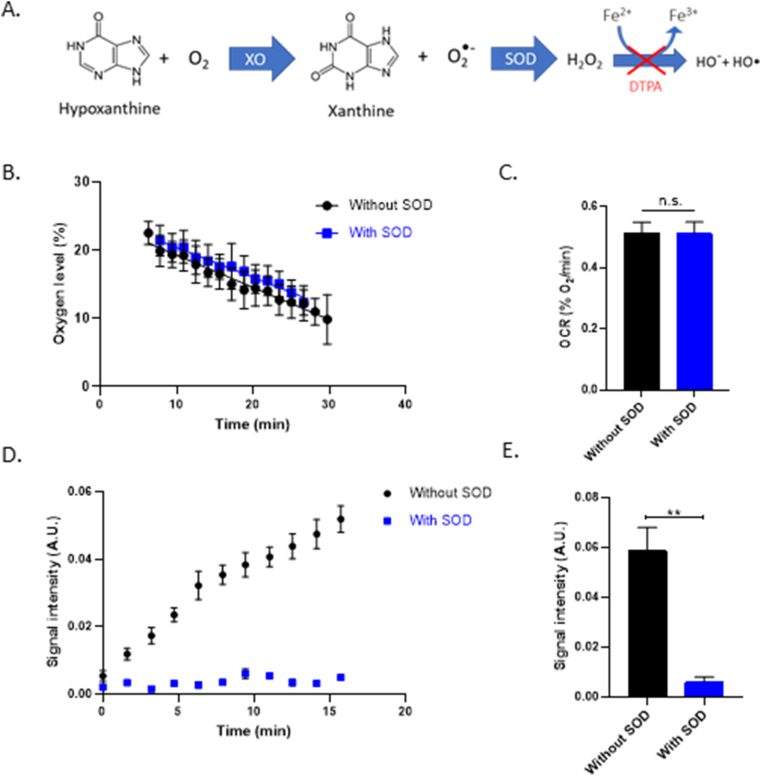
OCR and superoxide production in the substrate/enzyme model HX/XO
(A) Chemical reaction of XO oxidizing HX into xanthine and superoxide. DTPA is used in the mixture to avoid Fenton reaction and therefore avoid the apparition of hydroxyl radical who is also capable of oxidizing the CMH.
(B) Evolution of the oxygen consumption of the substrate-enzyme couple HX/XO over time (at a final concentration in PBS of 1 mM and 0.005U/mL respectively), in the presence or in the absence of SOD (200U/mL). Points of the curve represent mean ± SEM (%O2) at each time point, N = 3.
(C) OCR of HX/XO system (at a final concentration in PBS of 1 mM and 0.005U/mL respectively) after 30min, in the presence or in the absence of SOD (200U/mL). Bars represent mean ± SEM (%O2/min). Mixture without SOD is represented in black and mixture with SOD in blue, N = 3.
(D) Evolution of the CMH oxidation during time within the HX/XO system (at a final concentration in PBS of 1
mM and 0.005U/mL respectively), in the presence or in the absence of SOD (200U/mL). Points of the curve represent mean ± SEM (arbitrary unities) after double integration of CMH spectra at each time point.
(E) Signal intensity after CMH spectrum double integration at time point 15 min
in the presence or in the absence of SOD (200U/mL). Bars represent mean ± SEM (arbitrary unities). Mixture without SOD is represented in black and mixture with SOD in blue, N = 3, (**): p < 0.01.
Whole cell model: PMA stimulated RAW macrophages
Secondly, our device was also tested on a “whole cell” model of superoxide production using RAW 264.7 macrophages treated with PMA, stimulating the NADPH oxidase (NOX) to consume oxygen and produce superoxide [19] (Fig. 4A). Respiration was not altered in any of the conditions (Fig. 4B&C). PMA stimulated superoxide production in RAW cells proven by the addition of PEGSOD (Fig. 4D&E).
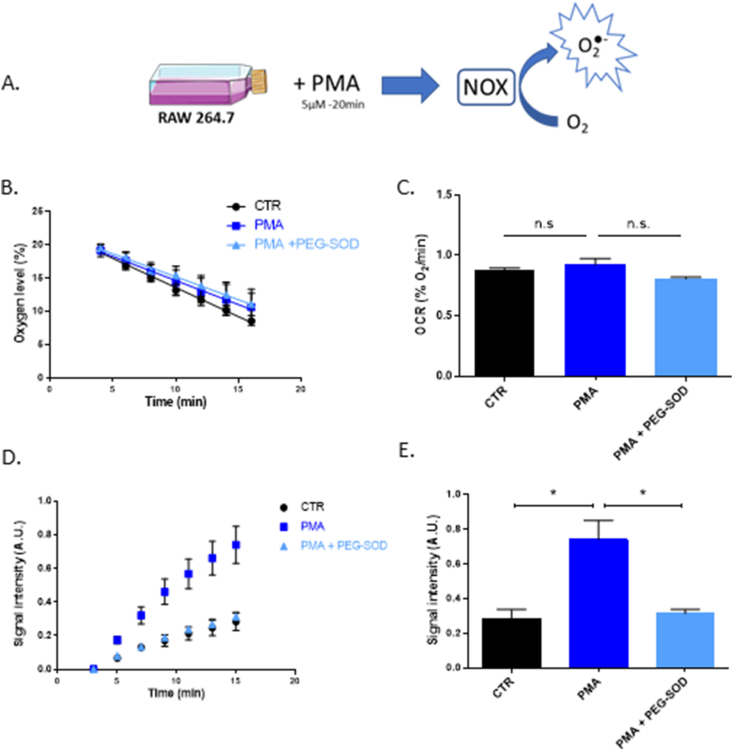
OCR and superoxide production in the whole cell model using RAW macrophages.
(A) Experimental set-up of NOX-dependent superoxide production.
(B) Evolution of the oxygen consumption of RAW 264.7 macrophages over time when treated with PBS (CTR), 5 μM of phorbol-12-myristate-13-acetate (PMA) during 20 min, or PMA 5 μM during 20min then incubated with PEGSOD (200U/mL) for 10min before EPR measurement (PMA+PEGSOD). Points of the curve represent mean ± SEM (%O2) at each time point, N = 3.
(C) Oxygen consumption rate of CTR, PMA-treated and PMA+PEGSOD-treated RAW 264.7 macrophages after 15min. Bars represent mean ± SEM (%O2/min). CTR are represented in black, PMA condition in dark blue and PMA+PEGSOD condition in light blue, N = 3.
(D) Evolution of the CMH oxidation over time on RAW 264.7 macrophages, when treated with PBS (CTR), 5 μM of phorbol-12-myristate-13-acetate (PMA) during 20min, or PMA 5 μM during 20min then incubated with PEGSOD (200U/mL) for 10min before EPR measurement (PMA+PEGSOD). Points of the curve represent mean ± SEM (arbitrary unities) after double integration of CMH spectra at each time point. N = 3.
(E) Signal intensity after CMH spectrum double integration at time point 15 min
of CTR, PMA-treated and PMA+PEGSOD-treated RAW 264.7 macrophages. Bars represent mean ± SEM (arbitrary unities). CTR are represented in black, PMA condition in dark blue and PMA+PEGSOD condition in light blue, N = 3, (*): p < 0.05.
Mitochondrial enrichment
To assess mitochondrial enrichment, protein expression of COX IV and GAPDH were assessed on all cell lysates as well as on isolated mitochondria. After mitochondrial isolation using the protocol described by Frezza [18], COX IV bands were 28 times more intense, indicating a mitochondrial enrichment in the final fraction (Fig. 5B). GAPDH, a cytosolic protein, is present in whole cell lysate while it significantly decreases 5 times in isolated fraction, demonstrating minimal non-mitochondrial contamination.
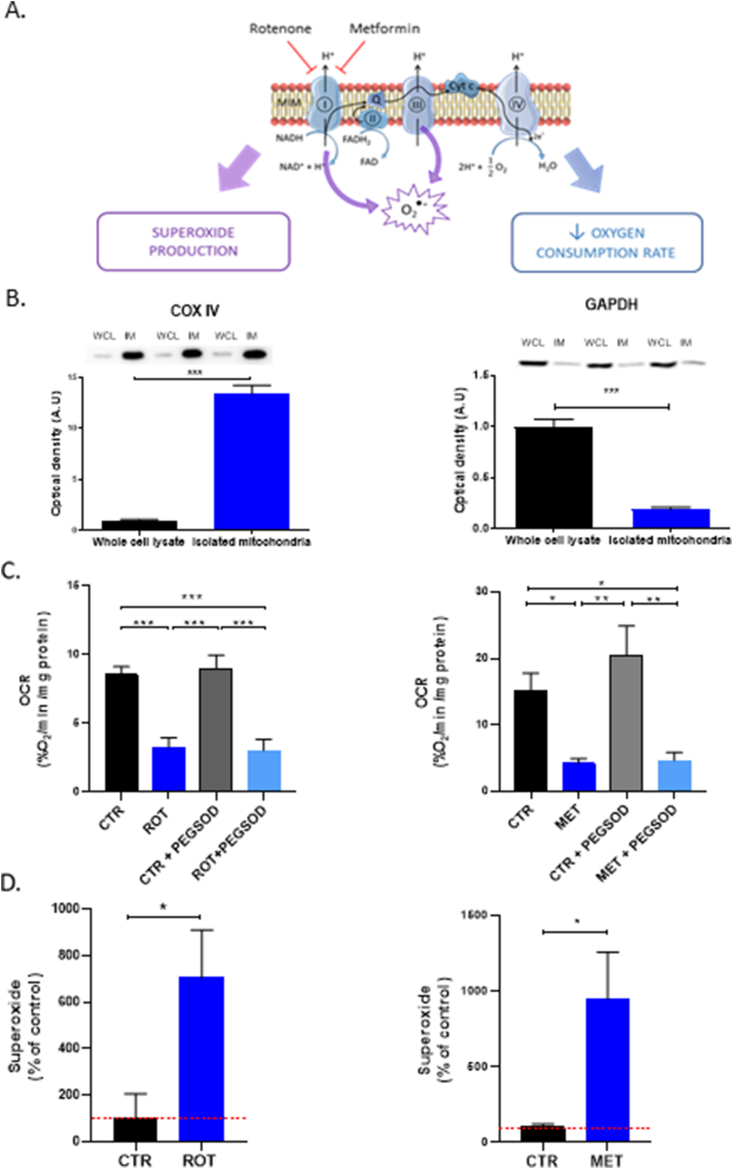
Mitochondrial function and ETC modulation.
(A) Schematic representation of the mitochondrial ETC and sites of action of rotenone and metformin.
(B) Mitochondrial enrichment in final fraction after mitochondrial isolation using western blot analysis. Bars represent mean optical density ± SEM (arbitrary unities) for whole cell lysate (WSL) and isolated mitochondria fraction (IM). COX IV stands for mitochondrial marker whereas GAPDH is exclusively cytosolic. N = 3, (***): p < 0.001.
(C) Oxygen consumption rate of DMSO-treated (CTR), 1 μM Rotenone-treated (ROT) or 3 mM Metformin-treated (MET), PEGSOD-treated 200U/mL (PEGSOD) and ROT+PEGSOD or MET+PEGSOD 3T3 isolated mitochondria in a double capillary device containing a mix of MAS buffer and mitochondrial substrates (pyruvate/succinate/malate/ADP). Bars represent mean ± SEM (%O2/min and normalized by mg of mitochondrial protein). N = 6, (***): p < 0.001.
(D) Superoxide net production of CTR and 1 μM Rotenone- or 3 mM Metformin-treated 3T3 isolated mitochondria in a double capillary device containing a mix of MAS buffer and mitochondrial substrates (pyruvate/succinate/malate/ADP). Bars represent the mean of SI of CMH spectrum minus SI of the same condition with PEGSOD ± SEM, at time point 15 min. CTR were normalized to 100% (dotted red line) and all data were also normalized by mg of mitochondrial protein. N = 6, (*): p < 0.05.
Mitotoolbox - ETC modulation
At first, rotenone was tested on isolated 3T3-mitochondria to measure its effect on OCR and superoxide production. Rotenone at 1 μM final concentration was able to inhibit OCR in a significant way compared to control mitochondria (Fig. 5C). Secondly, when mitochondria were treated with 3 mM metformin, a well-described antidiabetic agent and ETC-complex I inhibitor, OCR was also significantly inhibited compared to control mitochondria (Fig. 5C). For both experiments, the addition of PEGSOD did not affect the OCR within a same condition (CTR or treated). At last, both drugs increased superoxide net production (after 15min of acquisition) in a significant way compared to CTR mitochondria (Fig. 5D).
Discussion
In this manuscript, we have described a new experimental set-up that allows the simultaneous determination of OCR and ROS production in a single preparation using EPR spectrometry. The nitroxide probes were selected in order to avoid overlapping EPR signal thanks to the use of different isotopically-labelled probes (Fig. 1D). On the one hand, 15N-PDT was selected as oxygen sensor because of the sensitivity of its narrow EPR linewidth to variation of oxygen [14]. On the other hand, 14N-CMH was chosen because it was previously demonstrated that this cyclic hydroxylamine CMH offers a high sensitivity of detection of superoxide compared to other EPR probes [17,20]. Experiments were also carried out using SOD or PEGSOD in order to assess the contribution of superoxide to CM● formation [17,21]. As we observed a cross-reaction between PDT and CMH (Fig. 1S A-B), it was crucial to keep both sensors in separate capillaries that were inserted together in the EPR cavity (Fig. 1C). For the proof of concept, the EPR toolbox was qualified using biological media of increasing complexity.
The experimental set-up was first tested on an enzymatic model using the couple HX/XO where oxygen is consumed by HX to produce XO and superoxide (Fig. 3A). In these experiments, we observed, as expected, that the pre-incubation in the presence of SOD did not alter the OCR (Fig. 3B and C) while SOD abolished the formation of CM● (Fig. 3D and E). It is known that nitroxides may also react with superoxide [17,22,23] and may lead to an equilibrium between formation of a nitroxide induced by superoxide and its reverse reaction. In the present condition, we did not observe such an equilibrium in the short timeframe (15 min) used for monitoring the CM● formation as the EPR signal increased linearly over time (Fig. 2D). To avoid reaching this equilibrium, further EPR experiments were carried out within this short timeframe of 15 min.
The second model that we used relied on RAW 264.7 macrophages exposed to PMA which stimulates the NADH oxidase (NOX) to consume oxygen and produce superoxide (Fig. 4A). In this system, superoxide is produced both extracellularly and intracellularly, as it is produced by membrane-bound NOX-2 [19]. Therefore, we used PEGSOD (instead of SOD) to induce the dismutation of superoxide in both compartments to assign the contribution of superoxide for CM● formation. Three interesting observations can be noticed from Fig. 4 D-E: 1) there was a spontaneous oxidation of CMH into CM● in this cellular system; 2) the PMA exposure led to an increased formation of CM●; 3) the pre-incubation with PEGSOD abolished the incremental oxidation of CMH induced by PMA exposure. The formation of nitroxides from cyclic hydroxylamines could involve other mechanisms than superoxide detection, including unspecific oxidation mechanisms or reaction with other ROS species. For example, it has been described that hydroxylamines can be oxidized by superoxide, but also H2O2, peroxynitrite and derived nitrogen species ([17,[24], [25], [26]]. It is likely that some unspecific mechanisms or ROS are at the origin of the basal oxidation of CM● without PMA exposure, as this basal formation of CM● was not inhibited by the pre-incubation with PEGSOD (Fig. 3D and E). On the contrary, the contribution of unspecific mechanisms and ROS seems negligible when considering the effect of PMA, as the PMA-induced increase in EPR signal was abolished by PEGSOD, highlighting the main contribution of superoxide to CM● formation. Interestingly, we also observed that the exposure to PMA as well as the preincubation with PEGSOD did not affect the oxygen consumption by RAW 264.7 macrophages (Fig. 4B and C), highlighting that the oxygen consumption observed was mainly due to the cellular respiration and not due to the contribution of oxygen utilization by the NOX-2.
The third set of experiments was designed to qualify our approach of simultaneous measurement of OCR and superoxide production using isolated mitochondria exposed (or not) to inhibitors of the ETC. For the purpose, we used two compounds that are known inhibitors of NADH:ubiquinone oxidoreductase (complex I): rotenone [27,28] and metformin [[29], [30], [31]]. In this set-up, a significant decrease in OCR was induced by the exposure to rotenone or metformin (Fig. 5C), with no impact of PEGSOD. The superoxide net production was significantly increased for mitochondria exposed to rotenone (Fig. 5D), an observation consistent with those observed previously in the intracellular compartment [32] or in submitochondrial particles [27]. We also observed that metformin increased the superoxide net production in isolated mitochondria (Fig. 5D). While several reports described an increase in antioxidants systems on whole cells exposed to metformin [33,34], other reports highlighted an increase in ROS production including superoxide after metformin or mito-targeted metformin derivatives [32,35]. However, it should be noticed that the metformin-induced inhibition of respiration and superoxide production were observed for a relatively high concentration (3 mM). Further studies will be necessary to explore dose-effect relationships as plasma metformin levels reported are around 5 mg/L (30 μM) [36].
This integrative EPR toolbox for simultaneous measurement of OCR and superoxide production offers several advantages. First, this toolbox is less time consuming than sequential or separate experiments, allowing the characterization of more drugs or factors responsible for modulation in OCR or superoxide production. Second, measuring several parameters on the same cellular preparation or mitochondrial fraction dramatically improves the reproducibility of the experiments. The method described has the advantage to avoid variations in mitochondria preparations or recovery between separate experiments. Third, such approach is allowing more measurements since less cells or mitochondria are used to get a pattern of cellular or mitochondrial function. As shown by our experiments, the EPR toolbox described is rather versatile as it can be used to measure simultaneously OCR and ROS production on different types of preparations: substrate-enzyme solutions, whole cell suspensions or isolated organelles like mitochondria. The protocols described should be applicable on different cell lines and could potentially be used in other complex biological systems. However, this has yet to be proven knowing that there could be interferences with the hydroxylamine and the ferroxidase activity of ceruloplasmin found in blood samples, for example. Here, we used CMH as this compound is distributing in intra- and extracellular spaces. CMH could be swapped by mitochondria-targeted probes such as MitoTEMPO-H that accumulates into the mitochondrial compartment to measure mitochondrial ROS when using whole cell models. Regarding experiments on isolated mitochondria, the substrates used can be adapted depending on the type of state respiration studied. The method seems particularly suitable to screen the effect of compounds altering the mitochondrial function, for example toxic substances inducing mitochondrial dysfunction [[37], [38], [39]], new mitochondrial targeted anti-cancer agents [35,40,41] or modulators of metastatic progression through mitochondrial superoxide scavenging [11,42].
A potential limitation of the toolbox is the lack of selectivity of cyclic hydroxylamines towards superoxide scavenging. As already emphasized, control experiments using SOD or PEGSOD are necessary to assess the contribution of superoxide to CM● formation [17,21]. These specific superoxide scavengers are strong indicators that superoxide is involved in the nitroxide formation. Hence, the toolbox described should be considered as a first rapid screening tool for change in metabolic and/or ETC function in a biological preparation, and the unambiguous involvement of superoxide (compared to other ROS) should be confirmed in independent experiments. For example (mitochondrial) superoxide can be unequivocally detected using (mito-)hydroxyethidine and HPLC-based methods [43,44].
Conclusion
We have described an EPR toobox which is a rapid versatile platform to measure simultaneously superoxide production as well as oxygen consumption in biological systems. For the proof-of-concept, this toolbox has been applied in enzymatic systems, whole cells and mitochondrial fractions. This toolbox has the potential to screen the effect of modulators, intoxicants or drugs targeting the mitochondrial function.
Declaration of competing interest
The authors declare that they have no conflict of interest. The sponsors had no role in study design, in the collection, analysis and interpretation of data, in the writing of the report.
References
1
2
3
4
5
6
7
8
9
10
11
12
13
14
15
16
17
18
19
20
21
22
23
24
25
26
27
28
29
30
31
32
33
34
35
36
37
38
39
40
41
42
43
44
Acknowledgments
This research has been supported by the