 Type V myosin focuses the polarisome and shapes the tip of yeast cells
The Journal of Cell Biology

 ,
Jan-Michael Kromer,
Joachim Neller,
Thomas Gronemeyer,
Andrew B. Goryachev,
Nils Johnsson
,
Jan-Michael Kromer,
Joachim Neller,
Thomas Gronemeyer,
Andrew B. Goryachev,
Nils Johnsson
M. Leda and J-M. Kromer contributed equally to this paper.

- Altmetric
Dünkler et al. discover that the subunit Pea2 recruits type V myosin Myo2 to the yeast polarisome. Experimental evidence and biophysical modeling indicate that this interaction generates an actin-dependent force to physically compact and thus spatially focus the polarisome and to mold the bud into its characteristic pointed shape.
The polarisome is a cortical proteinaceous microcompartment that organizes the growth of actin filaments and the fusion of secretory vesicles in yeasts and filamentous fungi. Polarisomes are compact, spotlike structures at the growing tips of their respective cells. The molecular forces that control the form and size of this microcompartment are not known. Here we identify a complex between the polarisome subunit Pea2 and the type V Myosin Myo2 that anchors Myo2 at the cortex of yeast cells. We discovered a point mutation in the cargo-binding domain of Myo2 that impairs the interaction with Pea2 and consequently the formation and focused localization of the polarisome. Cells carrying this mutation grow round instead of elongated buds. Further experiments and biophysical modeling suggest that the interactions between polarisome-bound Myo2 motors and dynamic actin filaments spatially focus the polarisome and sustain its compact shape.
Introduction
The polar growth of yeasts and other fungal cells is determined by the controlled insertion of plasma membrane and cell wall material. This material is transported by secretory vesicles on actin cables to the cell tip (Bi and Park, 2012; Jin et al., 2011; Pruyne et al., 2004b; Johnston et al., 1991). The Rho GTPase Cdc42 determines the general polarity of the transport by locally activating proteins that direct the actin cytoskeleton toward the front of the cell (Chiou et al., 2017). During tip growth, yeasts and filamentous fungi further concentrate these activities onto a small sector of the cortex. This focus is accomplished by the polarisome, a compact multiprotein microcompartment associated with the membrane of the growth zone (Sheu et al., 1998; Snyder, 1989; Tcheperegine et al., 2005; Fujiwara et al., 1998; Chenevert et al., 1994). The polarisome combines activities of actin filament nucleation and exocytosis to achieve spatiotemporal control of vesicle fusion. Pea2 and Spa2 form the core of this protein assembly and recruit the yeast formin Bni1, the actin nucleator Bud6, and Msb3 and Msb4, the GTPase-activating proteins (GAPs) for the Rab-GTPase Sec4 (Evangelista et al., 1997; Amberg et al., 1997; Arkowitz and Lowe, 1997; Tcheperegine et al., 2005; Moseley and Goode, 2005; Fujiwara et al., 1998; Valtz and Herskowitz, 1996; Sheu et al., 1998). Yeast cells lacking any of these proteins grow round instead of ellipsoid-shaped buds (Tcheperegine et al., 2005; Neller et al., 2015; Sheu et al., 2000).
The polarisome also links the kinases of the cell wall integrity pathway to the bud tip to control the inheritance of the cortical ER and possibly to coordinate membrane insertion with cell wall synthesis (Li et al., 2013; van Drogen and Peter, 2002; Sheu et al., 1998; Hruby et al., 2011). Recently, new members and functions of the polarisome were added. Epo1 binds Pea2 and links the cortical ER to the cell tip (Chao et al., 2014; Neller et al., 2015). Aip5 binds Spa2 and supports the Bni1–Bud6 complex during actin polymerization (Glomb et al., 2019; Xie et al., 2019).
By taking a well-delimited compact shape throughout bud formation and expansion, the polarisome shares features with other membraneless compartments. Like the polarisome, these compartments are thought to regulate cellular pathways by bringing together their major components in one cellular site. Membraneless compartments with a polar cellular localization have recently been shown to form by nonequilibrium liquid-liquid phase separation regulated by the expenditure of cellular energy (Brangwynne et al., 2009; Hyman and Brangwynne, 2011; Zwicker et al., 2014; Saha et al., 2016). However, other ways to couple the hydrolysis of ATP or GTP to the entropy-reducing formation of polar cellular structures are also known (Goryachev and Pokhilko, 2008; Kirschner and Mitchison, 1986). What are the forces that keep the polarisome’s position, shape, and size? Here we discover a general actomyosin-based mechanism that spatially focuses the proteins of the polarisome into a compact microcompartment.
Results
Myosin V interacts with the polarisome through Pea2
Time-lapse microscopy of Spa2-mCherry–expressing yeast cells shows that the polarisome first emerges at the incipient bud site (Video 1). The polarisome remains associated with the tip throughout bud growth (Fig. 1 A and Video 1). Its characteristic spotlike appearance is easily distinguishable from the homogeneous distribution of active Cdc42 at the bud cortex (Fig. 1 A). During G2, the polarisome disintegrates. The polarisome proteins reappear during mitosis at the bud neck (Fig. 1 A).
Time-lapse analysis of WT yeast cells expressing Spa2-mCherry. Frames were taken every 2 min, and cells were incubated at 30°C. Scale bar: 5 µm.


Myo2 binds with its CBD to Pea2. (A) Two-channel microscopy of yeast cells expressing GFP-Pea2 together with Spa2-mCherry (left), Cdc42GTP-sensor PBDGic2 (middle), or Myo2-mCherry (right). Shown are images of cells during bud site formation (left column), bud growth (middle column), or mitosis (right column). Scale bar: 5 µm. (B) Cutouts of a split-Ub array of diploid yeast cells expressing genomic Myo2CRU (CRU; C-terminal half of Ubiquitin (Cub)-R-Ura3; left panel) or a CRU fusion to a plasmid-based cargo binding domain of Myo2 (CBD; right panel) together with the indicated Nub fusions (Nub; N-terminal half of Ubiquitin). Four independent matings were arrayed as a quadruplet on medium containing 5-FOA. Colony growth indicates interaction between the fusion proteins. Cells coexpressing interacting Nub fusions are displayed in the left row (stars indicate novel binding partners). Cells coexpressing noninteracting Nub fusions are displayed in the right row. Due to the presence of the native Myo2, the interaction signals between CBDCRU and the respective Nub fusions always appear weaker. Complete analysis is shown in Fig. S1. (C) Split-Ub assay of cells coexpressing CBDCRU or CBDCRU containing selected point mutations together with the indicated Nub fusions. Cells were grown to OD600 = 1 and 4 µl or 4 µl of a 10-fold serial dilution spotted on medium containing 5-FOA. (D) Extracts of yeast cells expressing Pea2-9myc (lanes 1–3) were incubated with Glutathione-coupled Sepharose beads exposing bacterially expressed GST (lane 1), GST-CBD (lane 2), or GST-CBDY1415R (lane 3). Glutathione eluates were separated by SDS-PAGE and probed with anti-myc antibodies (lanes 1–3). The asterisk indicates a degradation product. Ponceau staining of the supernatants after elution and Western blot of the yeast extract are shown in Fig. S2 A. (E) Split-Ub assay as in B but with cells coexpressing Myo2CRU and the indicated Nub fusions in the presence (upper panel, PEA2) or absence (lower panel, pea2Δ) of PEA2. (F) Bacterially expressed GST-CBD (lanes 1–3) or GST (lanes 4–6) coupled to Glutathione Sepharose beads were incubated with bacterially expressed 6xHis-Pea2221–420 (lanes 1 and 4), 6xHis-Pea2221–350 (lanes 2 and 5), or 6xHis-Pea2351–420 (lanes 3 and 6). Glutathione eluates were separated by SDS-PAGE and stained with anti-His antibody after transfer onto nitrocellulose. Inputs of 6xHis-Pea2 fragments, GST-CBD, and GST are shown in Fig. S2 B. Black line indicates that intervening lanes have been spliced out. (G) As in C but with haploid cells expressing Nub-Pea2, Nub-Pea2Δ286–330, or Nub as negative control together with CRU fusions to CBD (first panel), Pea2 (second panel), Spa21–535 (third panel), or Bud6 (fourth panel).
Composition, structure, and stoichiometry of the polarisome are still poorly characterized. The polarisome proteins Spa2, Pea2, Bud6, Bni1, and Epo1 are known to form homodimers or homomers of unknown stoichiometries (Tu et al., 2012; Xu et al., 2004; Neller et al., 2015; Tarassov et al., 2008). Furthermore, Spa2 was shown to form condensates in vitro (Xie et al., 2019). Interestingly, we frequently observe grainy, particulate Spa2-mCherry fluorescence signal in the vicinity of the polarisome. Taken together, these observations suggest that the polarisome proteins could aggregate into spatially compact particles, polarisome nanocomplexes (PNCs) with variable copy numbers and stoichiometric ratios. We further hypothesize that growth and shrinkage of the polarisome can be viewed as net assembly or disassembly of PNCs, respectively (Video 1).
One possible explanation for the small size, round shape, and high concentration of proteins within the polarisome is the involvement of energy-consuming mechanisms mediated, for example, by molecular motors. Indeed, the budding yeast type V myosin Myo2, but not the type II myosin Myo1, colocalizes with the polarisome at all stages of bud morphogenesis (Fig. 1 A; Schneider et al., 2013; Fang et al., 2010).
Seeking to explore a potential role of Myo2 in shaping the polarisome, we performed a protein–protein interaction screen for binding partners of Myo2. A mating-based split-Ubiquitin (split-Ub) array revealed, besides other potential binding partners, a strong interaction signal between Myo2 and Pea2 (Figs. 1 B and S1; and Table S1; Johnsson and Varshavsky, 1994; Wittke et al., 1999; Dünkler et al., 2012). The interaction could be localized to the Myo2 cargo-binding domain (Myo2-CBD, residues 1,152–1,574; Pashkova et al., 2006; Fig. 1 B). Myo2-CBD displays three distinct, partially overlapping binding sites. Site I binds to the Rab GTPases Sec4, Ypt32, Ypt31, and Ypt32; the microtubule adaptor Kar9; and the peroxisomal receptor Inp2. Site II binds to the mitochondrial and vacuolar receptors Mmr1 and Vac17, and site III binds exclusively to the exocyst subunit Sec15 (Jin et al., 2011; Fagarasanu et al., 2009; Eves et al., 2012; Lipatova et al., 2008; Tang et al., 2019). By changing central residues that specifically affect the interaction with known ligands for each site, we were able to identify binding site I of Myo2 as a potential interface for Pea2 (Fig. 1 C; Jin et al., 2011). Pull-downs of Pea2 from yeast extracts with the native or mutated CBD carrying an exchange of the central Y1415 in site I (CBDY1415R) confirmed that site I is responsible for binding Pea2 (Figs. 1 D and S2 A). If Pea2 is the direct interaction partner of the polarisome for Myo2, its absence should abolish the interaction between Myo2 and further subunits of the polarisome but should not affect interactions with other partners of Myo2. Accordingly, cells lacking Pea2 lost the interaction between Spa2 and Myo2 (Fig. 1 E). In contrast, the split-Ub generated interaction signals between Myo2CRU and the Nub fusions of Kar9, Sec4, Sro77, Smy1, Kel2, Vac17, or Sph1, a sequence homologue of Spa2, were not visibly altered by the absence of Pea2 (Fig. 1 E; Roemer et al., 1998; Beningo et al., 2000; Korinek et al., 2000; Beach et al., 2000).

Screening for interaction partners of Myo2. (A) Split-Ub interaction assay of 548 yeast strains coexpressing PMET17-Myo2CRU (left) or PMET17-CBDCRU (right) each with a different Nub fusion protein. In each case, cells of four independent matings were spotted as quadruplets on SD medium containing 5-FOA, 150 µM copper sulfate, and 70 µM methionine. Shown is the growth of the diploid yeast cells after 3 d at 30°C. Growth indicates protein–protein interaction. (B) Matrix revealing the identities of the respective Nub-fusions in A.

Defining the interfaces between Myo2 and Pea2. (A) Upper panel: Ponceau staining of GST (lane 1) or GST fusions to CBD (lane 2) and CBDY1415R (lane 3) used for pull-downs shown in Fig. 1 D. Equal fractions of the elutions from Glutathione Sepharose beads were separated by SDS PAGE and transferred onto nitrocellulose. Lower panel: Anti-myc staining of unbound Pea2-9myc of the pull-down shown in Fig. 1 D. Loading as in upper panel. (B) Upper panel: Anti-His Western blot of the unbound 6His-Pea2221–420 (lane 1), 6His-Pea2221–350 (lane 2), and 6His-Pea2351–420 (lane 3) used in the pull-down of Fig. 1 F. Shown are the supernatants after incubation with immobilized GST-CBD. Lower panels: Ponceau staining of GST-CBD and GST used for the pull-downs shown in Fig. 1 F after elution from beads, SDS-PAGE, and transfer onto nitrocellulose. (C) Extended split-Ub assay of Fig. 1 G with centromeric plasmids containing indicated Nub-Pea2 fragments in haploid yeast cells expressing CBD, Pea2, Spa21–535, and Bud6CRU. (D) Extended split-Ub assay of Fig. 2 B with indicated CBDCRU mutants tested against Nub-Pea2, -Sec4, -Ypt11, -Ypt31, -Ypt32, and -Vac17.
The region between position 249 and 416 of Pea2 has a high propensity to form coiled coils (Newman et al., 2000). Split-Ub and pull-down analyses restricted the corresponding interface for Myo2-CBD onto a segment of Pea2 that reaches into the predicted coiled-coil region (Pea2221–350; Fig. 1, F and G; and Fig. S2, B and C). The interaction analysis of bacterially expressed Pea2 fragments confirmed that the region between residues 221 and 350 (Pea2221–350) of Pea2 binds directly to Myo2 (Figs. 1 F and S2 B). Split-Ub analysis distinguishes this binding site from Pea2’s other interfaces for Spa2, for Bud6, or for itself (Figs. 1 G and S2 C).
A mutation in the cargo domain of Myo2 disrupts the interaction with Pea2
To obtain mutants of Myo2 that are specifically deficient in their interactions with Pea2, we exchanged side chains of residues surrounding Y1415 on the surface of Myo2-CBD and measured their influence on the interaction with Pea2, the Rab GTPases, or Vac17 (Fig. 2, A and B; and Fig. S2 D). Split-Ub binding assays defined a hydrophobic patch of three residues in Myo2 that are essential for binding Pea2 and Sec4 (Fig. 2, A and B). This patch is flanked by a phenylalanine in position 1,334 and an arginine in position 1,419 that belong to Myo2’s interface to Pea2 but do not contribute to binding the Rab-GTPases or Vac17 (Figs. 2 B and S2 D). F1334, but not R1419, is also part of Myo2’s interface for Kar9 (Eves et al., 2012). To disrupt the Myo2–Pea2 complex, we thus focused on position 1,419 and replaced the arginine in the genomic MYO2 by either alanine (myo2RA) or aspartate (myo2RD). As predicted, both mutations selectively impaired the interaction between the full-length Myo2 and Pea2 (Fig. 2 C). A pull-down of the enriched 6His-tagged Myo2-CBD or Myo2-CBDRD by GST-Pea2221–350 confirmed the influence of R1419 on the Myo2–Pea2 interaction in vitro (Fig. 2 D). As PEA2 is a non-essential gene (Valtz and Herskowitz, 1996), neither of the two mutations in the CBD of Myo2 affected cell growth or survival (Video 1 and Video 2)

A mutation in the CBD of Myo2 that impairs the interaction with Pea2. (A) Summary of the mutation analysis. Left: Structure of the surface of CBD (Pashkova et al., 2006). Residues that exclusively contact Sec4 are colored yellow; those that exclusively contact Pea2 are colored red. Residues contacting both proteins are orange. Residues with no impact on binding are blue. Right: Blow-up of the Myo2 interface showing position and identities of exchanged residues. Color code as in left panel. (B) Dissection of Pea2 binding site. Yeast cells containing centromeric CBDCRU plasmids with the indicated point mutations and expressing Nub-Pea2 or Nub-Sec4 were analyzed as in Fig. 1 C. (C) Split-Ub assay as in B but with cells expressing Nub-Sec4 or Nub-Pea2 and CRU fusions to the genomic MYO2 carrying no exchange (upper panel), the R1419A exchange (middle panel), or the R1419D exchange (lower panel). (D) Myo2RD affects Pea2 binding in vitro. Upper panel: 6xHis fusion to CBD (lanes 1, 3, and 5) or CBDRD (lanes 2, 4, and 6) were purified from E. coli and incubated with GST-Pea2221–350 (lanes 3 and 4) or GST-coupled beads (lanes 5 and 6). Glutathione eluates were separated by SDS-PAGE, transferred onto nitrocellulose, and stained with anti-His antibody. Lower panel: Coomassie staining of the GST fusion proteins after elution from the beads.
Time-lapse analysis of myo2RD cells expressing Spa2-mCherry. Frames were taken every 2 min, and cells were incubated at 30°C. Scale bar: 5 µm.
Pea2 anchors Myo2 at the cell cortex to focus growth at the tip
The discovered Pea2–Myo2 interaction could be most readily interpreted as required for the delivery of Pea2 by Myo2 along the actin cables to the bud tip. Indeed, time-lapse fluorescence microscopy shows that Myo2 and Pea2 arrive at the incipient bud site simultaneously (Fig. S3 and Video 3). Surprisingly, during mitosis, Pea2 arrives at the bud neck shortly before Myo2 (Fig. S3 and Video 3). Furthermore, we found that the timing of arrival of Pea2 at both the incipient bud site and the neck are unchanged in cells carrying myo2RD (Fig. S3 and Video 4). These observations are inconsistent with the hypothesis that Myo2 transports Pea2 to the polar growth zones.
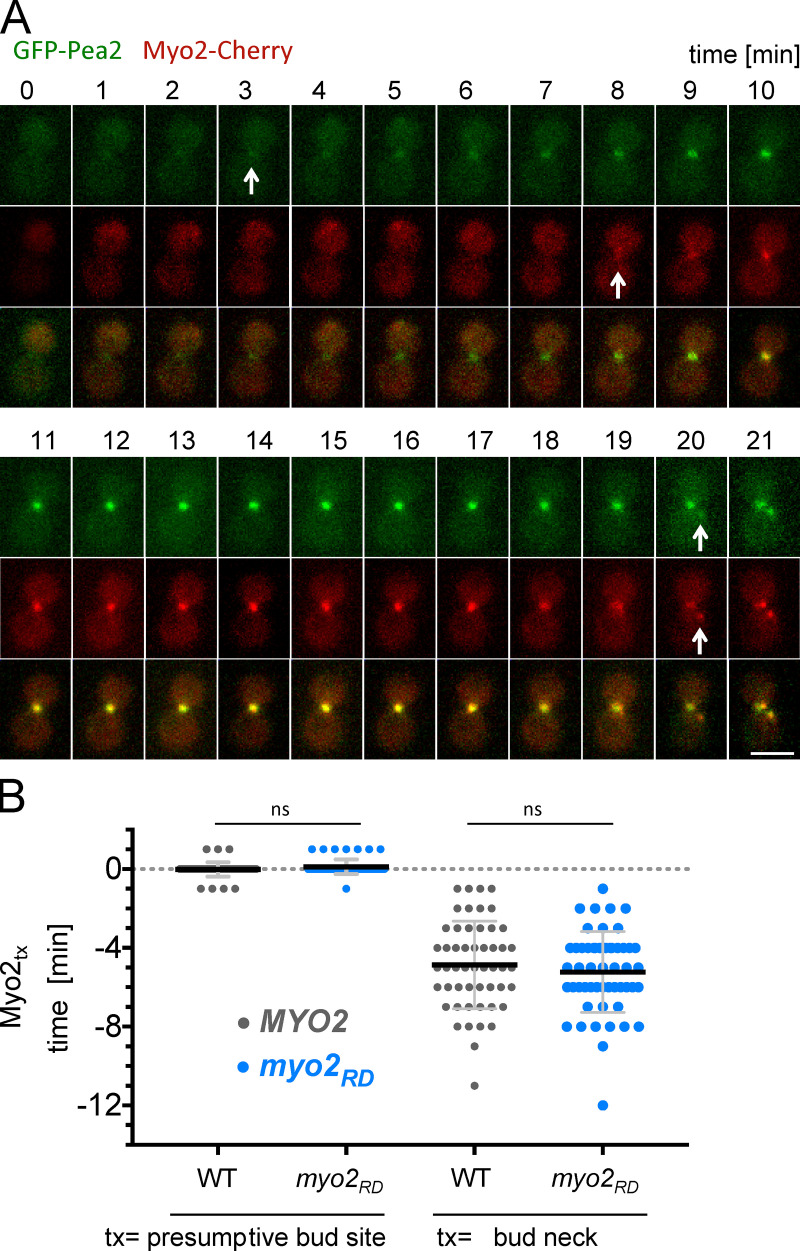
The order of appearance of Myo2 and Pea2 at bud neck and presumptive bud site. (A) Time-lapse analysis of cells coexpressing GFP-Pea2 and Myo2-mCherry in WT cells. Arrows indicate the first visible GFP or mCherry signal occurring during cytokinesis at the bud neck (minutes 3 and 8) and in G1 during assembly of the presumptive bud site (minute 20). Scale bar: 3 µm. (B) Appearance of Myo2-mCherry (Myo2tx) compared with GFP-Pea2 at the presumptive bud site and bud neck in WT and myo2RD cells. Myo2 and Pea2 appear simultaneously at the presumptive bud site in WT cells (0.02 min, n = 53) and myo2RD cells (−0.11 min, n = 54). During cytokinesis, Myo2-mCherry appears 4.87 min after GFP-Pea2 at the bud neck of WT cells (n = 52) and 5.23 min after GFP-Pea2 at the bud neck of myo2RD cells (n = 53). Error bars are SD. ns, not significant (one-way ANOVA followed by Tukey’s multiple comparison test).
Time-lapse analysis of yeast cells expressing GFP-Pea2 and Myo2-mCherry. Frames were taken every 2 min, and cells were incubated at 30°C. Scale bar: 5 µm.
Time-lapse analysis of yeast cells expressing GFP-Pea2 and Myo2RD-mCherry. Frames were taken every 2 min, and cells were incubated at 30°C. Scale bar: 5 µm.
Careful examination revealed round rather than elliptic bud shapes of the myo2RD and myo2RA cells, indicating an even instead of a more pointed bud expansion of WT cells (Fig. 3 A). The morphology of myo2RD and myo2RA cells thus demonstrates a striking resemblance to the morphology of pea2Δ cells, or cells lacking other core components of the polarisome (Sheu et al., 2000; Neller et al., 2015). Accordingly, the GFP fusions to Spa2, Bud6 and Pea2, although still predominantly found at the bud cortex of myo2RD cells, lacked the pronounced focusing at its center (Fig. 3 B, Video 2, and Video 4). The cortical fractions of Spa2 and Pea2 were more equally spread, and the amount of both proteins in the cytosol of mother cells increased (Fig. 3, B and C; and Fig. S4 A). The comparison between the cellular intensity profiles of Myo2-GFP and its mutant revealed a less prominent tip localization and a higher concentration of Myo2RD-GFP in the mother cell (Fig. 3, B and D; and Fig. S4 A).

Pea2 recruits Myo2 to the cortex. (A) Upper panel: Length/width ratios of buds of WT (mean 1.07; n = 244), pea2Δ (0.88; n = 189), pea2Δ286–330 (0.85; n = 260), myo2RA (0.91; n = 234), and myo2RD(0.89; n = 247) cells. Error bars indicate SD of the mean. Lower panel: DIC pictures of cells of the corresponding genotypes. Scale bar: 5 µm. (B) Representative fluorescence images of small budded WT or myo2RD cells expressing GFP-Pea2, Myo2-GFP, Spa2-GFP, or Bud6-GFP. Scale bar: 5 µm. (C) Plot profile of the distribution of Myo2-GFP in WT (gray line, n = 12) or myo2RDcells (blue line, n = 12). RFI of single cells was measured along the shortest distance from bud tip to neck (red arrow) and normalized to 1. Error bars indicate SD of the mean. (D) Quantification of GFP-Pea2 and Spa2-GFP fluorescence intensities along the cortex of WT (gray) and myo2RD cells (blue). Each oval plot profile (red curved arrow in the upper cartoon) shows the mean of n = 12 single normalized profiles. Error bars indicate SD (light gray and blue) of the mean. (E) Disruption of the Pea2–Myo2 complex impairs Myo2’s association with the cortex. Left: FLIP analysis of Myo2-GFP in WT (n = 20), myo2RD (n = 23), and pea2Δ cells (n = 32). Photobleaching of mother cells was done every 5 s, and z-stack images were taken every second. Curves are the fitted mean of single measurements. Right: Calculated FLIP half-times of Myo2-GFP in WT (33.8 s), myo2RD (19.9 s), and pea2Δ cells (16.8 s). Error bars are SD. ns, not significant; ***, P < 0.001 by one-way ANOVA followed by a Kruskal-Wallis comparison test (A) or Turkey’s multiple comparisons test (E).

Myo2 focuses the polarisome at the cortex. (A) Distribution of the GFP fusions to Myo2, Pea2, Spa2, and Bud6 in WT and myo2RD cells. The ratios of the RFIs of mother/daughter of Myo2-GFP (nWT =75, nmyo2RD =87), GFP-Pea2 (nWT = 87, nmyo2RD = 118), Spa2-GFP (nWT = 110, nmyo2RD = 190), and Bud6-GFP (nWT = 91, nmyo2RD = 80) show significantly smaller values in WT than in myo2RD cells, indicating a higher concentration of the GFP fusion proteins in the bud of WT cells. (B) FLIP measurement of GFP-Pea2 in WT and myo2RD cells. Left: Curves are the fitted mean of single measurements of the RFI in WT (n = 12) and myo2RD (n = 22) cells. Mother cells were continuously photobleached every 5 s, and z-stack images were taken every second. Right: The calculated FLIP half-times of GFP-Pea2 in WT cells (72.0 s) and myo2RD cells (70.9 s). Error bars are SD. ***, P < 0.001; **, P < 0.01; ns, not significant (one-way ANOVA followed by Tukey’s multiple comparison test).
Based on these observations, we hypothesized that the interaction between Myo2 and Pea2 occurs predominantly at the cell cortex and plays a role in the spatial focusing of the polarisome during bud growth. To quantitatively probe the impact of the Pea2–Myo2 interaction on the cortical anchorage of both proteins, we monitored the loss of their GFP fusions from the bud by continuously photobleaching the fluorescent population in the mother cell (fluorescence loss in photobleaching [FLIP]; Fig. 3 E). FLIP revealed that the time of depleting Myo2-GFP (as measured by t1/2FLIP) was roughly halved in the absence of PEA2 (34 vs. 17 s; Fig. 3 E; Donovan and Bretscher, 2012). Accordingly, the t1/2FLIP of Myo2RD was close to the t1/2FLIP of the WT protein in pea2Δ cells (20 vs. 17 s). At the same time, GFP-Pea2 was more tightly associated with the cortex than Myo2 (72 vs. 34 s), and its t1/2FLIP was not affected by the R1419D mutation in Myo2 (t1/2FLIP Pea2 in myo2RD cells = 71 s; Fig. S4 B). We conclude that Pea2 retains Myo2 at the cortex of the bud.
Myo2 requires actin binding to focus the polarisome at the cell tip
Based on these experiments, we hypothesized that Myo2 drags the more peripheral PNCs along actin cables toward the tip of the bud. To test the postulated actin dependence of our model, we introduced the temperature-sensitive myo2-66 allele into our strain JD47 (Fig. 4 A; Johnston et al.,1991). myo2-66 carries a single mutation that specifically reduces its affinity for actin filaments (Reck-Peterson et al., 2001). The analysis of Spa2-mCherry–expressing cells at restrictive temperature revealed that, like myo2RD cells, myo2-66 cells display a round bud and a mislocalized polarisome (Fig. 4 B). However, in addition to the spread cortical localization as seen in myo2RD cells, we observed Spa2-mCherry prematurely at the bud neck, as clusters at variable positions on the cortex, and randomly scattered in the bud (Fig. S5 A). The expression of Myo2 or Myo2RD fully rescued the temperature sensitivity of the myo2-66 strain (Fig. 4 A). The expression of Myo2 also reverted polarisome size and bud shape of myo2-66 cells to WT (Fig. 4, B–D). In contrast, the expression of Myo2RD left the round morphology of myo2-66 cells unchanged (Fig. 4 B). Importantly, Myo2RD converted the disorganized appearance of the polarisome typical of myo2-66 into a cortically spread distribution indistinguishable from that seen in myo2RD cells (Fig. 4, B–D). Both effects occurred at permissive (27°C) and restrictive (31°C) temperatures. These experiments prove that Myo2 has to bind to actin filaments and to Pea2 to be able to focus the polarisome at the tip of the cell.

Actin is required for polarisome focusing. (A) myo2-66 cells carrying an empty plasmid or expressing MYO2 or myo2RD from the genomic URA3 locus were spotted in 10-fold serial dilutions on SD-Ura− plates containing 70 µM methionine and incubated for 3 d at either 25°C (upper panel) or 30°C (lower panel). (B) myo2-66 cells carrying an empty plasmid or expressing MYO2 or myo2RD from the genomic URA3 locus and coexpressing Spa2-mCherry were analyzed by fluorescence microscopy at either 27°C (left panel) or 31°C (right panel). Insets show the DIC image of the same cell in reduced magnification. (C) Intensity profiles of the Spa2-mCherry signals of the bud circumference of the cells in B at 27°C. (D) The polarisome distribution in the bud of the cells from B was classified as focused (gray), cortically spread (spread, blue), or diffuse (black; 27°C: nempty = 226, nMYO2 = 232, nmyo2RD = 225; 31°C: nMYO2 = 223, nmyo2RD = 224). (E) Left: Fluorescence microscopy of WT, bni1Δ, or bni1Δ1240–end cells expressing Spa2-GFP. Right: Intensity profiles of Spa2-GFP of the bud circumference of the cells from the left panel. (F) The polarisome distribution of the cells from E were classified as either focused (gray) or cortically spread (spread, blue; nWT = 234, nbni1Δ = 234, nbni1Δ1240–end = 227). (G) The actin cytoskeleton of WT (upper panel) or myo2RD cells (lower panel) was stained with Alexa Fluor 488–phalloidin in the absence (left) or presence (right) of CK-666. All scale bars: 5 µm.
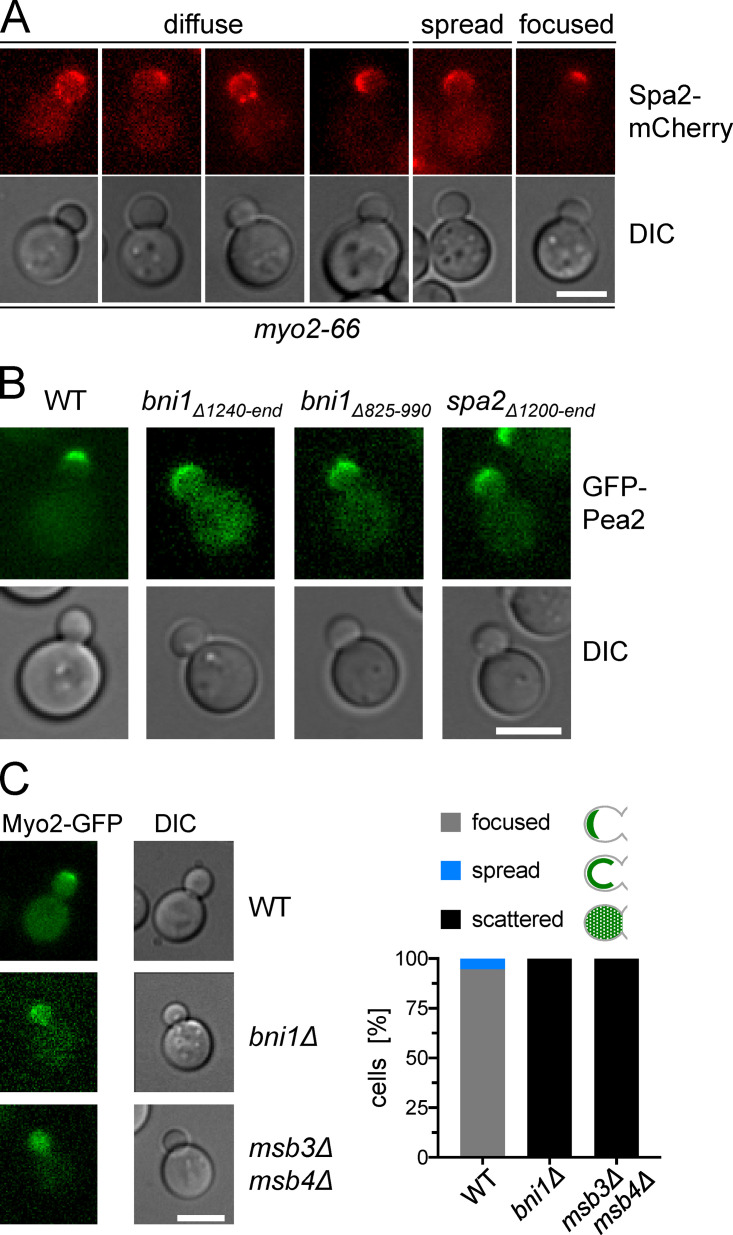
The focused distribution of the polarisome is actin dependent. (A) Images of myo2-66 cells from Fig. 4 D at 27°C categorized as displaying a diffuse (Spa2-mCherry at bud neck, in misplaced clusters, or scattered), a cortically spread, or a focused distribution of Spa2-mCherry. (B) As in Figs. 4 E and 6 F but showing the representative images of cells expressing GFP-Pea2. (C) The distribution of Myo2 is altered in bni1Δ and msb3Δ msb4Δ cells. Left: Fluorescence microscopy of WT, bni1Δ, or msb3Δmsb4Δ cells expressing Myo2-GFP. Right: Quantification of cells from the left panel displaying focused, cortically spread, or scattered Myo2-GFP distributions (nWT = 237, nbni1Δ = 239, nmsb3Δ msb3Δ = 228). All scale bars: 5 µm.
Bni1 is the bud-localized yeast formin that promotes the elongation of actin filaments at the bud tip (Pruyne et al., 2004a). The deletion of BNI1 or its C-terminal FH1 and catalytically active FH2 domain (bni1Δ1240–end) abolished the focused localization of Spa2-GFP and GFP-Pea2 and led to round buds (Fig. 4, E and F; and Fig. S5 B; Evangelista et al., 1997; Pruyne et al., 2002). These observations further support the conclusion that the generation of actin filaments at the cell tip is required for the polarisome’s compact shape at the cortex of the bud. To find out whether the location of Myo2 at the cell tip might reciprocally influence the organization of actin, we compared the actin cytoskeleton between WT and myo2RD cells by Alexa Fluor 488–phalloidin staining. With the caveat that only conventional fluorescence microscopy was used, we observed no obvious differences between the actin cytoskeletons of the two strains (Fig. 4 G). Removing the actin patches by administration of CK-666 and thereby increasing the visibility of the actin cables did not change this interpretation (Fig. 4 G; Hetrick et al., 2013).
The Myo2–Pea2 interaction is sufficiently strong to enable polarisome focusing
Our observation that an actin-Myo2-Pea2 complex contributes to spatial focusing of the polarisome let us propose that Pea2-anchored Myo2 drags PNCs on actin cables along the cell cortex. To enable such a motion, binding of Pea2 should activate Myo2 and should be sufficiently strong and persistent. Furthermore, Myo2 bound to Pea2 should retain the full ability to walk along actin cables. To test our hypothesis, we resorted to a Pex3-Pea2 fusion construct that displayed Pea2 on the surface of peroxisomes (Pea2-peroxisomes; Fig. 5 A; Luo et al., 2014; Glomb et al., 2020). If our three assumptions are correct, the cellular localization of Pea2-peroxisomes should be altered by a Myo2-dependent transport along the actin cables. Indeed, WT cells normally contain on average seven peroxisomes that are uniformly distributed between the mother cell and the bud (Fig. 5, A and B). Number, distribution, and localization of the peroxisomes were not changed in cells expressing Myo2RD, indirectly confirming that the residue exchange does not affect the interaction between Myo2 and Inp2, the receptor for Myo2 at the peroxisome (Fig. 5, A–C; Fagarasanu et al., 2009). In contrast, Pea2-peroxisomes were concentrated in WT cells in one or two spots, typically just below the bud tip (Fig. 5, A–C). We could not distinguish from the images whether these spots represent clusters of single peroxisomes or one large peroxisome. Introducing the myo2RD allele into these cells increased the number of visually distinct peroxisomes and partially restored their spatially homogeneous cellular localization (Fig. 5, A–C). We conclude that Pea2-peroxisomes recruit Myo2 in its active conformation to pull the peroxisomes on actin cables toward the tip of the bud. Thus, the Myo2–Pea2 interaction is sufficiently strong and persistent to also be able to translocate PNCs along the cortex of the cell.
![The Pea2-Myo2 complex can walk on actin cables.
(A) Left: Experimental setup. Pea2 was fused to a fragment of Pex3 and thus coupled to peroxisomes (Pex31–35-mCherry-Pea2 [Pex-Pea2]). Right: WT cells or myo2RD cells coexpressing Pex or Pex-Pea2 together with the peroxisomal import substrate GFP-SKL were analyzed by two-channel fluorescence microscopy. Scale bar: 5 µm. (B) mCherry-stained peroxisomes were quantified in WT or myo2RD cells expressing either Pex (nWT = 228; nmyo2RD = 215), or Pex-Pea2 (nWT = 214; nmyo2RD = 215). ns, not significant; ***, P < 0.001 (one-way ANOVA followed by Dunn’s multiple comparison test). (C) The distribution of mCherry-stained peroxisomes between mother and daughter cells was determined in WT or myo2RD cells expressing either Pex (nWT = 228; nmyo2RD = 215) or Pex-Pea2 (nWT = 214; nmyo2RD = 215).](/dataresources/secured/content-1765988911554-102f7243-8704-478f-9a0e-dd24c3e20857/assets/JCB_202006193_Fig5.jpg)
The Pea2-Myo2 complex can walk on actin cables. (A) Left: Experimental setup. Pea2 was fused to a fragment of Pex3 and thus coupled to peroxisomes (Pex31–35-mCherry-Pea2 [Pex-Pea2]). Right: WT cells or myo2RD cells coexpressing Pex or Pex-Pea2 together with the peroxisomal import substrate GFP-SKL were analyzed by two-channel fluorescence microscopy. Scale bar: 5 µm. (B) mCherry-stained peroxisomes were quantified in WT or myo2RD cells expressing either Pex (nWT = 228; nmyo2RD = 215), or Pex-Pea2 (nWT = 214; nmyo2RD = 215). ns, not significant; ***, P < 0.001 (one-way ANOVA followed by Dunn’s multiple comparison test). (C) The distribution of mCherry-stained peroxisomes between mother and daughter cells was determined in WT or myo2RD cells expressing either Pex (nWT = 228; nmyo2RD = 215) or Pex-Pea2 (nWT = 214; nmyo2RD = 215).
A biophysical model explains polarisome focusing
To examine under which conditions the interaction between Pea2 and Myo2 could enable spatial focusing of the polarisome, we developed a simple biophysical model. We assumed that PNCs initially occupy an extended cortical domain with the dimensions several times exceeding that of a typical polarisome. We then asked whether the interaction of Pea2-bound Myo2 with dynamic actin cables can result in self-organization of a single, stable polarisome of a submicrometer size. Following Amberg (1998) and Pruyne and Bretscher (2000), we posited that the cables run close to the cortex for ∼1 µm until they diverge from the cortex into the cytoplasm (Fig. 6 A). In our stochastic model, the PNCs comprise distinct particles of subdiffraction size. PNCs include multiple copies of Pea2-bound Myo2 motors that can interact with a nearby actin cable (Fig. 6 A, inset). Following earlier work in fission yeast (Vavylonis et al., 2008), we assume that viscous friction of the membrane-associated PNCs prevents Pea2-bound Myo2 motors from walking processively and, instead, forces them to operate near stall, inducing their detachment from actin cables after each work cycle. Thus, in the model, PNCs either slowly move along the stationary cables, when bound to them, or randomly diffuse on the cortex, when free. Because PNCs also contain formin Bni1 and the nucleation-promoting factor Bud6, they nucleate actin cables and anchor them on their surface. We hypothesize the existence of a positive feedback loop in polarisome focusing by postulating that the probability to nucleate a cable at a particular cortical locus is proportional to the number of PNCs at this locus. Once nucleated, a cable extends with a constant velocity in a randomly picked direction. With a fixed probability, a cable can detach from the PNCs while continuing to transport secretory vesicles to the bud tip (see Materials and methods for the modeling details and Table S2 for the model parameters).

Biophysical model of polarisome focusing. (A) Cortical PNCs are moved by Myo2 motor proteins along actin cables. (B) Model simulation shows transition of a random initial condition with 0–5 particles per mesh node (left) to the single focused polarisome (right). Actin cables are shown by arrows. Color encodes number of particles per node as indicated by the color bar. Entire simulation is shown in Video 5. (C) Time course of the calculated radius of the polarisome particle cluster. (D and E) Probability to form a single stable polarisome as a function of indicated model parameters. Color encodes the probability as indicated by the color bar. (F) Left: Fluorescence microscopy of WT, bni1Δ825–990, spa2Δ1200–end, or msb3Δ msb4Δ cells expressing Spa2-GFP. Right: Polarisome distributions of the cells from the left panel (nWT = 234, nbni1Δ825–990 = 151, nspa2Δ1200–end = 154, nmsb3Δ msb3Δ = 230) were classified as either focused (gray) or cortically spread (spread, blue). Scale bar: 5 µm.
Stochastic simulations with extensively varied parameters demonstrated four distinct classes of model behavior: (1) no focusing of PNCs, or formation of (2) multiple dynamic foci or (3) a single rapidly moving polarisome and, finally, (4) a single stable polarisome. Initial and final states of the model typical of class 4 behavior are shown in Fig. 6 B. The spatial distribution of cables need not be highly ordered to achieve self-organized focusing of the polarisome (see also Video 5). Time series of the radius of the spatial distribution of polarisome particles (Fig. 6 C) shows that focusing stops at some characteristic size that remains stable thereafter despite the continuous formation and detachment of dynamic cables.
Biophysical model of polarisome focusing. Stochastic simulation starting with 0–5 PNCs per mesh node and ending with a single focused polarisome.
To analyze the model behavior, we first abrogated the positive feedback by assuming that the cable nucleation probability is independent of the local number of polarisome particles. Under this assumption, cables were nucleated at random spatial cortical locations and produced no focusing of PNCs, regardless of the other parameters. We then systematically varied model parameters and automatically classified the simulation outcomes to determine the probability of formation of a single stable polarisome. The increase in the total number of cables always promotes polarisome focusing (Fig. 6 D). Variation of the cable detachment rate, however, exhibits a clear optimum. This is because exceedingly dynamic cables fail to substantially alter spatial distribution of polarisome particles before they detach, whereas overly stable cables generate multiple disjoint polarisome foci. Thus, intermediate cable lifetimes provide both efficient transport and plasticity necessary for polarisome formation. The focusing is maximal when the particle diffusion coefficient and the velocity along cables are both within their optimal ranges (Fig. 6 E). Taken together, our modeling results show that the interaction between the polarisome-bound Myo2 motors and actin cables can result in a very efficient spatial focusing of polarisome, provided that the dynamics of actin cables and mobility of PNCs are optimized by their coevolution.
Positive feedback between polarisome localization and cable formation is required for the Pea2–Myo2 complex–dependent polarisome focusing
The physical association between cable formation and polarisome focusing constitutes the positive feedback whose abrogation is predicted to result in polarisome defocusing. We tested these predictions of the model by measuring the distribution of Spa2-GFP and GFP-Pea2 in strains lacking the Spa2 binding site of Bni1 (bni1Δ825–990) or by analyzing Spa2 mutants lacking the Bni1 binding site (spa2Δ1200–end-GFP; Fujiwara et al., 1998). Indeed, in complete agreement with our predictions, both strains exhibited a round bud and a cortically spread distribution of Spa2-GFP and GFP-Pea2 (Figs. 6 F and S5 B). As we already demonstrated that targeted disruption of the Pea2–Myo2 interaction results in polarisome defocusing, we sought an independent approach to test the role of Myo2. Our results showed that Sec4 and Pea2 might compete for binding to Myo2, since they share a common binding interface. Promoting the Sec4–Myo2 interaction should then reduce the Pea2–Myo2 interaction and, therefore, decrease polarisome focusing. Because Myo2 interacts predominantly with Sec4-GTP, we deleted the polarisome-localized GAPs Msb3 and Msb4 that convert Sec4 into its inactive, GDP-bound form (Jin et al., 2011; Gao et al., 2003). This manipulation was already shown to increase the stability of the Myo2–Sec4 complex in cells (Donovan and Bretscher, 2015; Donovan and Bretscher, 2012). Strikingly, the msb3Δ msb4Δ cells showed broadening of the polarisome, similar to that of both the bni1Δ and myo2RD strains (Fig. 6 F). In agreement with our expectations, Myo2-GFP changes its tip-centered position in WT cells toward a more diffuse distribution in the buds of msb3Δ msb4Δ and bni1Δ cells (Fig. S5 C).
Pea2 recruits Myo2 to the site of cell fusion during mating
Surprisingly, we did not find any effect of myo2RD on the spatial focusing and size of the polarisome from its emergence at the insipient bud site until the small bud stage (Video 2). This suggests that, at these stages of morphogenesis, polarisome size is not determined by the interaction between Myo2 and Pea2 and may instead depend on distinct biophysical mechanisms. We thus sought out other morphogenetic scenarios under which formation and size of the polarisome are affected by the Myo2–Pea2 interaction.
Polarisome formation can be studied during the mating of yeast cells (Gehrung and Snyder, 1990). The advantage of studying mating is that the behavior of WT cells and cells with mutated polarisomes can be compared within the same mating experiment. Neighboring a and α cells grow mating projections toward each other until both cells reach physical contact and fuse to form a diploid cell (Fig. 7 A; Martin, 2019). Polarisomes form at the prospective mating projections of both cells and stay at their tips during growth and cell fusion (Fig. 7 A; Valtz and Herskowitz, 1996; Sheu et al., 2000; Gehrung and Snyder, 1990). GFP-Pea2 and Myo2-GFP accumulated with similar kinetics at the mating projection of WT cells before post-Golgi vesicles started to expand the mating tip (Fig. 7 A). When mated with unlabeled WT cells, Myo2RD-GFP appeared considerably later at the prospective mating projection than Pea2-GFP (Fig. 7 A). The arrival of Myo2RD-GFP coincided with the arrival of secretory vesicles at the onset of tip expansion (Fig. 7 A). Subsequent vesicle accumulation and the rate of tip growth were indistinguishable between WT and mutant cells (Fig. 7 A).

Myo2 stimulates polarisome formation during mating. (A) Left: Experimental setup. Right: MATa or MATa-myo2RD cells expressing GFP-fusion to Pea2 (orange), Myo2 (not depicted), or Sec4 (not depicted) were mated with WT MATα cells, and the fluorescence intensity was recorded every 2 min. The time of cell fusion was set to t = 0. Right: Fluorescence intensity profiles during mating of MATa or MATa-myo2RD cells expressing Myo2-GFP (nWT = 13; nmyo2RD = 15), GFP-Pea2 (nWT = 13; nmyo2RD = 14), or GFP-Sec4 (nWT = 14; nmyo2RD = 13). The highest-intensity value of each single curve for each GFP fusion was normalized to 100 to then calculate the mean of the ensemble. Error bars are SD. Indicated is the significance of the difference between the values of GFP-Pea2 in WT and moy2RD cells (yellow symbols), between Myo2-GFP and Myo2RD-GFP (blue symbols), and between GFP-Sec4 in WT and myo2RD cells (red symbols) at minutes −10, −22, and −54. (B) Fluorescence microscopy of Spa2-GFP–expressing MATa cells and Spa2-mCherry–expressing MATα cells during mating and cell fusion. The first appearance of Spa2 at the prospective mating projection differed between the genotypes of the mated cells. Upper panel: WT-WT. Middle panel: myo2RD-myo2RD. Lower panel: myo2RD-WT. Each time series starts with the first visible Spa2 signal. DIC images of the contact sites are shown below. Scale bar: 5 µm. (C) Quantification of the data from B. Comparison of the dwell times of the Spa2-GFP/Spa2-mCherry fluorescence at the mating projections from first appearance to cell fusion: a-WT(Spa2-GFP) × α-WT(Spa2-mCherry): 42.3/42.3 min (n = 29); a-myo2RD (Spa2-GFP) × α-myo2RD (Spa2-mCherry): 56.5/55.1 min (n = 31); a-myo2RD (Spa2-GFP) × α-WT (Spa2-mCherry): 40.3/53.9 min (n = 35). (D) Quantification of the data from B. Difference between the first appearance of Spa2-GFP and of Spa2-mCherry measured for each mating experiment of the different genotype combinations. Error bars are SD. (E) Left: Signal width of Spa2 fluorescence at the fusion site. Right: Total width of the fusion pores calculated from DIC pictures. Values were derived from matings of WT × WT cells and myo2RD × myo2RD cells, 2 min before fusion. Error bars are SD. (F) Efficiency of mating: MATa and MATα strains of identical genotypes were mated for 4 h at 30°C and plated on solid medium selecting for diploid zygotes. Colony numbers from WT matings were set to 100% efficiency. Error bars are SD. ns, not significant; ***, P < 0.001; **, P < 0.01; *, P < 0.05 (one-way ANOVA followed by Tukey’s multiple comparison test).
To directly address the influence of Myo2 on the assembly of the polarisome, we followed polarisome formation by comparing the appearance of Spa2-GFP and Spa2-mCherry at the mating projections of interacting a and α cells (Fig. 7 B). During mating between WT cells of opposite mating types, and between myo2RD cells of opposite mating types, Spa2 appeared in both cell types at roughly the same time (Fig. 7, B–D; and Video 6). However, during mating between WT and myo2RD cells, the appearance of the Spa2 spot was delayed by ∼14 min in myo2RD cells and formed opposite an already existing polarisome of the WT cells (Fig. 7, B–D; and Video 7). When inspecting mating between a and α myo2RD cells, we observed not only a larger lag between polarisome formation and cell fusion but also broader Spa2-GFP/mCherry–stained regions of the cortex at the fusion zones and wider pores between the fused cells (Fig. 7 E; Gammie et al., 1998). Quantitative mating assays showed that the observed defects in polarisome formation correlated with a substantially reduced mating efficiency of myo2RD cells (Fig. 7 F).
Mating of WT a and α cells expressing Spa2-GFP or Spa2-mCherry, respectively, at 30°C. Frames were taken every 2 min. Scale bar: 5 µm.
Mating of MATa-myo2RD cells expressing Spa2-GFP with MATα-WT cells expressing Spa2-mCherry at 30°C. Frames were taken every 2 min. Scale bar: 5 µm.
Discussion
Taking into account the estimates of secretory vesicle turnover, the target size of vesicle fusion, and the elasticity and turgor of the cell, one can already calculate the shape and growth of pollen tubes, yeast cells, and the hyphae of fungi (Campàs and Mahadevan, 2009; Minc et al., 2009; Okada et al., 2013). Finding a quantitative connection between these mesoscale parameters and the molecular properties of the underlying network of proteins is the aim of this and other studies in yeast (Haupt and Minc, 2018; Abenza et al., 2015).
The width of the polarisome determines the zone of vesicle fusion and thus the shape of the tip (Pruyne et al., 2004b; Sheu et al., 2000; Köhli et al., 2008). Continuous incorporation of new membrane and the subsequent expansion of the cell tip necessitate mechanisms that actively keep the polarisome from spreading or from losing its central position at the cortex. Post-Golgi vesicles are continuously transported by Myo2 on actin cables to the cortex of the growth zone (Schott et al., 2002; Johnston et al., 1991). Myo2 is linked to the incoming vesicles by its interactions with the active form of the Rab GTPase Sec4 and the exocyst component Sec15 (Jin et al., 2011). After tethering at the plasma membrane, Myo2 remains associated with the vesicle for ∼12–18 s before GTP hydrolysis relieves Myo2 from the bound Sec4GTP (Donovan and Bretscher, 2015). Decreasing the rate of Sec4GTP hydrolysis extends the residence time of Myo2 at the daughter cell (Donovan and Bretscher, 2015). These observations were taken as evidence that Myo2 stays at the cortex only through its interaction with the tethered vesicle and that its function at the cortex is restricted to support tethering and eventually docking of these vesicles to the plasma membrane. Our data suggest, however, that Myo2 is additionally anchored by the polarisome subunit Pea2 at the cell tip, where it uses its actin-dependent force to structure the polarisome and thus the architecture of the vesicle receiving and docking zone. Pea2 will bind to Myo2 only after GTP hydrolysis of Sec4 has cleared the shared binding site and Myo2 is detached from the vesicle (Donovan and Bretscher, 2012). This handover mechanism will create a high local concentration of Pea2–Myo2 complexes that pull the associated PNCs toward the center of the microcompartment, where most of the actin filaments are generated. The movement toward the center will concentrate more of the actin nucleation factors Bni1 and Bud6 to the bud tip, thus creating a positive feedback loop.
Our model explains why the extra stabilization of the Sec4–Myo2 interaction through the loss of the Sec4 GAPs Msb3 and Msb4 dissolves the focused shape of the polarisome and induces the formation of round buds. It also explains why the same phenotypes are observed in cells that lack the physical connection between the polarisome and the actin nucleation and elongation factor Bni1. In support of our model, Yu et al. (2011) observed Myo2-dependent sliding of actin cables along the cortex of yeast cells. The required association with the cortex might be provided by the connection discovered here between Myo2 and the polarisome proteins. The resulting concentration of the plus ends of actin filaments could enforce the pull on PNCs toward the polarisome center.
The proposed mechanism has several biophysical features in common with the search, capture, pull, and release (SCPR) model proposed by Vavylonis et al. (2008; reviewed in Pollard and O’Shaughnessy, 2019) for the formation of the fission yeast contractile ring. Importantly, like Vavylonis et al. (2008), we find that for the successful formation of the protein assembly in question, it is absolutely necessary that the interaction between the cortical particles and actin cables is highly dynamic. Capture of cables by polarisome particles (cortical nodes) must frequently alternate with cable detachment (release) to avoid formation of multiple small contractile foci instead of a single polarisome or actomyosin ring. However, in the case of polarisome, the prominence of actin tracks and the particles that use them for congression is reversed. Indeed, the size of polarisome nanoparticles is smaller than that of the Schizosaccharomyces pombe cortical nodes, which are robustly discernible by fluorescence microscopy, whereas actin cables are fewer and much longer than the actin fibers that were inferred to connect cytokinetic nodes. Furthermore, unlike the SCPR mechanism that involves contractile type II myosin, polarisome focusing relies on a type V myosin that normally delivers cargo. Curiously, attachment to the multiprotein particles that resist motion likely forces both motor proteins into a near-stall regime in which the difference between the two types of myosins effectively vanishes.
The contribution of Myo2 to the de novo formation of the polarisome became evident from studying the mating of yeast cells. In WT cells, Myo2 and the polarisome arrive together before post-Golgi vesicles accumulate at the prospective mating projection, whereas the delayed arrival of Myo2RD seems to postpone the formation of the polarisome. The extended time between polarisome formation and cell fusion is observed only in cells mating with myo2RD cells. This effect might be caused by the close communication and synchronization of activities between the two cells during mating.
We postulate that the same mechanisms that keep the shape of the mature polarisome might also stimulate the emergence of a new one. This activity might be less important during bud site assembly, in which formation of the polarity patch is more rigidly defined by landmark proteins (Lai et al., 2018; Chiou et al., 2017). The when and where of polarisome nucleation might depend on physical links between PNCs and Cdc42GTP and/or Bem1 (Evangelista et al., 1997; Grinhagens et al., 2020).
The defining droplet-like properties of membraneless compartments are determined by liquid-liquid phase separation (Banani et al., 2017; Hyman and Brangwynne, 2011). The actomyosin dependence of its shape argues that polarisomes do not belong to this class of bimolecular condensates. However, as many aspects of the exact regulation of size, shape, and composition of the polarisome remain to be explored, it is still possible that the predicted coiled-coil elements in the polarisome components Spa2, Pea2, Bni1, Bud6, and Epo1 drive phase separation during the initial formation of the polarisome scaffold (Sheu et al., 1998; Neller et al., 2015; McSwiggen et al., 2019; Banani et al., 2017; Xie et al., 2019; Newman et al., 2000). Myo2 might then use the interaction with Pea2 to mechanically promote phase separation of PNCs and keep the position and shape of the polarisome condensate despite the constant influx of secretory vesicles and the associated expansion of the adjacent membrane.
Materials and methods
Growth conditions, cultivation of yeast strains, and genetic methods
All yeast strains were derivatives of JD47, a segregant from a cross of the strains YPH500 and BBY45, and are listed in Table S3 (Dohmen et al., 1995). Yeast strains were cultivated in SD or YPD medium at the indicated temperatures. Medium preparation followed standard protocols (Glomb et al., 2020). SD medium for split-Ub assays contained in addition 1 mg/ml 5-fluoro-orotic acid (5-FOA; Formedium). Gene deletions and promoter replacements by PMET17 were performed by homologous integration of the cassettes derived by PCR from the plasmids pFA6a-hphNT1, pFA6a-natNT2, pFA6a-kanMX6, pFA6a-CmLEU2, or pYM-N35 (Bähler et al., 1998; Janke et al., 2004). Escherichia coli XL1 blue cells were used for plasmid amplification and grown at 37°C in LB medium containing antibiotics. E. coli BL21 cells were used for protein production and were grown in LB or SB medium at 37°C.
Generation of plasmids and yeast strains
Detailed lists of all primers and plasmids from this study are provided in Table S4. Genomic gene fusions were obtained as described (Wittke et al., 1999; Dünkler et al., 2012; Neller et al., 2015; Moreno et al., 2013). In brief, fusions of GFP, CRU, or 9xMYC to MYO2, SPA2, PEA2, or BUD6 were constructed by PCR amplification of the respective C-terminal ORFs without stop codon from genomic DNA. The DNA fragments obtained were cloned via EagI and SalI restriction sites in front of the CRU, GFP, mCherry, or 9xMYC module on a pRS303, pRS304, or pRS306 vector (Wittke et al., 1999). The plasmids were linearized using a single restriction site within the C-terminal genomic DNA sequence and transformed into yeast. Successful integration was verified by PCR of single yeast colonies with diagnostic primer combinations using a forward primer annealing in the target ORF but upstream of the linearization site and a reverse primer annealing in the C-terminal module. Gene deletions were obtained by replacing the ORF through single-step homologous recombination with an antibiotic resistance cassette derived by PCR from the plasmids pFA6a-hphNT1, pFA6a-natNT2, pFA6a-kanMX6, pFA6a-CmLEU2, or pYM-N35 (Bähler et al., 1998; Janke et al., 2004).
The insertion of GFP between the PEA2 upstream sequence and the start codon of PEA2 was achieved by the Cre/loxP recombination system (Gueldener et al., 2002). A PCR fragment generated from the pGFP-loxP-natCUP sequence was placed in front of the genomic PEA2 by homologous integration. Subsequent expression of Cre-recombinase (pSH47) deleted the natNT2-PCUP1 sequence and led to the in-frame fusion of GFP to PEA2. The pea2Δ286–330 allele was generated by a delitto perfetto standard protocol (Storici and Resnick, 2006). Strains myo2-66, bni1Δ825–900, bni1Δ1240–end, and spa21200–endΔ were constructed by CRISPR/Cas9 manipulation using plasmid pML104 containing specific 20mer gRNA sequences (Laughery et al., 2015).
GFP-Sec4 and PBDGic2-RFP were expressed in yeast by genomic integration of plasmids pSec4prom-Sec4-GFP306 or YIp211-GIC2-PBD-1.5tdTomato into the ura3-52 locus (Glomb et al., 2020). myo2R1419A (myo2RA), myo2R1419D (myo2RD), and MYO2WT alleles were obtained by recombination of PCR fragments generated from plasmids pFA-Myo2-CBD(R1419A)-hph, pFA-Myo2-CBD(R1419D)-hph, or pFA-Myo2-CBD(WT)-hph using a forward primer starting at amino acid 1,152 and a standard reverse S2 primer annealing to the MYO2 terminator. The chimeric pPMET-Pex31-45-mCherry 306 plasmid was adapted from Luo et al. (2014; Glomb et al., 2020). PEA2 was amplified from genomic DNA and inserted in frame behind the mCherry tag using BamHI/SalI restriction sites. The plasmid was subsequently inserted into the yeast ura3-52 locus by homologous recombination.
Mating efficiency
Saturated o/n cultures of WT JD47 (MATa) and ULM53 (MATα) cells, or a and α cells each expressing the alleles myo2R1419D or pea2Δ, were diluted to an OD600 of 0.4 and grown for 4 h at 30°C. Cells were adjusted to an OD600 of 1, and equal quantities of JD47 and ULM53 cells were mixed and incubated for 4 h at 30°C in YPD. Cells were diluted 1/20, and 250 µl of each mating mixture was spread on medium selecting for diploids. Colonies were counted after 2 d at 30°C.
In vivo split-Ub interaction analysis
Large-scale split-Ub assays were performed as described (Dünkler et al., 2012). A library of 548 different α-strains each expressing a different Nub fusion were mated with a Myo2CRU or a CBDCRU–expressing a-strain. Diploids were transferred as independent quadruplets on SD medium containing 1 mg/ml 5-FOA and different concentrations of copper sulfate to adjust the expression of the Nub fusions. For small-scale interaction analysis, a- and α-strain–expressing Nub or Cub fusion constructs were mated, or fusion constructs were coexpressed in haploid strains. Cells were spotted onto SD-FOA medium in four 10-fold serial dilutions starting from OD600 = 1. Growth was recorded at 30°C every day for 2–5 d.
Point mutations were introduced into the CBD of MYO2 by overlap-extension PCR spanning CBD (1152–end). PCR products were ligated via EagI/SalI restriction sites between the sequences of the PMET17 promoter and the CRU module on a pRS313 vector (Wittke et al., 1999). The centromeric plasmids were transformed into Nub-Pea2, -Sec4, -Ypt11, -Ypt31, -Ypt32, and -Vac17 strains and tested for binding.
In vitro binding assays
Yeast cell extracts
Pellets from exponentially grown cultures of Pea2-9myc–expressing yeast cells were resuspended in yeast extraction buffer (50 mM Hepes, 150 mM NaCl, and 1 mM EDTA) with 1× protease inhibitor cocktail (Roche Diagnostics) and vortexed together with glass beads (threefold amount of glass beads and extraction buffer to pellet weight) 10 times for 1 min, interrupted by short incubations on ice. Extracts were clarified by centrifugation at 16,000 g for 8 min at 4°C and directly used for pull-down assays.
E. coli extracts
E. coli BL21 cells (GE Healthcare) expressing GST or 6xHis fusions were grown to an OD600 of 0.8 at 37°C in 2YT or LB (6xHis fusions) or at 18°C overnight in SB medium (6xHis-CBD/6xHis-CBDRD). Protein synthesis was induced by the addition of IPTG. 2% ethanol was added for 6xHis-CBD– and 6xHis-CBDRD–expressing cells. Cell pellets were processed directly or stored at −80°C. Pellets were washed once with 1× PBS, resuspended in 1× PBS containing protease inhibitor cocktail (Roche Diagnostics), and lysed by lysozyme treatment (1 mg/ml for 30 min on ice), followed by sonication with a Bandelin Sonapuls HD 2070 (Reichmann Industrieservice). Extracts were clarified by centrifugation at 40,000 g for 10 min at 4°C.
GST-Pea2221–350, GST-Pea2221–420, and Pea2351–420 were purified by affinity chromatography on a 5-ml GST-Trap column on an Äkta purifier chromatography system, followed by size exclusion chromatography on a Superdex 200 16/60 column (GE Healthcare) versus HBSEP buffer (10 mM Hepes, pH 7.4, 150 mM NaCl, 3 mM EDTA, and 0.05% Tween 20). For pull-down analysis, the protein was buffered into PBS using a NAP5 column (GE Healthcare).
6xHis-CBD and 6xHis-CBDRD were lysed in IMAC Buffer A (50 mM KH2PO4, pH 8.0, 300 mM NaCl, and 20 mM imidazole) by lysozyme treatment and sonication, followed by IMAC purification on an Äkta purifier chromatography system using a 5-ml HisTrap Excel column (GE Healthcare). The column was washed by a linear imidazole gradient (20–70 mM), followed by elution in 200 mM imidazole. Eluted proteins were subsequently transferred into PBS buffer using a PD10 column, concentrated, and used for pull-down.
Binding assay
All incubation steps were performed under rotation at 4°C. GST-tagged proteins were immobilized on 100 µl Glutathione–Sepharose beads in 1× PBS (GE Healthcare) directly from E. coli extracts. As a control, GST alone was immobilized in equal amounts. After incubation for 1 h at 4°C with either yeast extracts or purified proteins, the beads were washed three times with the respective buffer. Bound material was eluted with GST elution buffer (50 mM Tris and 20 mM reduced glutathione) and subjected to SDS-PAGE followed by Coomassie Blue staining and Western blot analysis using an anti-His antibody (Sigma-Aldrich) or anti-MYC antibodies (Hruby et al., 2011).
Actin staining
Exponentially grown cells were fixed for 10 min by adding 3.7% formaldehyde to the medium. Cells were resuspended in 3.7% formaldehyde (in 100 mM KH2PO4) and incubated for 1 h before buffer was exchanged to 1 µM ethanolamine (in 100 mM KH2PO4) for 10 min. Cells were washed twice with PBS and incubated with 66 nM Alexa-fluorophore–conjugated phalloidin (Thermo Fisher Scientific) for 30 min or overnight at 4°C. Actin patches were removed by addition of 100 µM CK-666 (Merck) to the cell medium at 30°C, 10 min before cells were fixed.
Fluorescence microscopy
Microscopic observations were performed with an Axio Observer spinning disc confocal microscope (Zeiss) equipped with an Evolve512 electron-multiplying charge-coupled device camera (Photometrics), a Plan-Apochromat 63×/1.4 oil differential interference contrast (DIC) objective, and 488- and 561-nm diode lasers (Zeiss). Operations were performed with the ZEN2012 software package (Zeiss). Time-resolved imaging was performed with a DeltaVision system (GE Healthcare) provided with an IX71 microscope (Olympus), equipped with a Cascade II 512 electron-multiplying charge-coupled device camera (Photometrics), a 100× UPlanSApo 100× 1.4 oil ∞/0.17/FN26.5 objective (Olympus), a steady-state heating chamber, and a Photofluor LM-75 halogen lamp. Exposure time was adapted to every individual GFP- and mCherry-labeled protein to reduce bleaching and phototoxicity.
Yeast cultures were grown overnight in SD medium, diluted 1:8 in 3–4 ml fresh SD medium, and grown for 2–6 h at 30°C to mid-log phase. 1 ml cell culture was spun down and resuspended in 50 µl remaining medium. 3 µl of this suspension was transferred onto a microscope slide, covered with a glass coverslip, and inspected. For time-lapse analysis, cells were immobilized with a coverslip on custom-designed glass slides containing solid SD medium with 1.8% agarose. For temporal and spatial analysis of mating events, a and α cells were grown in SD to mid-log phase, and equal amounts of cells were mixed shortly before agarose slide preparation. Images were obtained with a series of seven or five z-slices and a distance of 0.4 or 0.7 µm between each z-slice.
Photobleaching experiments
FLIP experiments were performed using an Axio Observer spinning-disc confocal microscope (Zeiss), equipped with a Zeiss Plan-Apochromat 63Å∼/1.4 oil DIC objective, a 488-nm diode laser, and an UGA-42 photomanipulation system (Rapp OptoElectronic; Phair et al., 2004). Images were acquired at room temperature every second with a series of five z-slices, each separated by 0.4 µm, and an excitation power of 12–20% depending on the strain. Six image layers were taken before the region of interest (ROI; mother cell) was initially bleached with 60–80% laser power. Four to five image layers were subsequently acquired, and bleaching events were continuously repeated every 5 s until a stable plateau of fluorescence intensity was reached in the daughter cell. Data processing (sum-projection and fluorescence signal quantification) was performed using Fiji 2.0. All datasets were double normalized using Excel. The software Prism 6.0 (GraphPad) was used for the fitting of the double-normalized data to a one-phase association curve.
Quantitative analysis of microscopy data
Microscopy files were analyzed and processed using ImageJ64 1.49 or Fiji 2.0 (National Institutes of Health). Images were acquired as adapted z-series and SUM-projected to one layer. For the quantitative comparison of the mean fluorescent intensities, two ROIs were determined: first, the signal of interest (tip or bud neck), and second, a region within the cytosol. The mean gray values of both ROIs were quantified, and background intensity (cytosol) was subtracted. Relative fluorescence intensity (RFI) values were obtained by normalizing measured values to 1 or 100.
Fluorescence signal distribution within the bud was obtained by analyzing the images using ImageJ64 plugins line profile or oval plot profile. Oval plot profile settings were number of points = 360 and maximum intensity. Fluorescence signal values were normalized to 1, and the average of n = 12 single measurements was calculated.
Statistical evaluation
All statistical evaluations were performed using Prism 7 (GraphPad). D’Agostino and Pearson normality tests were used to analyzes the distributions of the datasets. Gaussian-distributed data were analyzed by t test, whereas Mann–Whitney U test was used for data that did not pass this criterion. For comparison of more than two datasets, one-way ANOVA or Kruskal–Wallis ANOVA tests were applied.
Modeling
In our model, we assumed that Myo2 and Pea2 create a stable complex, which is associated with the polarisome particles that also contain Bni1 and other polarisome proteins. The particles are confined to the cell cortex and may freely diffuse within it or be dragged along actin cables, when Myo2 motors are engaged with them. Because the particles interact with the plasma membrane and contain multiple copies of several polarisome proteins, both their myosin-motored advection velocities and the free diffusion coefficients are expected to be considerably smaller than the typical velocity of a single Myo2 motor (∼2 µm/s) and the characteristic diffusion coefficient of a membrane protein (0.01–0.1 µm2/s), respectively (Table S2; Vavylonis et al., 2008). Simulations are performed on a rectangular 2D domain of size Nx × Ny (where Nx = Ny = 30 and the mesh size dx = 0.1 µm) with the periodic boundary conditions.
Our stochastic model is formulated as follows: (1) The probability of cable nucleation at a particular cortical locus (mesh node) is proportional to the number of polarisome particles at this node with the coefficient kn (Table S2). Upon cable nucleation, one of the eight possible elongation directions (along the mesh dimensions and diagonally) is selected from the uniform random distribution. No two cables can nucleate from the same cortical locus, and the total number of cables that can exist simultaneously is restricted to Nmax. (2) A cable elongates with the rate ke until it reaches the length Nmax, after which it is assumed that the cable elongates into the cytoplasm, which is not simulated explicitly. (3) Cable detaches from the polarisome particles with the rate kd. Detached cables are assumed to remain attached to the cortex outside of the simulation domain, e.g., at the mother-bud neck, and continue to direct the delivery of secretory vesicles and other cargo until they eventually depolymerize. All polarisome particles that were attached to the cable before its detachment remain at their respective mesh nodes. (4) Advection of polarisome particles along cables occurs at the rate kan, where n is the number of particles at the mesh node (Table S2). We do not explicitly consider particles bound to a cable and free particles as separate species. Instead, we assume that binding to a cable is in the fast equilibrium (Vavylonis et al., 2008), so the number of bound particles is equal to
Stochastic simulations are performed using a first-reaction Gillespie algorithm. At each simulation step, tentative times are computed for the following events: 4NxNy diffusion events, NxNy cable nucleation events, Nc(t) cable elongation events, Nc(t) cable detachment events, and
Phase diagrams in Fig. 6 (D and E) were created as follows. Simulations were run for 60 min of model time. Temporal averages of the number of particles for the last 1 min for each mesh node were created. The resulting matrix N(i,j) was then binarized with a threshold equal to 10 (0 if <10 particles per mesh node; 1 otherwise). If the given stochastic simulation produced a single cluster of 1’s, then it was assumed that simulation converged to a single stable polarisome and was scored as 1; otherwise, 0. Clustering was performed using Matlab bwconncomp function. Fig. 6 (D and E) presents the probability to converge to a single stable polarisome computed over 30 stochastic realizations for every combination of the model parameters shown.
Our model treats the interaction of particles and cables in a way similar to the SCPR model by Vavylonis et al. (2008). However, because in our model the particles are smaller than the cortical nodes and actin cables are fewer than the filaments connecting the nodes, we neglect the possibility that a single polarisome particle can interact with more than one cable at the same time. A distinct stochastic model was proposed to simulate the delivery of polarisome proteins from the cytoplasm to the cortex along actin cables, which were not modeled explicitly (Lawson et al., 2013). As that model did not consider translocation of polarisome particles in the plane of the cortex, and our model assumes that the polarisome particles are already deposited on the membrane, the two models are orthogonal and cannot be directly compared.
Online supplemental material
Fig. S1 shows the systematic split-Ub analysis of Myo2. Fig. S2 shows the GST fusions and the unbound Pea2-9myc of the pull-down experiments of Fig. 1 E. Also shown are the split-Ub assays of different fragments of Pea2 and of the CBD of Myo2. Fig. S3 shows the timings of arrival of GFP-Pea2 and Myo2-mCherry at the incipient bud site and at the bud neck during the cell cycle. Fig. S4 shows the FLIP measurements of GFP-Pea2 in WT and myo2RD cells and the distributions of the GFP fusions of Pea2, Myo2, Spa2, and Bud6 in WT and myo2RD cells. Fig. S5 shows the distribution of Spa2-mCherry in myo2-66 cells, Myo2-GFP in bni1Δ and msb3Δ msb4Δ cells, and GFP-Pea2 in mutants of BNI1 and SPA2. Table S1 lists the interaction partners of Myo2. Table S2 lists the parameter values for the modeling. Table S3 and Table S4 list the yeast strains and constructs used and created in this study. Video 1 is a time-lapse analysis of WT yeast cells expressing Spa2-mCherry. Video 2 is a time-lapse analysis of myo2RD cells expressing Spa2-mCherry. Video 3 is a time-lapse analysis of yeast cells expressing GFP-Pea2 and Myo2-mCherry. Video 4 is a time-lapse analysis of yeast cells expressing GFP-Pea2 and Myo2RD-mCherry. Video 5 is a biophysical model of polarisome focusing. Video 6 shows mating of WT a and α cells expressing Spa2-GFP or Spa2-mCherry, respectively, at 30°C. Video 7 shows mating of MATa-myo2RD cells expressing Spa2-GFP with MATα-WT cells expressing Spa2-mCherry at 30°C.
Acknowledgments
We thank N. Schmid and S. Timmermann for technical assistance and Dr. O. Glomb for advice.
This work was funded by grants from the Deutsche Forschungsgemeinschaft to N. Johnsson (Jo 187/8-1), and by Biotechnology and Biological Sciences Research Council grants BB/P01190X and BB/P006507 to A.B. Goryachev.
The authors declare no competing financial interests.
Author contributions: Conceptualization: N. Johnsson, A. Dünkler, A.B. Goryachev; Methodology: A. Dünkler, T. Gronemeyer.; Investigation: A. Dünkler., M. Leda, J-M. Kromer, J. Neller, T. Gronemeyer; Writing – original draft: N. Johnsson; Writing – review & editing: N. Johnsson, A. Dünkler, A.B. Goryachev; Supervision: N. Johnsson, A. Dünkler, A.B. Goryachev; Funding acquisition: N. Johnsson, A.B. Goryachev.