
Competing Interests: The authors have declared that no competing interests exist.
During the past decade, the age-adjusted mortality rate for endometrial cancer (EC) increased 1.9% annually with TP53 mutant (TP53-mu) EC disproportionally represented in advanced disease and deaths. Therefore, we aimed to assess pivotal molecular parameters that differentiate clinical outcomes in high- and low-risk EC. Using the Cancer Genome Atlas, we analyzed EC specimens with available DNA sequences and quantitative gene-specific RNA expression data. After polymerase ɛ (POLE)-mutant specimens were excluded, differential gene-specific mutations and mRNA expressions were annotated and integrated. Consequent to TP53-mu failure to induce p21, derepression of multiple oncogenes harboring promoter p21 repressive sites was observed, including CCNA2 and FOXM1 (P < .001 compared with TP53 wild type [TP53-wt]). TP53-wt EC with high CCNA2 expression (CCNA2-H) had a targeted transcriptomic profile similar to that of TP53-mu EC, suggesting CCNA2 is a seminal determinant for both TP53-wt and TP53-mu EC. CCNA2 enhances E2F1 function, upregulating FOXM1 and CIP2A, as observed in TP53-mu and CCNA2-H TP53-wt EC (P < .001). CIP2A inhibits protein phosphatase 2A, leading to AKT inactivation of GSK3β and restricted oncoprotein degradation; PPP2R1A and FBXW7 mutations yield similar results. Upregulation of FOXM1 and failed degradation of FOXM1 is evidenced by marked upregulation of multiple homologous recombination genes (P < .001). Integrating these molecular aberrations generated a molecular biomarker panel with significant prognostic discrimination (P = 5.8×10⁻⁷); adjusting for age, histology, grade, myometrial invasion, TP53 status, and stage, only CCNA2-H/E2F1-H (P = .0003), FBXW7-mu/PPP2R1A-mu (P = .0002), and stage (P = .017) were significant. The generated prognostic molecular classification system identifies dissimilar signaling aberrations potentially amenable to targetable therapeutic options.
The American Cancer Society (ACS) predicted 61,880 new cases and 12,160 deaths that would be attributable to endometrial cancer (EC) in 2019 [1]. In 2018, the ACS reported an alarming 1.9% annual increase during the decade in age-adjusted mortality for EC [2]—a trajectory needing reversal. Standard treatment for high-risk EC is definitive surgery followed by systemic platinum-based chemotherapy (PbCT) or radiotherapy, or both. Sensitivity to PbCT positively correlates with deficiencies in the homologous recombination (HR) pathway [3]. However, the majority of ECs are HR proficient; thus, tailored molecular-based therapy needs to be developed, which requires identifying molecular profiles that harbor targetable aberrations.
The clinical outcomes associated with TP53 mutated (TP53-mutant [mu]) EC are strikingly worse than those observed with POLE mutations (exonuclease domain of polymerase ɛ mutant, catalytic subunit [POLE-mu]) and TP53 wild type (TP53-wt) tumors [4]. The tumor suppressor functions of TP53 include transcription activation and repression; exemplary of the former is the activation of CDKN1A, encoding p21, which targets promoter-repressive elements (cell-cycle–dependent elements [CDE] and cell-cycle genes homology region [CHR] sites), resulting in transcription repression of targeted genes [5]. Mutant TP53 is unable to activate the TP53-p21-CDE/CHR axis. Thus, TP53-mu cancers have derepression of numerous genes containing promoter CDE/CHR sites, including CDK2, CCNA2, AURKA, TPX2, PLK1, FOXM1, MASTL, and ESPL1 [5].
Upregulated CDK2 phosphorylates pRB, releasing pRB-bound E2F1, a potent transcription activator [6]. Mints et al [7] reported progressively increasing nuclear expression of E2F1 with decreasing differentiation of EC. The E2F1 mode of action is predicated on CCNA2 expression; overexpression of CCNA2 has been correlated with compromised prognosis and resistance to chemotherapy in EC [8–10]. CCNE1, AURKA, TPX2, PLK1, FOXM1, EZH2, CIP2A, BRCA1, and RAD51 have E2F1 activation sites in their promoter regions [11–14]. E2F1 activation of critical genes portends increased phosphorylation of the cohesion complex with premature chromosome separation (ie, aneuploidy) as well as FOXM1 induction of several genes in the HR pathway [15–18].
The Cancer Genome Atlas (TCGA) for EC documented the high prevalence of PIK3CA, PIK3R1, PTEN, PPP2R1A, and FBXW7 mutations, genes within the PI3K-AKT-FBW7 axis [4]. Mutations in PIK3CA, PIK3R1, and PTEN facilitate the phosphorylation and activation of AKT, which phosphorylates and inactivates GSK3β resulting in restricted FBW7-dependent degradation of oncoproteins such as CCNE1, AURKA, PLK1, FOXM1, and others [19]. AKT activation is modulated by protein phosphatase 2A (PP2A), but mutations in its subunit (PPP2R1A) or upregulation of its endogenous inhibitor (CIP2A) allow unimpeded AKT phosphorylation [20, 21]. CIP2A is reportedly activated by E2F1 [14]. Thus, AKT inactivation of GSK3β or mutation in PPP2R1A or FBXW7 results in restricted degradation and accumulation of specific oncoproteins.
Integrating the above generic TP53 mechanistic information with data available from the EC literature, we developed a working schematic (Fig 1A) for comparing the mRNA expression between TP53-mu and TP53-wt EC for numerous genes that impact cell-cycle dynamics, apoptosis, and DNA-damage repair. We identified the seminal role of CCNA2 in 1) integrating the TP53-p21-CDE/CHR and PI3K-AKT-FBW7 pathways and 2) combining with E2F1 overexpression and mutations in FBXW7 and PPP2R1A in determining outcomes of both TP53-mu and TP53-wt EC. An untoward commonality included induction of FOXM1 or failed degradation of FOXM1, or both, which portends enhanced HR gene expression and potential insensitivity to chemotherapy.

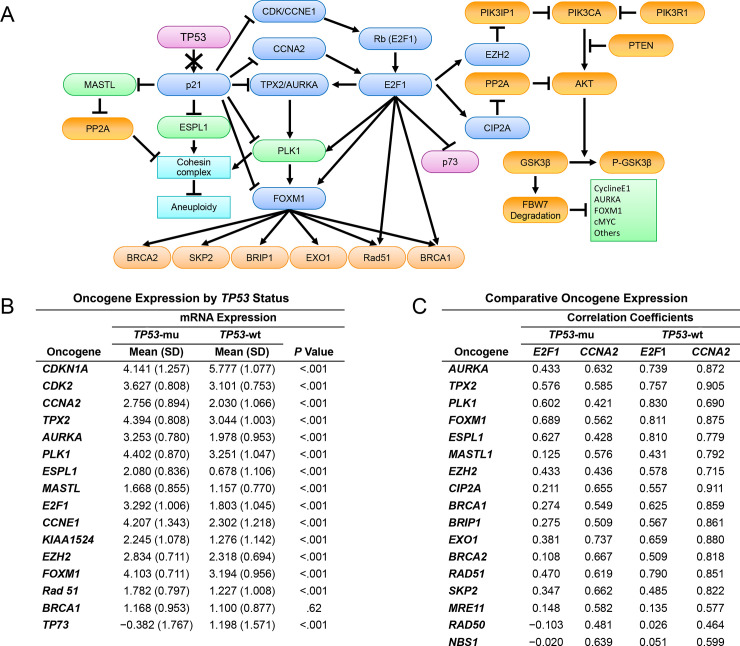
Molecular schematic and oncogene expression.
A, Integrated schematic of the TP53-p21-CDE/CHR and PIK3CA-AKT-FBW7 pathways in EC. B, Comparative analysis of the mRNA expression of oncogenes regulated directly or indirectly by the TP53-p21-CDE/CHR pathway in TP53 mutant (mu) (n = 62) vs wild type (wt) EC (n = 149) (excluding POLE mutants). C, Correlation coefficient analysis delineating relationships between differentially expressed oncogenes in TP53-mu (n = 62) and wt EC (n = 149) (excluding POLE mutants) as a function of mRNA expression of E2F1 and CCNA2 oncogenes. CDE indicates cell-cycle–dependent element; CHR, cell-cycle genes homology region; EC, endometrial cancer; wt, wild type.
We obtained and analyzed TCGA (www.cancergenome.nih.gov) data as previously described [22]. TCGA contains comprehensive genomic information including copy number variation, single-nucleotide polymorphisms, miRNA expression, gene expression, and DNA methylation data, as well as clinical and outcome information. Data from TCGA were downloaded, normalized, formatted, and organized for integration and analysis with other biological datasets in accordance with TCGA data-sharing agreements. Somatic mutations and gene expression data were recorded.
All data collection and processing, including the consenting process, were performed after approval by each of the participating institution’s local institutional review board/ethics committee and in accordance with TCGA Human Subjects Protection and Data Access Policies, adopted by the National Cancer Institute and the National Human Genome Research Institute.
Somatic mutation detection, calling, annotation, and validation from TCGA have been described [23]. Somatic mutation information resulting from exome sequencing with the Illumina Genome Analyzer DNA Sequencing GAIIx or HiSeq 2000 platforms (Illumina Inc) was downloaded and formatted for analysis. Mutation information was downloaded as level 3 or validated somatic mutations.
Of the 239 cancerous endometrial tumors included, we identified 18,388 unique genes with 138,838 validated somatic mutations, including frame-shift insertions and deletions; in-frame insertions or deletions; and missense, nonsense, nonstop, and splice-site mutations. Silent mutations were excluded from the analysis. The number of mutations for each selected gene was recorded for each patient.
Gene expression data were downloaded from TCGA data repository as level 3 RNA sequence data [4] created by Illumina RNA Sequencer HiSeq 2000 platforms (Illumina Inc) and annotated with the HG-19 version of the human genome. Normalized and log-transformed gene expression data from these endometrial tumors were available for analysis. Analyses were performed with R statistical packages (R Foundation) for statistical computing and graphics [24] and bioconductor packages as open-source software for bioinformatics [25]. For the front end, we used Biometric Research Branch Array Tools, an integrated package for visualization and statistical analysis that uses Excel (Microsoft Corp) [26].
As PbCT is the predominant adjuvant therapy for high-risk EC, which are frequently insensitive to therapy [2, 27–30], we chose cell lines recognized as platinum insensitive with identified mutational anomalies associated with adverse clinical outcomes in the study population. ARK2, a uterine serous carcinoma (USC) (type II) derived cell line, harbors mutant TP53 and wt FBXW7 and PPP2R1A (personal communication with A. Santin, Yale University) [31]. HEC-1B cells (endometrioid endometrial carcinomas [EEC]; type I) have mutations in TP53, FBXW7, and PPP2R1A [32]. Both cell lines were cultured in Dulbecco’s Modified Eagle’s Medium containing 10% fetal bovine serum, 100 mcg/mL streptomycin, 100 units/mL penicillin, and 2 mM L-glutamine. Cells were maintained in an incubator at 37°C in an atmosphere containing 5% CO2. Carboplatin and panobinostat (HDAC10 inhibitor) were purchased from ApexBio.
Total RNA was isolated using RNeasy Plus MiniK (Qiagen). cDNA was synthesized using a Reverse Transcription Kit (Applied Biosystems). Real-time polymerase chain reaction (PCR) was performed using the SYBR Green PCR Master Mix (ThermoFisher Scientific) on the LightCycler 480 (Roche Molecular Systems Inc). The sequences of primers for the analyzed genes are detailed in S1 Table.
ARK-2 cells were treated with panobinostat at 10 nM. After incubation for 3, 6, 12, and 24 hours, cell lysates were collected for protein expression analyses and compared with untreated (time = 0) controls. Expression of p21, FOXM1, acetylated-H3, and GAPDH were measured by Western blot. Antibodies used in this study were P21 (Cell Signaling Technology, 2947), FOXM1 (Cell Signaling Technology, 5436), acetyl-H3 (Millipore, 06–599), and GAPDH (Sigma-Aldrich, G8795).
Three thousand cells per well were seeded in triplicate in 96-well plates and the cells treated with increasing concentrations of panobinostat and carboplatin for 72 hours, respectively. MTT-based CellTiter 96 Aqueous One Solution Cell Proliferation Assay (Promega Corp) was performed (per manual) to assess half-maximum inhibitory concentration. Constant-ratio studies were performed to investigate the combinatory effect of carboplatin with panobinostat in HEC-1B and ARK-2 cell lines [33].
For each candidate gene surveyed, TCGA-quantitated expression levels of the corresponding mRNA were annotated for the 239 specimens. Comparisons between groups were evaluated with the χ2 test for nominal variables and the 2-sample t test for continuous variables. Correlations were quantified by using Pearson correlation coefficients. All calculated P values were 2-sided.
Statistical methods for survival data were used to analyze progression-free survival (PFS), defined as the time from surgery to disease recurrence. Patients without evidence of disease at the end of follow-up were treated as censored observations. Comparisons between Kaplan-Meier survival curves were performed with log-rank tests. For association with survival, all clinicopathologic variables were assessed with Cox proportional hazard regression. All variables associated with survival with a univariate P value ≤.05 were included in an initial multivariate regression model. Those variables with the smallest contributory effect were excluded with a backward elimination technique based on the Akaike information criterion (measure of the quality of the model for a given dataset). Hazard ratios (95% CI) were reported. Analyses were performed using R statistical computing and graphics [24].
Using TCGA for EC, we analyzed specimens with available DNA sequences and quantitative gene-specific RNA expression data [4]. Clinicopathologic characteristics of the tumors in the study population (N = 239) included 47 (26, stage 3/4) USC and 192 EEC including 72 grade 1 (4, stage 3/4), 73 grade 2 (10, stage 3/4), and 47 grade 3 (16, stage 3/4). Molecular characteristics included POLE-mu detected in 28 specimens (11.7%), TP53-mu in 70 (29.3%), microsatellite instability-high (MSI-H) in 67 (28%), and estimated copy number variation low (CNV-L) (determined by 239 –[POLE-mu + TP53-mu + MSI-H]) in 92 (38.5%). TP53-mu was identified in 41 (87.2%) USC and 29 (15.1%) EEC including 4.2% in grade 1, 12.3% in grade 2, and 36.5% in grade 3. At least 1 mutation in PIK3CA, PTEN, or PIK3R1 occurred in 83% of the specimens; 57% had a mutation in more than 1 of these genes. Because POLE-mu was associated with ultramutated status and superior outcomes [4], POLE mutants were not included in the subsequent molecular analyses except to use as a standard for comparing favorable outcomes. Thus, the primary study population consisted of 62 TP53-mu and 149 TP53-wt specimens. Of note, compared with the general EC population, the study population was weighted toward more high-risk characteristics, as shown by the enhanced prevalence of advanced disease, grade 3 histology, and USC.
To assess the validity of the proposed downstream network of TP53-mu–dependent gene alterations in Fig 1A, we compared the mean mRNA expression level of the proposed gene network in TP53-mu and TP53-wt EC, excluding POLE-mu specimens. Assessment of CDKN1A (p21) expression in TP53-mu compared with that in TP53-wt EC showed a dramatic differential consistent with the failure of mutated TP53 to induce CDKN1A (p21) (Fig 1B). Multiple genes harboring CDE/CHR p21 repressive site in their promoter regions, including CDK2, CCNA2, AURKA, TPX2, PLK1, FOXM1, ESPL1, and MASTL [5], were significantly upregulated in TP53-mu compared with TP53-wt EC. The lack of suppression of CDK2 and marked overexpression of CCNE1 and E2F1 portend the observed augmentation of multiple cell cycle (ie, AURKA, TPX2, PLK1) and other genes (ie, FOXM1, Rad51, and CIP2A [formerly KIAA1524]) harboring E2F1 transcriptional activating sites [11–14]. By contrast, the E2F1 apoptotic target TP73 is significantly suppressed in TP53-mu tumors [8].
The overexpression of E2F1 and concomitant TP73 suppression in TP53-mu EC suggested, as previously reported, upregulation of CCNA2, which determines the mode of action of E2F1 [8, 34]. Thus, we examined the correlation between reference oncogenes (E2F1 and CCNA2) and multiple direct or downstream targets of E2F1 in TP53-mu and TP53-wt EC (Fig 1C). Correlation coefficients for the reference genes in TP53-mu tumors were similarly positive with regard to cell-cycle genes, but the positivity was substantially higher for CCNA2 than E2F1 for MASTL1, CIP2A, and HR pathway genes. Unexpected were the high positive correlations in TP53-wt tumors between the expressions of CCNA2 and E2F1 targets and HR pathway genes, which paralleled the correlations in TP53-mu tumors. These results suggested a potential role for CCNA2 in the carcinogenesis of both TP53-mu and a subset of TP53-wt tumors.
The expression of multiple, upregulated oncogenes in TP53-mu EC was assessed in TP53-wt EC with high CCNA2 expression. The upper quartile of annotated CCNA2 mRNA expression levels among TP53-wt specimens (≥2.6) was arbitrarily designated as high expression (CCNA2-H). When the expression of multiple CCNA2/E2F1 target and HR-pathway genes in TP53-wt CCNA2-H and TP53-mu EC was assessed, equivalency or higher expression was shown for most assessed genes in TP53-wt CCNA2-H vs TP53-mu specimens (Table 1). Noteworthy was the dramatic upregulation of FOXM1, CIP2A, and multiple HR genes in both TP53-mu and TP53-wt CCNA2-H EC compared with TP53-wt with CCNA2 low expression (CCNA2-L).

| Cohort A | Cohort B | Cohort C | Cohort A vs B | Cohort B vs C | |||
|---|---|---|---|---|---|---|---|
| TP53 Mutants | CCNA2-High | CCNA2-Low | |||||
| (n = 62) | (n = 41) | (n = 108) | |||||
| Gene | Mean (SD) | Mean (SD) | Mean (SD) | Cohen’s da | P Value | Cohen’s da | P Value |
| TP53-p21-CDK2-E2F1/CCNA2 Pathway | |||||||
| CDKN1A | 4.141 (1.257) | 5.648 (1.070) | 5.826 (1.080) | 1.271 | < .001 | 0.165 | .37 |
| CDK2 | 3.627 (0.808) | 3.867 (0.529) | 2.811 (0.608) | 0.337 | .10 | 1.797 | < .001 |
| E2F1 | 3.292 (1.006) | 2.703 (0.938) | 1.462 (0.868) | 0.602 | .004 | 1.398 | < .001 |
| CCNA2 | 2.756 (0.894) | 3.276 (0.569) | 1.557 (0.793) | 0.665 | .001 | … | … |
| E2F1/CCNA2 Targets | |||||||
| CCNE1 | 4.207 (1.343) | 2.876 (1.085) | 2.084 (1.199) | 1.067 | < .001 | 0.678 | < .001 |
| AURKA | 3.253 (0.780) | 2.920 (0.738) | 1.621 (0.765) | 0.436 | .03 | 1.715 | < .001 |
| TPX2 | 4.394 (0.808) | 4.117 (0.654) | 2.637 (0.791) | 0.369 | .07 | 1.957 | < .001 |
| PLK1 | 4.402 (0.870) | 4.234 (0.811) | 2.877 (0.872) | 0.198 | .33 | 1.585 | < .001 |
| FOXM1 | 4.103 (0.800) | 4.229 (0.653) | 2.801 (0.733) | 0.169 | .40 | 2.003 | < .001 |
| EZH2 | 2.834 (0.711) | 2.898 (0.528) | 2.098 (0.620) | 0.098 | .63 | 1.340 | < .001 |
| CIP2A | 2.245 (1.078) | 2.435 (0.690) | 0.835 (0.956) | 0.201 | .32 | 1.794 | < .001 |
| Homologous Recombination Pathway Genes | |||||||
| MER11 | 0.975 (0.885) | 1.264 (0.537) | 0.624 (0.755) | 0.377 | .06 | 0.912 | < .001 |
| RAD50 | 1.940 (0.753) | 2.461 (0.680) | 2.021 (0.603) | 0.719 | < .001 | 0.704 | < .001 |
| NBS1 | 2.473 (0.987) | 2.987 (0.644) | 2.340 (0.836) | 0.593 | .004 | 0.820 | < .001 |
| BRCA1 | 1.168 (0.953) | 1.947 (0.744) | 0.778 (0.691) | 0.889 | < .001 | 1.656 | < .001 |
| BRIP1 | −0.354 (1.027) | 0.276 (0.805) | −1.151 (0.808) | 0.667 | .001 | 1.767 | < .001 |
| EXO1 | 1.092 (0.919) | 1.509 (0.705) | 0.023 (1.027) | 0.496 | .02 | 1.563 | < .001 |
| BRCA2 | −1.146 (1.355) | −0.395 (0.877) | −2.310 (1.200) | 0.631 | .002 | 1.708 | < .001 |
| RAD51 | 1.782 (0.797) | 2.275 (0.679) | 0.829 (0.807) | 0.655 | .002 | 1.867 | < .001 |
a Cohen’s d = the absolute value of the difference in group means divided by the pooled standard deviation; the higher the value, the greater the difference between groups: ≥0.2/<0.5, small; ≥0.5/<0.8, medium; and ≥0.8, large.
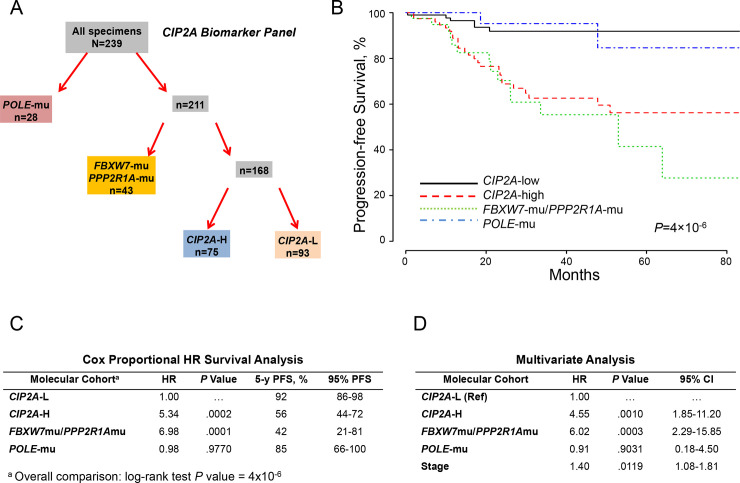
The molecular schematic suggested that the high expression of FOXM1 observed with upregulated CCNA2 expression in TP53-mu and TP53-wt (Fig 1A), combined with anticipated restricted proteosomal degradation of FOXM1 due to PPP2R1A-mu or FBXW7-mu, would unfavorably impact survival [35]. Accordingly, the study population was segregated into 4 cohorts including POLE-mu, PPP2R1A-mu/FBXW7-mu, CCNA2-H, and CCNA2-L (Fig 2A). PFS analysis for POLE mutants was as previously reported [4], but the CCNA2-H and PPP2R1A-mu/FBXW7-mu cohorts had substantially disparate outcomes compared to the CCNA2-L cohort (Fig 2B). Cox proportional hazard ratio survival analysis using CCNA2-L as the reference assigned significance for CCNA2-H (hazard ratio, 3.68; P = .0005) and PPP2R1A-mu/FBXW7-mu (hazard ratio, 4.53; P = .0002) (Fig 2C). Adjusting for age, histology, grade, myometrial invasion, TP53-mu status, and stage, independent significance (PFS) was associated with CCNA2-H (P = .0016), PPP2R1A-mu/FBXW7-mu (P = .0007), and stage (P = .0042) (Fig 2D).

Molecular classification by cohorts and outcomes (CCNA2 expression).
A, Molecular classification differentiated 4 cohorts according to POLE mutations (POLE-mu), FBXW7 and/or PPP2R1A mutations (FBXW7-mu/PPP2R1A-mu), high CCNA2 expression (CCNA2-H), and low CCNA2 expression (CCNA2-L). B, PFS as a function of time according to molecular cohorts. C, Cox proportional model analysis of the molecular classification cohorts using CCNA2-L as the reference. D, Multivariate analysis including the configured panel cohorts, age, grade, histology, myometrial invasion, TP53 status, and stage. HR indicates hazard ratio; PFS, progression-free survival.
Considering E2F1 activates CIP2A [14], which modulates the PI3K-AKT-FBW7 axis via inhibition of PP2A [20, 21], we replaced CCNA2 expression with CIP2A expression (CCNA2:CIP2A correlation coefficient, 0.893). Stratifying the molecular panel into POLE-mu, PPP2R1A-mu/FBXW7-mu, CIP2A-H, and CIP2A-L (Fig 3A) produced correspondingly significant discriminatory outcomes (Fig 3B), as judged by Cox proportional hazard ratios of 5.34 and 6.98 for CIP2A-H and PPP2R1A-mu/FBXW7-mu, respectively (Fig 3C). CIP2A overexpression and PPP2R1A-mu would portend PP2A deficiency and unimpeded activation of AKT, the latter potentially augmented by upstream dysregulated elements that initiate the PI3K-AKT kinase cascade [4, 19–21, 36, 37]. Therefore, mutant PTEN, PIK3CA, PIK3R1, and ARID1A and ERBB2 expression were included in the univariate analysis; only PTEN-mu was significant. Adjusting for age, grade, histology, myometrial invasion, TP53 and PTEN mutational status, and stage, independent significance was associated with CIP2A-H-mu (P = .001), PPP2R1A-mu/FBXW7-mu (P = .0003), and stage (P = .0119) (Fig 3D).
Molecular classification by cohorts and outcomes (CIP2A expression).
A, Molecular classification differentiated 4 cohorts according to POLE mutations (POLE-mu), FBXW7 and/or PPP2R1A mutations (FBXW7-mu/PPP2R1A-mu), high CIP2A expression (CIP2A-H), and low CIP2A expression (CIP2A-L). B, PFS as a function of time according to molecular cohorts. C, Cox proportional model analysis of the molecular classification cohorts using CIP2A-L as the reference. D, Multivariate analysis including the configured panel cohorts, age, grade, histology, myometrial invasion, TP53 and PTEN mutational status, and stage. HR indicates hazard ratio; PFS, progression-free survival.
Recognizing the seminal role of CCNA2 in regulating E2F1 and indirectly CIP2A and FOXM1 in both TP53-mu and TP53-wt EC, we postulated that high expression of either CCNA2 or E2F1 with more modest expression of the other would further discriminate outcomes. Slightly more restrictive levels for CCNA2 (≥2.75) and E2F1 (≥2.75) expression were used. This allowed stratifying EC into 4 molecular-based distinguishable cohorts (Fig 4A) associated with distinct, long-term PFS outcomes (Fig 4B). Using the low-expression cohort for CCNA2 and E2F1 (CCNA2-L/E2F1-L) as reference, Cox proportional survival analysis showed significant hazard ratios for the FBXW7-mu/PPP2R1A-mu and CCNA2-H/E2F1-H cohorts (Fig 4C). Adjusting for age, grade, histology, myometrial invasion, stage, and TP53 status, Cox analysis showed independent significance for CCNA2-H/E2F1-H (hazard ratio, 5.33; P = .0003), FBXW7-mu/PPP2R1A-mu (hazard ratio, 6.46; P = .0002), and stage (hazard ratio, 1.38; P = .0170) (Fig 4D).
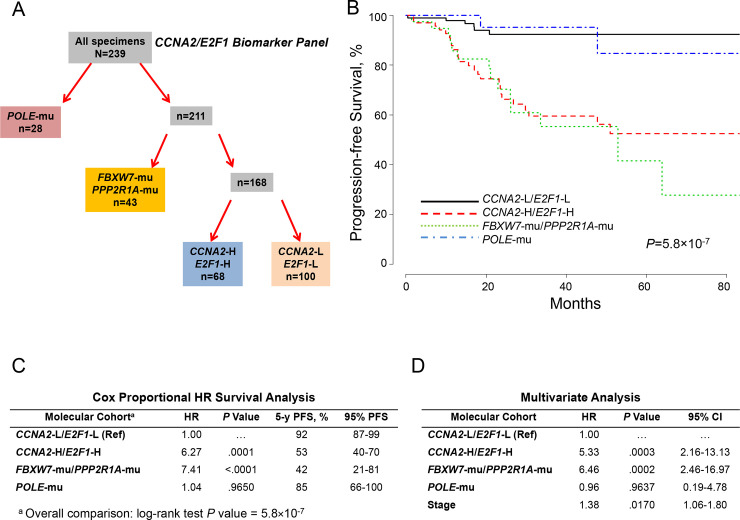
Molecular classification by cohorts and outcomes (CCNA2/E2F1 Expression).
A, Molecular classification differentiated 4 cohorts according to POLE mutations (POLE-mu), FBXW7 and/or PPP2R1A mutations (FBXW7-mu/PPP2R1A-mu/), high CCNA2 and E2F1 expression (CCNA2-H/E2F1-H), and low CCNA2 and E2F1 expression (CCNA2-L/E2F1-L). B, PFS as a function of time according to molecular cohorts. C, Cox proportional model analysis of the molecular classification cohorts using CCNA2-L/E2F1-L as the reference. D, Multivariate analysis including the configured panel, age, grade, histology, myometrial invasion, TP53 status, and stage. HR indicates hazard ratio; PFS, progression-free survival; Ref, reference.
Contemporary adjuvant therapy for low-risk EC (stage 1 or 2, grade 1 or 2) is generally limited. These low-risk tumors significantly (P < .0001) stratified according to molecular-panel cohorts. The estimated 5-year PFS for low-risk EC with the low-risk biomarker profile (CCNA2-L/E2F1-L/FBXW7-wt/PPP2R1A-wt) (n = 75) was 92% compared with 31% for the low-risk EC with the high-risk biomarker profile (CCNA2-H/E2F1-H or FBXW7-mu/PPP2R1A-mu, or both) (n = 35) (S1 Fig). By contrast high-risk EC (stage 3 or 4 and/or grade 3) are frequently managed with adjuvant PbCT. Stratified by biomarker panel profiles, high-risk patients with the low-risk biomarker profile (n = 25) appeared to respond favorably to contemporary therapy (estimated 5-year PFS, 93%) compared with those who had the high-risk biomarker profile (n = 76) (estimated 5-year PFS, 56%) (P = .023) (S1 Fig).
Considering the reported emphasis on MSI-H and CNV-L in TCGA for EC [4], we assessed PFS associated with MSI-H (excluding POLE-mu) and CNV-L for CCNA2-L/E2F1-L/FBXW7-wt/PPP2R1A-wt vs CCNA2-H/E2F1-H or FBXW7-mu/PPP2R1A-mu, or a combination. The biomarker panel cohorts separate both MSI-H (estimated 5-year PFS, 95% and 42%, respectively) and CNV-L (estimated 3-year PFS, 92% and <50%, respectively) into 2 diverse prognostic subgroups (S2 and S3 Figs, respectively), suggesting an inclusive applicability for the molecular biomarker classification panel.
FOXM1 transcription was dramatically increased in the CCNA2-H/E2F1-H cohort compared with the CCNA2-L/E2F1-L cohort. Moreover, the expression of CIP2A (formerly KIAA1524) and the genes in the HR pathway (EXO1, BRIP1, Rad51, BRCA1, and BRCA2) reportedly induced by FOXM1 [18] were significantly upregulated in both the CCNA2-H/E2F1-H and FBXW7-mu/PPP2R1A-mu cohorts compared with the CCNA2-L/E2F1-L cohort (S2 Table).
The molecular schematic (Fig 1A) predicts that CDKN1A (p21) induction in TP53-mu tumors would repress multiple oncogenes with downstream suppression of corresponding targets. Histone deacetylase inhibitors (HDACi) have been reported to induce p21 in TP53-mu cell lines [38]. The platinum-insensitive cell lines ARK-2 and HEC-1B were exposed to panobinostat, an HDAC10 inhibitor, and qPCR expression of targeted genes analyzed. Increased expression of CDKN1A (p21) with downregulation of CCNA2, E2F1, CIP2A, FOXM1, and EXO1 was observed in both cell lines (Fig 5A and 5B).
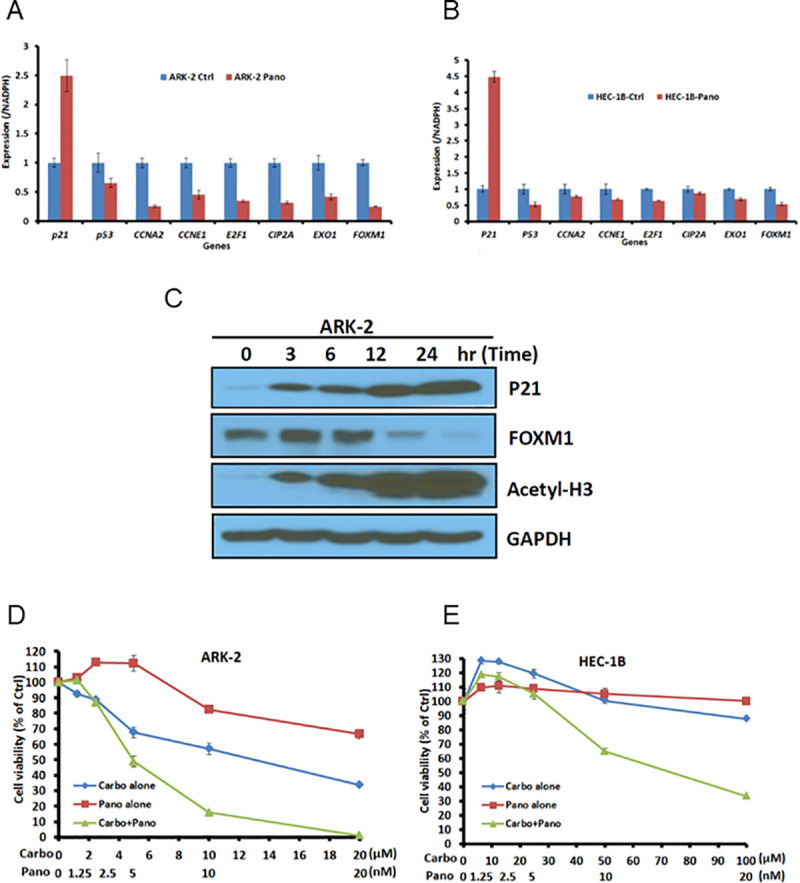
In vitro assessment of ARK-2 and HEC-1B cell line response to HDAC inhibitor.
A and B, After 24-hour exposure to panobinostat or vehicle, target-specific gene expression was determined by quantitative polymerase chain reaction in ARK-2 and HEC-1B cell lines. C, ARK-2 cells untreated or treated with 10 nM panobinostat and protein expression assessed at indicated time points (Western blot). D and E, Cell viability assays in ARK-2 and HEC-1B cell lines after exposure to panobinostat or carboplatin alone and in combination, assessed to determine synergism. Carbo indicates carboplatin; ctrl, control; pano, panobinostat.
ARK-2 cells were treated with 10 nM panobinostat and protein expression assessed via Western blot. Increased expression of p21 and acetyl-H3 and down-regulation of FOXM1 expression occurred in a time-dependent manner (Fig 5C). The stimulatory effect on p21 and the inhibitory effect of FOXM1 expression in response to panobinostat are consistent with the results observed in real-time PCR analysis (Fig 5A).
The downregulation of FOXM1 and HR pathway EXO1 with panobinostat in platinum-insensitive cell lines suggested the potential for HDACi to enhance platinum sensitivity. Synergism occurred in ARK-2 and HEC-1B cell lines exposed to varying concentrations of carboplatin and panobinostat (Fig 5D and 5E). These observations suggested that suppression of FOXM1 and HR pathway components might enhance platinum sensitivity in high-risk HR-proficient EC.
To our knowledge, this is the first report of a classification system for EC that appears to correlate with oncologic outcomes independent of patient age, histology, tumor grade, myometrial invasion, and TP53 mutational status. The discriminatory PFS value of the cohorts in the molecular biomarker panel was predicated on the overexpression of CCNA2 and E2F1 or mutations in FBXW7 or PPP2R1A. These observations constitute a mechanistic commonality regardless of TP53 status that is equally applicable in MSI-H and CNV-L cohorts. Pivotal is the interactive role of CCNA2 and E2F1 in upregulating FOXM1 transcription and inducing CIP2A activation, predictably leading to PP2A inhibition and likely restriction of FOXM1 degradation [19–21, 35, 39, 40]. The latter is likewise anticipated with FBXW7 and PPP2R1A mutations. FOXM1 reportedly induces multiple HR genes such as BRIP1, BRCA2, EXO1, and Rad51 [18], all of which were overexpressed in the poor prognostic molecular biomarker cohorts. The mechanistic molecular distillate from our observations suggests that the overexpression of multiple HR-pathway genes expectedly limits responses in the majority of HR-proficient ECs treated with DNA-damaging agents.
The 1.9% annual increase in age-adjusted mortality for EC observed over the past decade warrants reappraisal of contemporary therapeutic algorithms [2]. Our recent institutional assessments coupled with subgroup analyses in select randomized clinical trials suggest that PbCT has suboptimal efficacy for managing high-risk EC [27–30]. Considering that most EC is HR proficient [4], augmenting HR components, several of which are induced by FOXM1, would presumably enhance DNA-damage repair, yielding insensitivity to DNA-damaging agents such as platinum [18]. This study confirms the marked upregulation of HR components in high-risk EC.
The integrated signaling pathways shown in Fig 1 illustrate the mechanisms that lead to simultaneous upregulation of FOXM1 and downregulation of FOXM1 degradation in TP53-mu and TP53-wt with CCNA2-H and/or E2F1-H. The failure of TP53-mu to induce CDKN1A (p21) derepresses FOXM1, and with the upregulation of E2F1, FOXM1 expression is further augmented [18]. The mechanism of action of E2F1 is predicated on CCNA2; high CCNA2 projects a proliferative E2F1 mode [8]. E2F1 and CCNA2 were both upregulated in TP53-mu and a subset of TP53-wt EC. Overexpression of CCNA2 has previously been correlated with TP53 expression, chemoresistance, and poor prognosis in EC [9, 10]. We showed for the first time that TP53-wt EC with high CCNA2 expression is associated with molecular aberrations and clinical outcomes similar to TP53-mu EC. The mechanism responsible for high expression of CCNA2 in the subset of TP53-wt EC is unknown.
The prognostic biomarker panel that incorporates CCNA2/E2F1 upregulation and PPP2R1A/FBXW7 mutations is highly discriminatory. Without these molecular aberrations, clinical outcomes are very favorable and appear to be similar to those of POLE-mu tumors. Importantly, the majority of EC is HR proficient, which predicts a high prevalence of platinum insensitivity in biomarker panel–positive patients. Suppressing the induction of FOXM1 or enhancing degradation of FOXM1, or both, thereby downregulating HR components, might potentially facilitate conversion to platinum sensitivity. Exemplary exposure of platinum-insensitive TP53-mu EC cell lines to panobinostat [38], an HDACi currently in clinical trials, resulted in induction of CDKN1A (p21), suppression of CCNA2, CIP2A, FOXM1, and EXO1, and synergism with carboplatin at nM levels of panobinostat.
The strengths of this study include the robustness of TCGA annotated database, which includes specimens obtained at cancer centers dedicated to definitive management of patients with EC. The study is limited by the lack of biomarker-panel validation in a similar, sizeable population having definitive staging, central pathology review, standardized treatment, extended surveillance, and focused molecular analysis. The unavailability of detailed treatment algorithms and reliable long-term disease-specific survival documentation limited correlations of molecular irregularities to PFS and clinicopathologic parameters.
In summary, the integration of CCNA2 and E2F1 overexpression and POLE, PPP2R1A and FBXW7 mutations generated a molecular EC classification that projects prognostic risk, platinum insensitivity, and potential targetable therapeutic options.
The authors are appreciative of the expert advice of Ms Amy L. Weaver and Ms Michaela E. Mc Gree in assisting with the preparation of the manuscript. Portions of the Methods section were previously published in Cancer Res. 2014;74:3902–12.
| ACS | American Cancer Society |
| AURKA | aurora kinase A |
| CCNA2 | cyclin A2 |
| CCNA2-L | CCNA2 low expression |
| CCNA2-H | CCNA2 high expression |
| CDE | cell-cycle–dependent element |
| CDK2 | cyclin-dependent kinase |
| CHR | cell-cycle genes homology region |
| CIP2A | cancerous inhibitor of protein phosphatase 2A |
| CNV-L | copy number variation low |
| EC | endometrial cancer |
| EEC | endometrioid endometrial carcinoma |
| ESPL1 | extra spindle pole bodies like 1, separase |
| FOXM1 | forkhead box M1 |
| HDACi | histone deacetylase inhibitor |
| HR | homologous recombination |
| MASTL | microtubule associated serine/threonine kinase like |
| MSI-H | microsatellite instability-high |
| mu | mutant |
| PbCT | platinum-based chemotherapy |
| PCR | polymerase chain reaction |
| PFS | progression-free survival |
| PLK1 | polo-like kinase 1 |
| POLE-mu | polymerase ɛ mutant |
| PP2A | protein phosphatase 2A |
| TCGA | The Cancer Genome Atlas |
| USC | uterine serous carcinoma |
| wt | wild type |
1
2
3
4
5
6
7
8
9
10
11
12
13
14
15
16
17
18
19
20
21
22
23
24
25
26
27
28
29
30
31
32
33
34
35
36
37
38
39
40
 Association of a novel endometrial cancer biomarker panel with prognostic risk, platinum insensitivity, and targetable therapeutic options
 Facebook
 Twitter
 Linkedin
 Whatsapp

