 Systemic and local effect of the Drosophila headcase gene and its role in stress protection of Adult Progenitor Cells
PLoS Genetics


The authors have declared that no competing interests exist.

- Altmetric
During the development of a holometabolous insect such as Drosophila, specific group of cells in the larva survive during metamorphosis, unlike the other larval cells, and finally give rise to the differentiated adult structures. These cells, also known as Adult Progenitor Cells (APCs), maintain their multipotent capacity, differentially respond to hormonal and nutritional signals, survive the intrinsic and environmental stress and respond to the final differentiation cues. However, not much is known about the specific molecular mechanisms that account for their unique characteristics. Here we show that a specific Drosophila APC gene, headcase (hdc), has a dual role in the normal development of these cells. It acts at a systemic level by controlling the hormone ecdysone in the prothoracic gland and at the same time it acts locally as a tissue growth suppressor in the APC clusters, where it modulates the activity of the TOR pathway and promotes their survival by contributing in the regulation of the Unfolded Protein Response. We also show that hdc provides protection against stress in the APCs and that its ectopic expression in cells that do not usually express hdc can confer these cells with an additional stress protection. Hdc is the founding member of a group of homolog proteins identified from C. elegans to humans, where has been found associated with cancer progression. The finding that the Drosophila hdc is specifically expressed in progenitor cells and that it provides protection against stress opens up a new hypothesis to be explored regarding the role of the human Heca and its contribution to carcinogenesis.
In all organisms there are sets of “reserve” cells that have the capacity to self-renew and eventually differentiate to repair or provide new structures. Here we report that the Drosophila headcase gene provides such kinds of cells with a stress protective mechanism. Interestingly, headcase is also involved in providing such “reserve” cells with the signal required for initiating their differentiation into new structures. Thus, headcase establishes a fine equilibrium between differentiation and stress protection of these “reserve” cells. Of note headcase is the founding member of a group of homolog proteins identified in many animals. In humans, the headcase homolog is associated with different kinds of cancers but its function and role remains unknown. The finding that the Drosophila headcase confers stress protection opens up a new way to be explored regarding the role of the human Headcase as it could also act as a stress protector and its drop-off may induce stress conditions favouring the initiation and progression of tumorigenesis.
Introduction
Multipotency has been widely studied in biomedical research, particularly due to its role in tissue maintenance and repair. However, there is a lack of understanding regarding how multipotent cells lead the physiological development of an organism and, most importantly, about the molecular characteristics that allow them to overcome challenges, withstand stress conditions, avoid death and eventually contribute to tissue morphogenesis and sustenance. Here we address some of these issues by exploiting a naturally occurring population of multipotent cells, namely Adult Progenitor Cells (APCs) in Drosophila melanogaster (Drosophila)[1,2].
In Drosophila, most larval cells are polyploid and they die at the transition between larval and adult stages. In contrast, APCs survive throughout the developmental process and give rise to adult structures [3,4]. These cells are specified during embryonic development, and they undergo several mitotic divisions during larval stages, remain diploid, and finally proceed into their terminal differentiation during pupal metamorphic stages. Both APCs and larval tissue cells are exposed to the same nutritional and hormonal cues, thereby suggesting that unique molecular components act within the APCs to differentially regulate the effect of external and intrinsic stimuli in their unique setting.
The headcase (hdc) gene was originally identified by its specific expression in Drosophila APCs, and hdc mutants failed to emerge as adults, dying in metamorphosis. However, clusters of APCs with seemingly normal size and shape were still found to be present in hdc mutant pupae suggesting that hdc was not required for the proliferation of APCs, but rather for their adult differentiation [5]. While a very recent report has also identified that hdc participates in the response to nutrient restriction [6], we still lack a characterization of the role of such a specific component of APCs in the normal conditions of development.
Here we show a dual role for hdc in APCs. On the one hand, we show that hdc has a systemic role by acting on the prothoracic gland and regulating the appropriate levels of the hormone ecdysone, which controls the main transitions between developmental stages, including metamorphosis from the last larval instar to the adult organism. On the other hand, we show that there is a specific role of hdc in the APCs regulating their survival, growth and proliferation. In this regard, we show that hdc acts on APCs by modulating the effect of the dTOR pathway, while in the absence of this gene APCs die through apoptosis, possibly as a result of chronic activation of the Unfolded Protein Response (UPR). In particular, hdc confers progenitor cells specific control of the UPR, a mechanism known to protect cells against stress conditions.
Results
HDC is required in the prothoracic gland to control the systemic effect of ecdysone
The three hdc mutants [hdc43 and hdc50 (partial deletions of the coding region resulting from imprecise P-element excision, described in [5]), hdcBG00237 (P-element insertion resulting in truncated protein, described in [7])] that we analyzed are lethal either as homozygous or over a deficiency (Df (3R)BSC503, Df(3R)ED6332). Although all hdc mutants died as pupae or pharate adults, we observed that many of the mutant individuals failed to reach the pupation and arrested their development at embryonic or larval stages. These observations suggest that hdc function is required throughout the development of Drosophila (Fig 1A). Interestingly, the death pattern of hdc mutants is highly reminiscent of phenotypes associated with loss of 20-hydroxyecdysone (20E)[8], which is produced and released by the prothoracic gland, where hdc protein was also detected (Fig 1B). Given that the pulses of 20E in Drosophila regulate the major developmental transitions that lead to the final differentiation events before adult eclosion, the death patterns we report are coherent with previous studies that suggest the involvement of hdc in developmental events under hormonal control [5,7,9]. Along these lines, we also detected a delay in the hdc mutant larvae that eventually reached the pupal stage, another feature associated with lower amounts of ecdysone (Fig 1C).

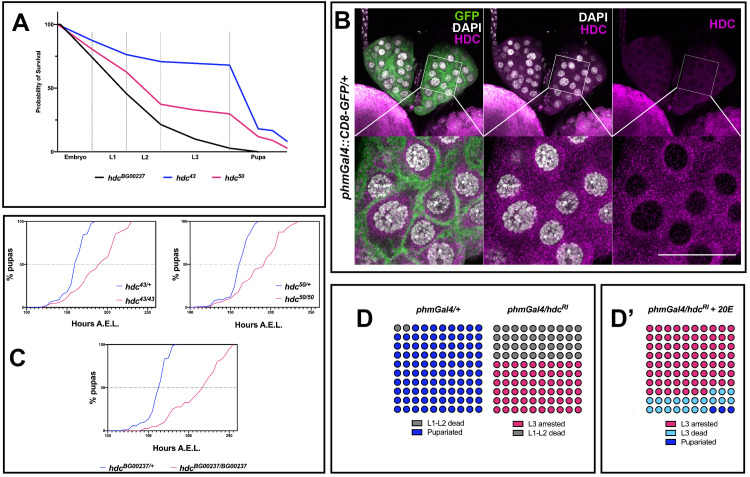
headcase is expressed in the prothoracic gland and controls molting in Drosophila.
(A) Survival curves of the three hdc mutant strains used in this study. 67%, 35% and 3% of hdc43, hdc50 and hdcBG00237 respectively, reach the pupal stage. For the construction of the curves, 30 individuals were used per strain in 3 replicates, yielding a total of 90 individuals for each of the three hdc alleles. (B) Hdc protein is detected in the cytoplasmic region in cells of the PG of larval L3 stage at 120 h AEL. (C) hdc mutants show delayed pupariation. Percentages of pupariated hdc43/+, hdc50/+ and hdcBG00237/+ controls and hdc43/43, hdc50/50 and hdcBG00237/BG00237 mutants are shown at indicated stages. Fifty individuals were tested in each group. (D) Knocking down hdc in the PG results in larval arrest at the L3 stage and lethality during the L1 and L2 stages (Fisher’s exact test p<0.0001). (D’) 20E feeding rescues developmental arrest for 23% of the surviving L3 instars (Fisher’s exact test p<0.0001), which die at the transition to pupariation or during early pupal stage. Circles indicate individuals used for each experimental group (n = 100 / experimental condition).
To study a putative role of hdc in ecdysone control mechanisms, we specifically knocked down the gene in the cells of the prothoracic gland (PG). To this end, we used the phantom22 Gal4 driver (phmGal4) to achieve expression of a UAS-hdcRNAi (VDRC ID: 104322 construct) (from now on referred to as hdcRI). We observed that 40% of the phmGal4/hdcRI larvae died at L1-L2 stages (from now on L1 and L2) while the remaining 60% reached the L3 stage (L3) and arrested at this stage for up to 10 days after egg laying (AEL), thus failing to reach the pupal stage (Fig 1D). To exclude the possibility of putative off-target effects caused by RNAi and of non-specific tissue effects caused by the GAL4, on the one hand we knocked down hdc in the PG using phmGal4 to drive the expression of a second UAS-hdcRNAi (VDRC ID: 45069 from now on referred to as hdcR2), and on the other hand, we drove the expression of either hdcRI or hdcR2 in the PG by means of another Gal4 construct (amnGAL4) [10]. All the cases mentioned reproduced the death phenotype of L1-L2 and the arrest phenotype of L3, although a small percentage of amnGal4/hdcR2 larvae pupated and then died within the first 10 h of pupal formation (S1 Fig). Administration of 20E through the fly food rescued arrest of phmGal4/hdcRI L3 larvae (p<0.0001) and led to the formation of hard cuticle pupal structures for 20% of the individuals at L3. These individuals still failed to progress to pupariation and died shortly after, with the exception of 3%, which entered pupariation and died during white pupa stages (Fig 1D’).
The phenotypes described are indicative of a systemic role of hdc through its effect on the PG. To further explore this possibility, we dissected and examined the morphology of PGs from hdcBG00237 L3 larvae at 120h AEL (Fig 2A). The hdc-deficient PG cells showed lower cell count and DNA content. The cells of wild-type PGs normally undergo multiple rounds of endocycling—a biological process that is directly linked to the production of ecdysteroids [11]—leading to polyploid nuclei with chromatin values (C Values) of ≥4C. The PGs of hdcBG00237 mutants showed a reduction in nuclear size, a decrease in the C value and a lower total cell count (Fig 2B and 2C). Similar results were observed for the PGs of phmGal4/hdcRI larvae (Fig 2A and 2C), the majority of their cells remaining at 16C, compared to 64C in the phmGAL4/+ controls at 120h AEL (Fig 2B), and for the PGs of phmGal4/hdcR2 larvae, where mainly the cell count of the tissue was affected (Fig 2B and 2C).
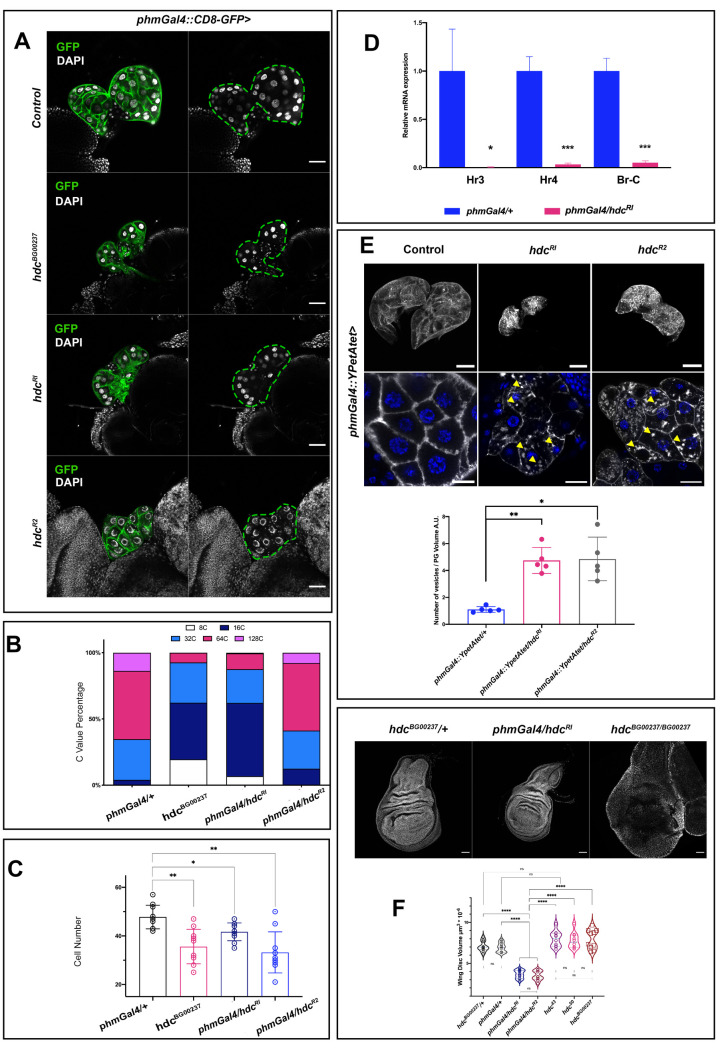
headcase affects the physiology of the prothoracic gland and the release of ecdysone.
(A) Lack of hdc in the PG results in smaller glands with fewer cells and a reduced DNA content. Indicative phenotypes of control phaGal4::CD8-GFP/+, mutant hdcBG00237:: phaGal4::CD8-GFP/ hdcBG00237:: phaGal4::CD8-GFP and phaGal4::CD8-GFP /hdcRI and phaGal4::CD8-GFP /hdcR2 gene knockdowns of L3 larvae at 120 h AEL are shown. Scale bars 40 μm. (B) Graph showing the C value of PG cells from each group tested. Depletion of hdc induces a reduction in the polyploidy. (C) Bar graphs show PG cell count. Depletion of hdc results in a lower cell count. For the analysis of variance between groups, Welch’s ANOVA (p = 0.0003) was applied followed by Dunnett’s T3 multiple group comparison test. (alpha set at 0.05. * p<0.05, **p<0.005. n = 10 per group. Error bars represent SD of means). (D) Relative expression levels for the mRNAs of the ecdysone targets Hr3, Hr4 and Br-C in total larval extracts appear significantly decreased in phmGal4/hdcRI larvae compared to control phmGal4/+ larvae (alpha set at 0.05. * p<0.05, ***p<0.001, Unpaired t-test, Welch’s correction) (E) PGs of control, hdcRI and hdcR2 overexpressing YPet-Atet (phm22>YPet-Atet) at 120 h AEL. Magnified view in lower panels, shows the aggregation of small vesicle like structures (yellow arrowheads) in the cytoplasm of hdc-depleted cells compared to the respective control. Bar charts show comparisons for the ratio of the number of vesicles per PG volume in control and hdc knock downs. For the analysis of variance between groups, Welch’s ANOVA (p = 0.0004) was applied followed by Dunnett’s T3 multiple group comparison test. (alpha set at 0.05. * p<0.05, **p<0.005. n = 5 per group. Error bars represent SD of means). Scale bars, upper panels 40 μm, lower panels 20μm. (F) Wing discs of control (hdcBG00237/+), hdc knockdown in the prothoracic gland (phmGal4/hdcRI) and hdc mutant (hdc BG00237/ BG00237) larvae at 120 h AEL. Violin plots show the distribution of the values for the wing disc volume of controls (hdcBG00237/+ and phmGal4/+), hdc knockdown in the prothoracic gland (phmGal4/hdcRI; phmGal4/hdcR2), and three different homozygous hdc mutants (hdc43, hdc50 and hdcBG00237). The wing disc volume of phmGal4/hdcRI and phmGal4/hdcR2 larvae is significantly lower (mean = 3.6μm3*10−6 and 3.5μm3*10−6) than the control (mean = 6.9 μm3*10−6 and 7.1 μm3*10−6 for the phmGal4/+ and the hdcBG00237/+ respectively) and all mutant groups (mean = 7.9 μm3*10−6, 7.8 μm3*10−6 and 7.9 μm3*10−6, for the hdc43, hdc50 and hdcBG00237 respectively). For the analysis of variance between groups, Welch’s ANOVA (p<0.0001) was applied, followed by Dunnett’s T3 multiple group comparison test. (**** p<0.0001). Interquartile range and mean are indicated by dashed lines. n = 10 per group.
The general phenotypes observed upon hdc depletion in the PG together with the abnormalities in the PG itself, are suggestive of a problem in ecdysone production or secretion. To confirm this hypothesis, we analyzed the expression of ecdysone target genes in control phmGal4/+ and phmGal4/hdcRI larvae at 120h AEL. Consistently, expression of Hr3, Hr4 and Br-C genes, three direct targets of the hormone that have been used as readouts of the ecdysone levels [12–15] was detected significantly lower, as quantified by qRT-PCR, in phmGal4/hdcRI larvae compared to the respective controls (Fig 2D).
We also examined whether the effects of hdc on the physiology of the ring gland could also extend to the proper secretion of the steroids from the cells of the gland, an additional key mechanism for ecdysone control of developmental transitions [16]. To this end, we knocked down hdc in the PGs, together with a construct driving the expression of a fluorescent-protein tagged Atet, which serves as a marker of secretory ecdysone-containing vesicles in the PG [16]. For both hdcRI and hdcR2, we detected abnormal aggregation of vesicle-like structures along the membrane and the cytoplasm of the PG cells (Fig 2E), indicating an impairment of the hormone secretion mechanism, an additional defect likely to contribute to impaired ecdysone signaling.
Since ecdysone promotes imaginal disc growth, lower levels of this hormone give rise to smaller imaginal discs [17–20]. Accordingly, we observed a significant decrease in the volume of the imaginal discs from phmGal4/hdcRI larvae at L3 when compared to phmGAL4/+ controls (Fig 2F); thus, hdc activity in the PG non-autonomously promotes the growth of the APC clusters. However, this finding was unexpected given previous reports that suggest either no major effects of hdc on imaginal tissue size [5] or even hdc acting to restrict tissue growth [6]. Consequently, we decided to also examine the volume of wing discs from hdc43, hdc50 and hdcBG00237 homozygous mutants and compare them to those dissected from phmGal4/+, phmGal4/hdcRI and phmGal4/hdcR2 wandering L3 larvae (Fig 2F). Notably, hdc mutant discs sporadically show variable morphological defects, while their mean size was not significantly different compared to the phmGal4/+ control and was significantly larger than that of phmGal4/hdcRI and phmGal4/hdcR2 larvae. We interpret these results as an indication of a dual effect of hdc on imaginal disc growth control, namely a systemic effect promoting growth and an imaginal disc-specific effect restricting growth.
HDC is required for the survival of clusters of APCs and the control of adult tissue size
To examine the role of hdc in APCs, we specifically knocked down the gene in the pouch region of the wing disc by means of a nubbin-Gal4 (nubGal4) construct to drive the expression of the hdcRI construct. The nubGal4/hdcRI adults showed severe wing malformations, presenting a significant reduction in adult wing size (in 100% of the adults) (Fig 3A). This phenotype was restored after concomitant expression of a full-length mRNA UAS-hdc (hdcUAS.cSa) construct (S2A Fig). The hdcR2 adults showed milder wing deformations (in 30%), with severe wing malformations appearing in a much lower percentage (4%), suggesting lower gene silencing efficiency (for a detailed characterization of RNAi constructs against hdc, see also S2 Fig). Phenotypes of tissue loss in adult hdc mutants could not be observed as no escapers survived in homozygosis until the adult stage. Nevertheless, loss of head structures has been observed in pharate adults dissected from their pupal cases [5], while we identified loss of thoracic structures and deformed wing and leg structures from pharate hdc43 and hdc50 mutant escapers.
In contrast to the adult wing phenotypes of nubGal4/hdcRI, we observed an overgrowth in the wing discs from L3 larvae of the same genotype (Fig 3B). In particular, the mean pouch/disc volume ratio, which was 0.37 in control L3 wing discs, increased to 0.51 in the wing discs of nubGal4/hdcRI L3 larvae at 120h AEL (Fig 3C). We then considered whether the discrepancy between wing disc overgrowth in the larvae and tissue size reduction in the adult, either upon hdc RNAi or in hdc mutants, might be due to cell loss from the larva to the adult. Indeed, we observed a significant increase in the levels of the effector caspase Dcp1, as assayed with an antibody for this apoptotic marker, both upon hdcRI expression and in hdcBG00237 imaginal discs (Fig 3D and 3E). This result is similar to that previously reported for hdc loss in the stem cells of the adult gut and testis’ hub [21,22]. Thus, our results suggest that hdc activity in APC clusters restricts growth and/or proliferation but that the overgrowth elicited upon hdc loss is limited because at the same time hdc loss also triggers cell death by apoptosis. To corroborate this hypothesis, we induced the expression of the apoptosis inhibitor p35 together with hdcRI by means of the apGal4 wing driver. The discs from these larvae, which died at late L3 or early pupal stages, showed aberrant growth similar to that found in tumorigenic conditions (Fig 3F). Thus, the loss of hdc in APC clusters promotes both uncontrolled growth and apoptosis.
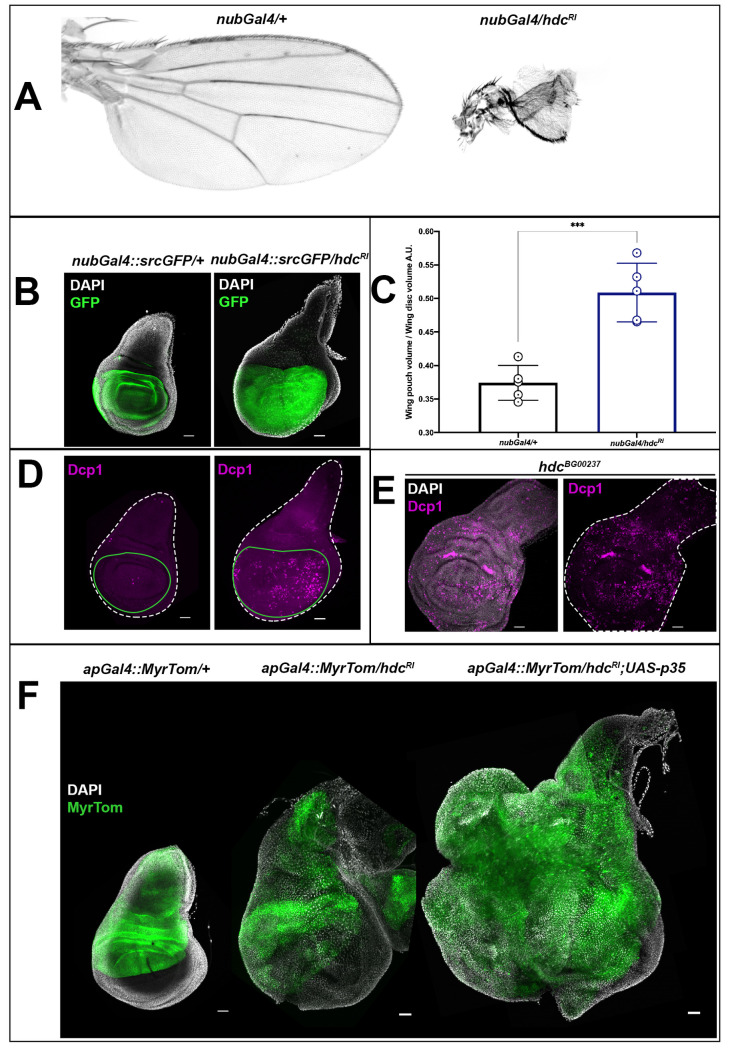
headcase is necessary for the survival of imaginal cells and the control of their growth.
(A) The knockdown of hdc in the pouch region of the wing disc results in a significant reduction of the adult wing size and deformation of the wing structure. Adult wings from control (nubGal4/+) and hdc knockdown (nubGal4/hdcRI) individuals are shown. (B and C) The knockdown of hdc in the pouch region of the wing disc leads to a significant increase in the size of the wing disc area where hdcRNAi is expressed. Wing discs from control (nubGal4;srcGFP/+) and hdc knockdown (nubGal4;srcGFP/hdcRI) labeled for Src-GFP that marks the pouch region and nuclei (DAPI) of late L3 larvae are shown in (B). In (C), quantification of the wing disc pouch volume/wing disc volume ratio in control (nubGal4/+, ratio = 0.37) and hdc knockdown (nubGal4/hdcRI, ratio = 0.51), reveals the size increase in the area where hdc is knocked down. Unpaired t-test, Welch’s correction (*** p<0.001), n = 5 / group. Error bars represent SD of means. Scale bars, 40 μm. (D and E) hdc loss results in the induction of apoptosis, as indicated by the Dcp1 marker. Knockdown of hdc in the pouch region of the wing disc results in increased Dcp1 staining in the wing disc area where hdcRNAi is expressed (wing discs outlined in white dashed line and the wing pouch area where hdc in knocked down in green). Wing discs from control (nubGal4;srcGFP/+) and hdc knockdown (nubGal4;srcGFP/hdcRI) labeled for Dcp1 (magenta) of late L3 larvae are shown in (D). Extensive Dcp1 staining (magenta) in hdc mutant wing discs (hdcBG00237) of late L3 larvae is shown in (E). Nuclei of wing disc cells are labeled by DAPI (white). Scale bars, 40 μm. (F) Blocking apoptosis together with hdc knockdown results in tumorous overgrowth. Wing discs of control (apGal4::MyrTom/+), hdc knockdown in the apterous expressing region of the wing disc (apGal4::MyrTom/hdcRI) and hdc knockdown together with the expression of a p35 construct in the same region (apGal4::MyrTom/hdcRI;UAS-p35) of late L3 larvae. The apterous Gal4 region is labeled by Myristoylated Tomato (pseudo colored green) and cell nuclei are labeled by DAPI stain. Scale bars, 40 μm.
Loss of hdc results in the hyperactivation of TOR in APC
Previous screenings identified the Hdc protein as an interactor of the TOR pathway and showed this interaction to be relevant in response to nutrient restriction [6,9,23]. Thus, we studied whether the wing disc phenotypes caused by the loss of hdc in non-stress conditions during normal development are also caused by an effect of hdc on the TOR pathway. To this end, we examined the distribution of the phosphorylated form of dRpS6 (pS6) and p4E-BP, two readouts of TORC1 activity in Drosophila [24]. While we found enhanced pS6 staining in regions where we expressed the hdcRI RNAi (Fig 4A), we did not observe an enhancement of the signal for p4E-BP (Fig 4B), although we cannot exclude the possibility that our failure to detect enhancement of the p4E-BP signal may emanate from the fact that 4E-BP in this tissue is expressed in very low levels [25,26]. These results indicate that the downregulation of hdc results in the hyperactivation of the TOR pathway in non-stress conditions during normal development, preferentially through the phosphorylation of S6 downstream of TORC1. We also examined whether hdc loss in non-stress conditions during normal development is associated with anabolic changes related to TOR hyperactivation that could also account, at least in part, for the overgrowth phenotypes described above. To this end, we used the fibrillarin antibody, a marker that allowed us to measure nucleolar volume [27], as the nucleolus size positively correlates with rRNA synthesis, high levels of ribogenesis, and consequently protein synthesis [28–30]. In agreement with an effect on TORC1 hyperactivation, we found larger nucleoli compared to the total nuclear volume in the wing disc cells of hdc50 mutants (p<0.0001) or upon hdcRI expression (p<0.0001) compared to their respective controls (Fig 4C). However, while hdc triggered hyperactivation of the TOR pathway, we found that hdc overexpression did not abolish TOR pathway activity, as assayed by the levels of pS6, which did not show any observable differences to those of wild-type counterparts (Fig 4E). This finding held true even in a TOR hyperactive background, as generated by the expression of a UASRheb construct; the higher levels of pS6 induced by Rheb expression did not change significantly upon hdc overexpression (Fig 4F). Similarly, hdc overexpression did not appear to affect nucleolar size either, as the ratio of the nucleolar to the total nuclear volume was not significantly different (p = 0.06) compared to wild-type cells of the same discs (Fig 4G). Thus, hdc is necessary for the downregulation of TOR but is not sufficient for the complete suppression of this pathway.
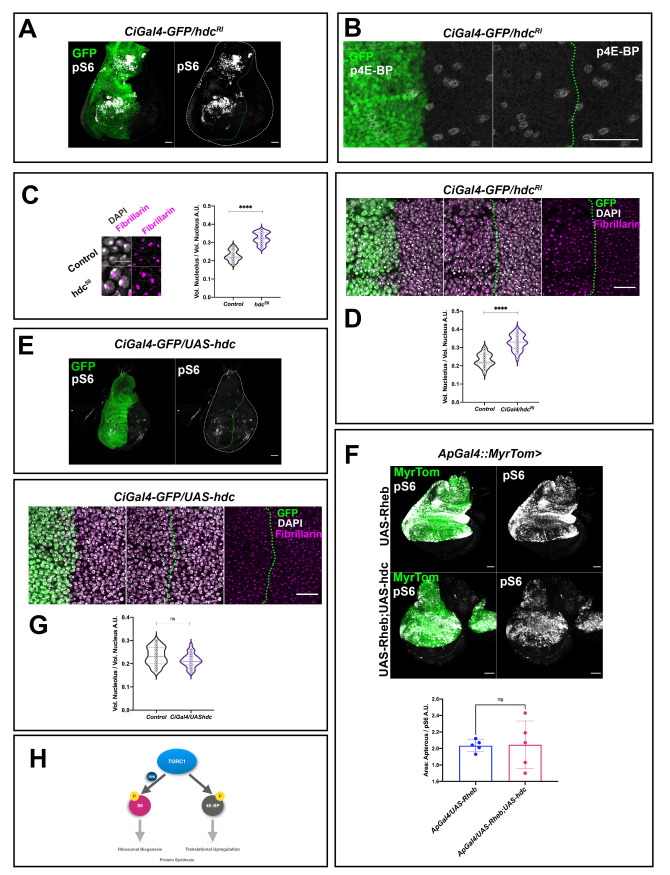
headcase is required for the control of TOR activity and ribosomal biogenesis.
(A) RNAi of hdc induces the phosphorylation of dRp-S6 (pS6) in wing disc cells. Note the increase in pS6 signal (gray) in the anterior compartment of the wing disc where hdcRI is expressed by a CiGal4 driver. Gal4 expression is labeled by UAS-GFPnls (green). Wing disc is outlined by a white dashed line and the CiGal4 area by a green dashed line. Scale bars, 40 μm (B) RNAi of hdc does not affect the phosphorylation of 4E-BP in wing disc cells. p4E-BP signal (gray) in the anterior compartment where hdcRNAi is expressed by a CiGal4 driver compared to the posterior counterpart of the wing disc used as control. Scale bars, 40 μm. (C) Nuclei of wing disc cells from control (w1118) and hdc mutants (hdc50/50) labeled by Fibrillarin staining (magenta) and DAPI (white). Scale bars, 10 μm. Violin plots show the distribution of the values of the nucleolar volume/ total nuclear volume ratio in control (w1118) and hdc mutants (hdc50/50). Quantification reveals the increase in nucleolar size of hdc mutant cells (n = 25 cells, 5 individuals per group). Unpaired t-test, Welch’s correction (**** p<0.0001). Interquartile range and mean are indicated by dashed lines. (D) RNAi of hdc induces an increase in the nucleolar size of wing disc cells. Fibrillarin staining (magenta) occupies a larger area of the nucleus in cells of the anterior compartment of the wing disc where hdcRI is expressed by a CiGal4 driver, compared to the posterior counterpart of the disc. Gal4 expression is labeled by UAS-GFP (green). Nuclear DNA is stained by DAPI (white). The CiGal4 area is outlined by a green dashed line. Scale bars, 20 μm. Violin plots show the distribution of the values of the nucleolar volume/ total nuclear volume ratio in control (CiGal4/hdcRI wing disc posterior compartment cells; n = 25 cells, 5 individuals) and hdc knockdown (CiGal4/hdcRI wing disc anterior compartment cells; n = 25 cells, 5 individuals), the quantification reveals the increase of the nucleolar size in hdc knockdown cells. Unpaired t-test, Welch’s correction (**** p<0.0001). Interquartile range and mean are indicated by dashed lines. (E) Overexpression of hdc is not able to suppress the pS6 levels in wing disc cells. The pS6 signal levels (gray) show no observable modifications between the anterior compartment where UAS-hdc is expressed by a CiGal4 driver compared to the posterior counterpart of the wing disc. Wing disc is outlined by a white dashed line and the CiGal4 area by a green dashed line. Scale bars, 40 μm (F) Overexpression of hdc is not able to suppress the pS6 induction caused by TOR overactivation, as a result of Rheb overexpression (Unpaired t-test, Welch’s correction (*p<0.05). n = 5 / group. Error bars indicate SD of means.). pS6 staining (gray) is shown in L3 wing discs where UAS-Rheb is driven by the expression of an apGal4 (upper panels) alone, or together with a UAS-hdc construct (lower panels). The apterous Gal4 region is labeled by Myristoylated Tomato (green). Scale bars, 40 μm. (G) Overexpression of hdc does not affect the nucleolar size of wing disc cells. Fibrillarin staining (magenta) of the nucleus in cells of the anterior compartment of the wing disc where UAS-hdc is expressed by a CiGal4 driver, compared to the posterior counterpart of the disc does not show observable differences. Gal4 expression is labeled by UAS-GFP (green). Nuclear DNA is stained by DAPI (white). The CiGal4 area is outlined by a green dashed line. Scale bars, 20 μm. Violin plots show the distribution of the values of the nucleolar volume/ total nuclear volume ratio in control (CiGal4/UAS-hdc wing disc posterior compartment cells; n = 25 cells, 5 individuals) and hdc overexpression (CiGal4/UAS-hdc wing disc anterior compartment cells; n = 25 cells, 5 individuals), the analysis does not show statistically significant differences. Unpaired t-test, Welch’s correction (p = 0.06). Interquartile range and mean are indicated by dashed lines. (H) TORC1 (target of rapamycin complex 1) plays a key role in the regulation of cell growth and size while a wide range of signals, nutritional cues etc. is known to activate TORC1. On one hand, activation of the TOR pathway results in 4E-BP phosphorylation. This prevents 4E-BP binding to eIF4E, thus upregulating translation. On the other hand, TORC1 acts on its direct phosphorylation target, S6K, which in turn phosphorylates and activates the dRpS6 (S6) protein to shift the metabolic status of the cell towards anabolic procedures.
The analyses and the results reported so far refer to the wing disc cells. Although this cell population is an extensively used model of Drosophila APCs, the results might unveil, at least in part, specific features of wing disc cells rather than common features of APCs. To find out what might be common to the progenitor cells, we performed a similar analysis in two populations of APCs in the trachea, which is the insect respiratory system. In this regard, we examined the cells of the spiracular branches and the second tracheal metamere (Tr2) (see also Fig 5A), which have been described as dedicated and facultative stem cells respectively and that also express hdc [1,31]. Similar to the wing disc cells, tracheal Tr2 and spiracular cells showed enhanced pS6 staining in hdc50 mutants (Fig 5B). Likewise, under these circumstances, the nucleoli were larger in relation to the total nuclear volume when compared to the respective controls (p<0.0001) (Fig 5C and 5E), an observation also compatible with TORC1 hyperactivation. Thus, loss of hdc appears to affect the TOR pathway in a similar way in different clusters of APCs.
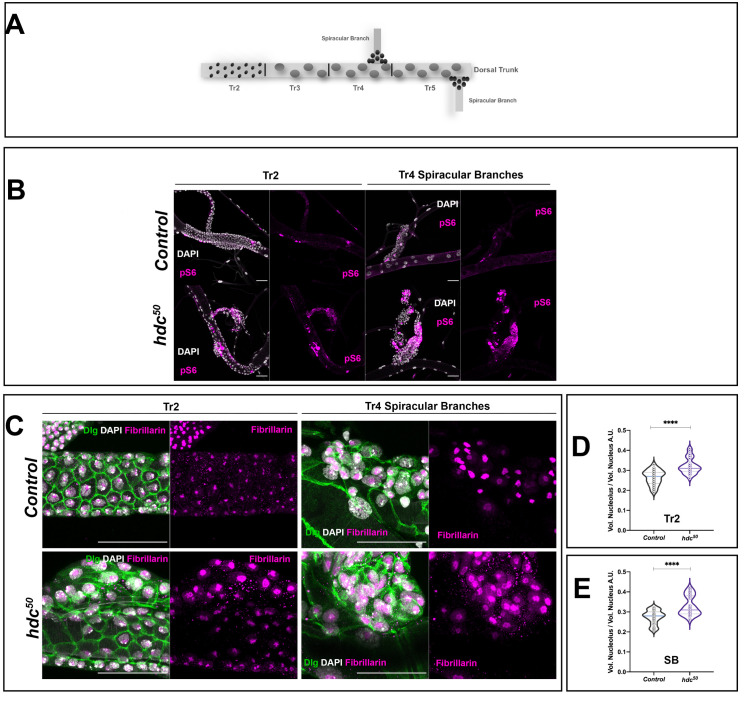
headcase shows similar mechanisms of action in different APC clusters.
(A) The dorsal trunk of larval trachea is divided into 10 metameres (Tr1-Tr10). During the L3 stage, while already forming part of a functional organ, cells of the Tr2 resume proliferation and are thought to survive metamorphosis and give rise to adult tracheal structures. These particular APCs express hdc and are known as facultative stem cells. Tr1 and Tr3 to Tr10 cells enter endoreplication. In addition to Tr2 cells, another type of APC is found in the larval trachea. The cells of the Spiracular Branches (SB) (shown here at Tr4 and Tr5) actively divide during L3 stages and also contribute to the adult tracheal system that is formed during metamorphosis. (B) Loss of hdc induces phosphorylation of dRp-S6 (pS6) in tracheal populations of APCs. Note the increase in pS6 signal (magenta) in mutant (hdc50) larval tracheas compared to the controls (w1118) both in the Tr2 region of the dorsal trunk and the SB cells. Cell nuclei are stained by DAPI. Scale bars, 40 μm. (C) The nucleolar volume of hdc mutant (hdc50) tracheal APCs is larger than that of the controls. Cell membranes are labeled by Dlg (green), nuclear DNA by DAPI (white) and nucleolus by Fibrillarin (magenta). Left panel group of images show Tr2 regions of control (w1118) and hdc mutant (hdc50); right panels show SB cells of the Tr4. (D and E) Violin plots show the distribution of the values of the ratios for the nucleolar volume/ total nuclear volume in tracheal cells from control (w1118) and hdc mutants (hdc50/50) (n = 25 cells, 5 individuals per group), revealing the nucleolar size increase in hdc mutant cells of both the Tr2 metamere (D) and the SB (E) cells. Unpaired t-test, Welch’s correction (****p<0.0001). Interquartile range and mean are represented by dashed lines.
hdc loss in APCs induces cell stress responses
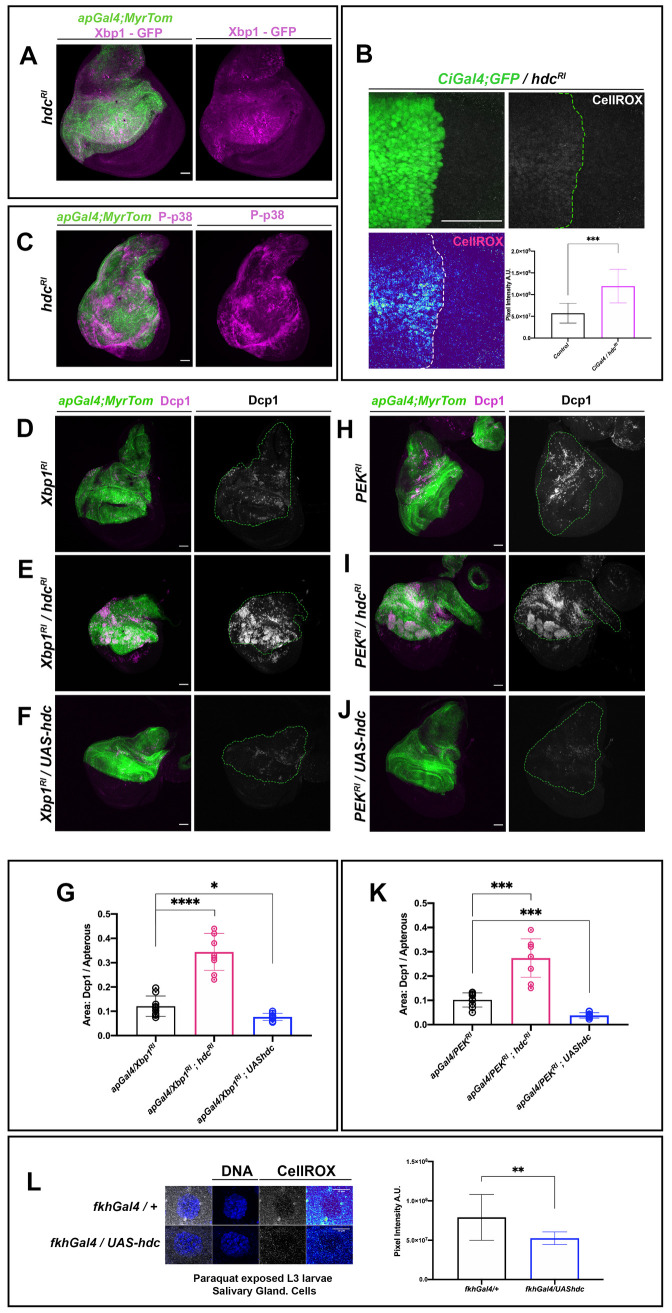
Since hdc loss in APCs caused hyperactivation of the TOR pathway and an increase in ribogenesis, it may also lead to a high increase in cell protein load. In fact, such an increase in protein load may cause ER stress and the induction of the protective Unfolded Protein Response (UPR) mechanism [32]. Thus, to examine whether the UPR is activated in hdc mutant cells, we used an in vivo UPR marker, the xbp1-EGFP construct, which generates an xbp1 spliced isoform that accumulates in the nucleus in case of UPR induction [33]. Accordingly, we observed a higher nuclear localization of GFP in the wing disc when the UAS-xbp1-EGFP construct was expressed upon hdc RNAi (hdcRI) (Fig 6A).
To further confirm cell stress upon hdc loss, we resorted to the CellROX Oxidative Stress Reagents, which emit a strong fluorogenic signal upon oxidation and are commonly used to detect Reactive Oxygen Species (ROS). An enhanced CellROX signal was observed in a wing region upon hdc RNAi induction compared to the rest of the disc (Fig 6B). Likewise, the Hsp70-GFP marker sensing acute stress conditions [34] produced a stronger GFP signal in hdc RNAi wing discs compared to discs from control larvae (S3A Fig). Finally, the phosphorylated p38 Stress-Activated Protein Kinase (P-p38) [35–38] was strongly activated in wing discs upon hdc RNAi (Fig 6C).
Cell stress, the UPR and headcase.
(A) RNAi of hdc induces the splicing of Xpb1 and the nuclear localization of the latter, as a mediator of the UPR effects. Xbp1-GFP reporter (magenta) shows strong nuclear localization in the apterous area of the wing disc where hdcRI is expressed. The apterous Gal4 region is labeled by Myristoylated Tomato (green). Scale bars, 40 μm (B) RNAi of hdc induces the production of ROS in wing disc cells. Note the increase in ROS signal (Gray in upper right, high ROS Red-Yellow / low ROS Cyan-Blue in the Thermal LUT in lower left image) in the anterior compartment of the wing disc where hdcRI is expressed by a CiGal4 driver. Gal4 expression is labeled by UAS-GFP (green). Quantification of ROS production in the posterior wing compartment where hdcRI is expressed in comparison to the posterior wild-type shows increased ROS upon RNAi of hdc and results from 2 ROIs in Sum. Intensity stacks per compartment of the wing disc, from the wing discs of 5 individuals. Unpaired t-test, Welch’s correction (****p<0.0001). Error bars represent SD of means. Scale bars, 40 μm. (C) RNAi of hdc induces the phosphorylation of p38 (P-p38 in magenta) in the apterous area of the wing disc where hdcRI is expressed. The apterous Gal4 region is labeled by Myristoylated Tomato (green). Scale bars, 40μm (D, E, F, G, H, I, J and K) Synchronous expression of RNAi for hdc and Xbp1 (E), as well as for hdc and PERK (I), results in the observed increase in apoptotic death, compared to the UPR disruption after knockdown of its mediators (Xbp1 (D) and PERK (H)) alone. Synchronous overexpression of a UAS-hdc with an RNAi against Xbp1 (F) and PEK (J) results in the decrease in the observed apoptotic death, compared to the UPR disruption after knockdown of its mediators (Xbp1 (D) and PERK (H)) alone. Dcp1 apoptotic marker is labeled in magenta (left panels) and white (right panels) of each set. The apterous Gal4 region is labeled by Myristoylated Tomato (green) and outlined by a dashed green line in grey colored Dcp1 images (right panels of each set). Apoptotic cell death increase in hdcRI;Xbp1-RNAi and hdcRI;PEK-RNAi double RNAis and decrease in UAS-hdc;Xpb1RNAi and UAS-hdc;PEKRNAi were calculated by comparison of the ratios of Dcp1-positive area within the Gal4-expressing area of each wing disc to the same ratio resulting from Xbp1RNAi (G) and PEKRNAi (K) wing discs respectively (n = 9 wing discs per genotype). Unpaired t-tests, Welch’s correction (*p<0.05; **p<0.01; ***p<0.001; ****p<0.0001) Scale bars, 40 μm (L) Ectopic expression of hdc reduces the production of ROS in salivary gland cells of L3 larvae exposed to paraquat. Note the decrease in ROS signal (high ROS Red-Yellow / low ROS Cyan-Blue in the Thermal LUT in right upper and lower image) in a cell of a salivary gland where hdc is ectopically expressed by a fkhGal4 driver (fkhGal4/UAS-hdc), compared to the respective control (fkhGal4/+). DAPI stain marks nuclear DNA (Blue), ROS stained by the CellROX Deep Red reagent is shown in gray and thermal LUTs. Quantification of ROS production per genotype results from 3 ROIs of Sum. Intensity stacks from the salivary glands of 5 individuals. Unpaired t-test, Welch’s correction (**p<0.01). Error bars represent SD of means. Scale bars, 10 μm.
The prolonged activation of the UPR and/or its failure to restore the normal function of the ER may lead to apoptosis, which could account for the above reported cell death upon hdc loss. Apoptosis triggered by ER stress is mediated mainly by the activity of the c-Jun N-terminal kinase (JNK) pathway [38,39], which can be detected by a puc- lac-Z reporter, which is both a downstream effector and a negative regulator of JNK [40,41]. In agreement with activation of the JNK pathway upon hdc loss, we observed puc-lac-Z staining in the wing disc region subjected to hdc RNAi (S3B Fig). Finally, we examined whether ROS may be the cause for the apoptosis upon depletion of hdc. To this end, we induced enzymatic depletion of O2- and H2O2 by overexpression of Catalase and SOD1, together with hdc RNAi, but overexpression of Catalase and SOD1 failed to rescue the apoptosis induced by the hdc RNAi. This observation indicates that ROS are most probably produced as a result of the tissue damage caused by loss of hdc and probably are not triggering apoptosis (S3C and S3C’ Fig).
hdc as a cell stress protective factor
The above results suggest that hdc may protect APCs from the deleterious effects of ER-stress. Indeed, malfunction of the UPR is one of the conditions leading cells into stress. Thus, to assess the putative protective role of hdc, we used the apGal4 construct to drive the expression of the RNAi of two genes that mediate the effects of the UPR through its major branches in Drosophila [42], namely xbp1 (Fig 6D) and PERK (Fig 6H), and compared their effect in the presence of a normal dose of the hdc gene or upon hdc knockdown by means of RNAi (hdcRI). In each case, we measured the area of the of Dcp1-positive cells and used the magnitude of the ratio of Dcp1/apGal4 area as an estimation of the severity of apoptotic cell damage induced by the RNAis. In fact, cell death in the wing discs increased upon xbp1 RI or PERK RI, while the levels of Dcp1 staining in the double knockdown of hdcRI and xbp1RI (Fig 6E) or hdcRI and PERKRI (Fig 6I) were higher than those of xbp1RI (p<0.0001) (Fig 4G) or PERKRI (p<0.0001) (Fig 6K) alone, respectively. These results indicate that hdc activity attenuates the deleterious effects of a defective cell stress response.
Interestingly, we also found that hdc overexpression reduced the wing disc levels of Dcp1 signal due to knockdown of either xbp1RI (p<0.05) or PERKRI (p<0.01) (Fig 6F and 6J). This observation suggests that overexpression of hdc decreases the ER-stress levels of UPR-defective cells, resulting in the reduction of the apoptosis caused by UPR deregulation (Fig 6G and 6K). Additionally, to examine whether hdc might provide a protective role in stressed cells, we used a nubGal4 construct to drive hdcRI in the wing disc, and we exposed L3 larvae to an oxidative stress inducer for 12h by feeding them with fly food containing paraquat (20μg/ml). Loss of hdc in stress conditions resulted in a further increase in the levels of apoptosis, as detected by the Dcp1 marker (S3D and S3D’ Fig), thereby indicating the protective role of this gene. Furthermore, to examine a similar role of hdc in cells in which it is not normally expressed, we repeated the paraquat exposure experiment using a fkhGal4 driver to ectopically express hdc in cells of the salivary glands. In that case, we observed a significant reduction in ROS production in the case of fkhGal4/UAShdc compared to the control (p<0.05) (Fig 6L), thereby indicating that hdc can act protectively against ROS induction in tissues undergoing oxidative stress.
Discussion
Progenitor cells, which are defined by their capacity to self-renew and their potential to differentiate, have a different developmental program compared to their differentiated cell counterparts, including distinct patterns of cell proliferation, particular metabolic features, distinct responses to the systemic hormone signaling and reactions to internal and external stimuli. In Drosophila, as in many other insects, a key population of progenitor cells is found in larvae, and upon metamorphosis, these give rise to the variety of cells in the adult organism. It has been known for quite some time that Drosophila APCs distinctly express hdc [5]. While hdc has been previously described as a nutrient-restriction (NR) specific growth regulator [6], its role in normal development remained largely unknown.
A systemic and a local role for headcase
Here we have identified a dual role for hdc. On the one hand, through its function in the prothoracic gland, the ecdysone-producing organ, hdc is required for the proper synthesis and/or delivery of this hormone. Ecdysone is the molting hormone in insects and it governs the growth of imaginal discs (clusters of APCs), larval molting and entry into metamorphosis. Thus, by controlling ecdysone, hdc has a systemic role on APCs, promoting their growth and differentiation. On the other hand, we have characterized the local role of hdc in APCs, particularly in the imaginal wing disc as a prototypical model for Drosophila APCs, where it is necessary for their survival and limits their uncontrolled proliferation. Therefore, the phenotype of the APCs in the hdc mutants is due to the combined effect of impairing both its systemic role and its local requirement. Actually, the systemic and local requirements identified here, help to better understand the phenotype of the hdc mutants. In addition to the lethality of hdc mutants in pupal stages previously published [5], we report that lethality occurs throughout development and that only some individuals reach the pupal stage. Lethality during early developmental stages is probably mainly due to the effect of hdc on ecdysone production and/or delivery. Of note, impairment of the systemic or the local requirements of hdc has opposing effects. This observation suggests that the local effect of hdc on APCs tends to confer protection against or minimize the consequences of its systemic impact.
Interaction of hdc with the TOR pathway
The phenotype caused by the downregulation of hdc in the APCs seems to result from the disturbance of distinct molecular mechanisms and cannot be attributed solely to a general failure of cell metabolism. Several observations support this notion. First, our results indicate a clear relation between the hdc phenotype and the activity of the TOR pathway. Second, they reveal that the interaction of hdc phenotypes and the TOR pathway is mediated mainly through its dRpS6 branch and no obvious changes in the phosphorylation status of 4E-BP in another branch of the TOR pathway are observed, pointing again to a rather specific alteration. Finally, previous reports established a physical interaction of Hdc protein with another component of TOR signaling, namely Unkempt [6,23]. Nevertheless, we think that the interaction of hdc with the TOR pathway does not account for all the functions of hdc since our own observations point also to an interaction with members of the heat shock machinery. Clearly, further studies are therefore needed to provide an understanding of the global function of hdc and above all to determine the nature of the Hdc protein, which has remained elusive up to now.
Hdc as a stress protector
Our results show that APCs require hdc function to avoid entering into stress. Moreover, forced expression of hdc can also provide a stress protective effect on non-progenitor cells, which are usually devoid of hdc expression. The role of hdc as a stress protector is consistent with previous analyses showing a growth-suppressing role for this gene in conditions of nutrient restriction (NR), where low metabolic activity has to be sustained. Indeed, we consider that the effects of hdc observed previously in stress conditions are merely an exacerbated case of its role in normal development. In fact, in non-stress conditions, we show a measurable effect of hdc loss on tissue growth, together with a detrimental effect on tissue survival, not reported previously [6] and that was at odds with the indispensable role of hdc during development. The difference between our analysis and others may lie in the genetic tools we employed, as the RNAi against hdc used here knocks down the transcript levels of the gene more efficiently (see also Materials and Methods and S2 Fig). During development, various cellular mechanisms, including the TOR and FOXO pathways and also the UPR, respond both to normal developmental cues and stress stimuli to ensure the maintenance of cellular and organismal homeostasis [43–47]. We therefore think that several molecular components, including hdc, can be employed to ensure the differential cellular response and/or the magnitude of the activity of the aforementioned mechanisms upon different stimuli, specifically in APCs.
Stress and metamorphosis
Given the specific expression of hdc in APCs, it is of particular interest to identify it also as a factor that regulates the levels of ecdysone reaching this cell population. In fact, what might be the functional relevance of having the same factor conferring APCs with a protective shield against stress and also regulating ecdysone? Considering our results, we would like to propose a novel view regarding cell responses to ecdysone activity during development. In particular, ecdysone plays a key role in regulating metamorphosis, which, while a customary event at the organism level, may be considered highly stressful at the cellular level. Indeed, metamorphosis has devastating effects for the majority of larval cells, which die at metamorphosis, while only the APCs are able to survive [48]. Thus, as ecdysone is required to promote both larval cell death and APC proliferation and differentiation into adult structures, we favor the notion that hdc is part of the mechanism that allows APCs to respond differentially and to countervail the ecdysone levels that are required for the specific cell responses during the transition between developmental stages. Moreover, the overall conditions of APCs differ from those of larval cells not only at metamorphosis but also during embryonic and larval stages. For example, the growth rates of APCs and larval cells are suggested to be different [49,50]. Actually, growth rates are clearly influenced by ecdysone signaling [18,20], as is also the case for the metabolic shift of stem cells from glycolysis to oxidative phosphorylation, the production of oxidative agents [51] and the susceptibility to external stress stimuli [52]. Further studies will be required to determine whether these other properties of APCs are also under the influence of hdc activity.
hdc, human heca, stress and tumorigenesis
Hdc is the founding member of a group of homolog proteins identified from C. elegans to humans. In humans, the Hdc homolog, termed Heca, has been found associated with different kinds of cancers but its function has not yet been identified and its role remains controversial. However, similar to the Drosophila homolog, Heca physically interacts with components of mTORC1 [6]. In addition, the finding that the Drosophila homolog hdc is specifically expressed in progenitor cells and that it confers stress protection opens up a new way to be explored regarding the role of the human Heca and its contribution to carcinogenesis. First, research has established that ER and oxidative stress promote and contribute to initiation and progression of tumorigenesis (for reviews, see [53,54]). And second, Heca is downregulated in different kind of cancerous tissues, which has led to propose that it acts as a tumour suppressor [55–57]. All together, we would like to introduce the hypothesis that, similarly to Hdc, Heca could act as a stress protector and its downregulation may induce stress conditions favouring the initiation and progression of tumorigenesis.
Materials and methods
Fly strains and genetics
All fly stocks were reared at 25°C on standard flour/agar Drosophila media. The Gal4/UAS system [58] was used to drive the expression of transgenes at 29°C. The following strains were provided by the Bloomington Drosophila Stock Center (BDSC) or the Vienna Drosophila RNAi Center (VDRC): Df(3R)BSC503 (BDSC 25007); Df(3R)ED6332 (BDSC 24141); hdc43 (BDSC 64063); hdc50 (BDSC 64064); hdcBG23007 (BDSC 12410); UAS-hdc (BDSC 64056); hdcRI (VDRC 104322); hdcR2 (VDRC 45069); hdcR3 (BDSC 30489); UAS-p35 (BDSC 5073); UAS-Rheb (BDSC 9689); UAS-Xbp1-EGFP (BDSC 60731); Xbp1RI (BDSC 36755); PEKRI (VDRC 110278); UAS-myristoylated-Tomato (BDSC 32222); UAS-CD8-GFP (BDSC 5137); UAS-src-GFP (BDSC 5429); UAS-myrRFP (BDSC 7138); hsp70-GFP (BDSC 51354); phmGal4 (BDSC 80577); fkhGal4 (BDSC 78060); apGal4 (BDSC 3041), UAS-GFPnls (BDSC 4776); TM3-cherry (BDSC 35524); puc-LacZ (BDSC 11173); The following strains are described in Flybase: nub-Gal4 [59]; Ci-Gal4 [60]; salE/PV [61]; amnc651 [10]. Gal4 drivers were recombined to UAS fluorescent markers described here. UAS-SOD1::UAS-Cat recombined construct was kindly provided by F. Serras. phmGal4::YPetAtet [16] was kindly provided by X. Franch-Marro. w118 strain was used as control.
Immunohistochemistry
For fluorescent imaging, PGs, wing discs and tracheas from L3 larvae were dissected in 1x phosphate-buffered saline (PBS) and fixed in 4% formaldehyde for 20 min at RT. The tissues were rinsed in 0.1% Triton X-100 (PBST), blocked in PBST + BSA 0.5% for 1h and incubated at 4°C with primary antibodies diluted in PBST + BSA 0.5% overnight. After incubation with primary antibodies, the tissues were washed with PBST (3 x 10min washes) and incubated with the corresponding secondary antibodies (Alexa Conjugated dyes 488, 555, 647, Life Technologies, 1:400) for 2 h at RT, followed by 3 x 10min washes with PBST, and then rinsed with PBS before mounting. The following primary antibodies were used: anti-HDC, U33, Developmental Studies Hybridoma Bank (1:3); anti-Dcp1 [Cell Signaling, Asp216 #9578] (1:100); anti-phospho-4EBP [Cell Signaling, (Thr37/46), #2855] (1:100); anti-Fibrillarin [Abcam, ab5821] (1:500); anti-phospho-RpS6, kindly provided by A. Teleman [24] (1:200); anti-phospho-p38 [Cell Signaling, (Thr180/Tyr182), (3D7) #9215] (1:50); anti-Dlg, 4-F3, Developmental Studies Hybridoma Bank (1:100); anti-βGalactosidase, 40-1a, Developmental Studies Hybridoma Bank (1:200); anti-GFP, Tebu-bio Rockland (1:500). The tissues were mounted in Vectashield medium with DAPI (Vector Laboratories, H1200).
Death scoring and timed sample collections
hdc mutant alleles were balanced with fluorescent TM3-cherry chromosome to select against the presence of fluorescence the homozygous mutants during embryonic and early larval stages. For death scoring during development, flies were allowed to lay eggs on agar plates supplied with fresh yeast paste for 2–3 h and 15–30 embryos were collected and split into plates containing standard fly food. The embryos were scored for genotype and monitored throughout development at 25°C in time intervals of 1–5 h during the daytime, while death events were scored till pupal stages. For pupariation timing, larvae were synchronized by allowing flies to lay eggs on agar plates supplied with fresh yeast paste for 2–3 h, and 20–30 freshly eclosed L1 per genotype were incubated at 25°C until they reach the pupal stage. Pupariation time was scored every 3–4 h during the daytime. The data obtained were ordered by time and cumulative percentages of pupariation and were analyzed in GraphPad Prism 8.4.3 Software.
20E rescue experiments
20E (Sigma, H5142) was dissolved in ethanol at 5 mg/ml. Standard fly food was supplemented with 0.5 mg/ml of 20E or an equal amount of ethanol (control). For rescue experiments, L3 larvae were collected and reared on 20E-supplemented medium or control medium with ethanol.
ROS detection
To detect ROS, we used the CellROX Deep Red Reagent (Life Technologies), an indicator of oxidative stress in living cells. Tissues were dissected in Schneider’s medium and incubated in 5 μΜ of CellROX in Schneider’s medium at 25°C for 20 min. The tissues were then rinsed with 1xPBS, fixed in 4% formaldehyde for 15 min and mounted in Vectashield medium with DAPI (Vector Laboratories, H1200). Confocal microscopy for the detection of fluorescence was performed within a maximum of 2 h after fixation to avoid signal loss.
Oxidative stress induction
Third instar larvae were transferred to vials containing standard fly food with 20 μg/mL paraquat. To minimize loss of oxidative capacity, paraquat was added to liquid fly food at 45°C. Third instar larvae were left to feed in this medium for 12 h prior to dissection. Controls were run in parallel with larvae fed the same medium without paraquat addition.
RNA extraction and qRT-PCR
After dissection in 1xPBS and isolation of the wing pouch region, total RNA was extracted from 10 wing discs per genotype using the Trizol reagent, further purified using RNeasy columns (Qiagen). For the quantification of ecdysone responsive genes, total RNA was extracted from whole larval extracts at 120h A.E.L. from 5 larvae per genotype. Reverse transcription was done using the High Capacity cDNA Archive Kit (Applied Biosystems). The 480 LightCycler was used for real time PCR reactions. Gene expression levels were normalized to actin42A and a-tubulin mRNA levels. The primers used in this study are listed in S1 Table.
Imaging, acquisition and image analysis
Images were obtained with Zeiss 780 and Zeiss 880 confocal microscopes, using the LD LCI PlanApo 25x 0.8 and Plan-Apochromat 63x/1.4 Oil DIC M27 objectives. For image acquisition, XY was set to 1024x1024 and the Z path was set to optimal as defined by the Zeiss ZEN lite software. The same imaging acquisition parameters were used for all the comparative analyses. Images were processed with the Imaris Software (Oxford Instruments) and Fiji [62]. For the quantification of apoptosis, the Dcp1-positive area was defined for each territory using Fiji and was normalized to the total wing disc area or the Gal4-expressing territory measured per disc. The same procedure was followed for the quantification of pS6 positive area, normalized to the apGal4 expressing area in apGal4/UAS-Rheb and apGal4/UAS-Rheb;UAS-hdc wing discs. Volumetric measurements were performed using the Imaris Software. Prothoracic gland cell count was done in Imaris after image segmentation based on the DAPI and GFP channels to define the cell nuclei found within the phmGal4-expressing areas. The C value of the same cells was also defined by an Imaris workflow. The intensity sum values of the DAPI channel for cells of the PG was normalized to the average of the intensity sum values of diploid nuclei of imaginal discs or tracheas of the same preparations. The Imaris spots function was used for the quantification of Atet vesicle structures in prothoracic glands of control and hdcRI larvae. For CellROX quantification, pixel intensity in 25 μm2 regions of sum intensity z-stacks of same total number of slices and path, were measured for each group in Fiji. Final Figures presented in this paper were produced in Adobe Photoshop CC software. The numerical data that resulted from image analyses can be found in S1 File.
Statistical analysis
Statistical analysis, data processing and graphical representations were performed in GraphPad Prism 8.4.3 Software. Welch’s t-tests were used to determine significant differences between two groups to correct for unequal sample distribution variance. For the comparison of more than two groups, Welch’s ANOVA was used, followed by Dunnett’s T3 post hoc tests for multiple comparisons between groups. Developmental profiles of phmGal4/+ and phaGal4/hdcRI populations were compared using Fisher’s exact test. Detailed data from the statistical analyses can be found in S1 File.
Acknowledgements
We are grateful to members of the Casanova, Franch-Marro, Martin and Llimargas labs for helpful discussions and to Nicolás Martín and Silvia Chafino for technical assistance. Thanks to Kyra Campbell, Marta Llimargas, Michalis Averof, Florenci Serras and Xavier Franch-Marro for critical reading of the manuscript and for sharing with us fly stocks and reagents. We also thank the Bloomington Drosophila Stock Center, the Vienna Drosophila Stock Center, the Developmental Studies Hybridoma Bank and Aurelio Teleman for kindly sending us fly stocks and antibodies.
References
1
2
3
4
5
6
7
8
9
10
11
12
13
14
15
16
17
18
19
20
21
22
23
24
25
26
27
28
29
30
31
32
33
34
35
36
37
38
39
40
41
42
43
44
45
46
47
48
49
50
51
52
53
54
55
56
57
58
59
60
61
62