
A Randomized Crossover Trial
Supplemental Digital Content is available in the text.
Exposure to traffic-related air pollution (TRAP) may contribute to increased prevalence of hypertension and elevated blood pressure (BP) for residents of near-highway neighborhoods. Relatively few studies have investigated the effects of reducing TRAP exposure on short-term changes in BP. We assessed whether reducing indoor TRAP concentrations by using stand-alone high-efficiency particulate arrestance (HEPA) filters and limiting infiltration through doors and windows effectively prevented acute (ie, over a span of hours) increases in BP. Using a 3-period crossover design, 77 participants were randomized to attend three 2-hour-long exposure sessions separated by 1-week washout periods. Each participant was exposed to high, medium, and low TRAP concentrations in a room near an interstate highway. Particle number concentrations, black carbon concentrations, and temperature were monitored continuously. Systolic BP (SBP), diastolic BP, and heart rate were measured every 10 minutes. Outcomes were analyzed with a linear mixed model. The primary outcome was the change in SBP from 20 minutes from the start of exposure. SBP increased with exposure duration, and the amount of increase was related to the magnitude of exposure. The mean change in SBP was 0.6 mm Hg for low exposure (mean particle number and black carbon concentrations, 2500 particles/cm3 and 149 ng/m3), 1.3 mm Hg for medium exposure (mean particle number and black carbon concentrations, 11 000 particles/cm3 and 409 ng/m3), and 2.8 mm Hg for high exposure (mean particle number and black carbon concentrations, 30 000 particles/cm3 and 826 ng/m3; linear trend P=0.019). There were no statistically significant differences in the secondary outcomes, diastolic BP, or heart rate. In conclusion, reducing indoor concentrations of TRAP was effective in preventing acute increases in SBP.
Traffic-related air pollution (TRAP) is the predominant contributor to poor air quality in developed countries. The 4% of the US population1 who reside near busy roadways, as well as those who travel on them, are exposed to elevated concentrations of TRAP—a mixture of gases and particulate matter (PM) enriched in fuel combustion byproducts, as well as nontailpipe emissions. These exposures can be an order of magnitude higher than urban background exposures.2
Both residential proximity to roadways and short-term exposures from time spent on roadways have been associated with adverse cardiovascular indicators and outcomes.3 Peters et al4 showed in a case-crossover study that exposure to TRAP was associated with myocardial infarction within 1 to 2 hours. Ghosh et al5 reported that residential proximity to major roadways and traffic density were responsible for 2.4% and 6.8% of coronary heart disease and deaths, respectively, in Los Angeles and neighboring counties. Living near roadways has also been linked to increased prevalence of hypertension and increases in blood pressure (BP).3,6
Controlled exposure to diesel particles and concentrated ambient fine PM (PM2.5; defined as particles with aerodynamic diameter <2.5 µm) from near-roadway locations has been shown to raise BP within 2 hours.7–10 There is also evidence that the particulate component of TRAP is the causal agent. For example, Mills et al7 reported that diesel exhaust exposure impaired vascular function but that filtered diesel exhaust (that retained its gaseous components) or pure carbon nano-PM did not. Similarly, Cosselman et al10 reported a rapid increase in systolic BP (SBP; peaking 30–60 minutes from the start of exposure) but not diastolic BP (DBP) or heart rate (HR), upon exposure to diesel exhaust. In contrast, studies of the effects of short-term exposures to gaseous components of TRAP mixtures on cardiovascular function and BP are scarce. In the few studies we were able to find, the associations with adverse effects for O3 exposure are mixed,11 while current evidence does not support an adverse acute effect of NO2 on vascular function.12
There have been over 90 studies assessing short-term effects of ambient ultrafine particles (UFPs; particles with aerodynamic diameter <100 nm and a component of TRAP) on cardiovascular indicators and outcomes.13 There are also a growing number of long-term studies of UFP and health, with a particular focus on residential proximity to roadways, but these studies have reported mixed findings in terms of associations with cardiovascular health.14,15 Relatively few have studied short-term effects of TRAP, or its specific components such as soot (or black carbon [BC]) and UFP, on BP.16
It is difficult to draw causal relationships between TRAP and BP because of the observational nature of epidemiological studies, which include uncontrolled confounders, such as noise,13–19 and exposures are often estimated based on central-site measurements, which introduces exposure error. Controlled exposure studies offer the potential to test associations under highly scripted and characterized conditions. However, studies with exposure concentrations that are realistically encountered proximate to highways are lacking. Furthermore, evaluation of the effectiveness of strategies to mitigate TRAP exposures, such as use of commercially available, stand-alone HEPA filtration, have, to date, shown limited benefits on BP and peripheral blood inflammation.17–19 Morishita et al19 found reductions in SBP in older adults living in an urban area with 3-day use of HEPA filtration, which also reduced indoor PM2.5, but PM2.5 is not a marker of TRAP emissions. Therefore, the aim of our study was to assess whether reducing TRAP exposure by limiting indoor infiltration and deploying HEPA filtration for a short duration could have a beneficial effect on BP.
The data that support the findings of this study are available from the corresponding author upon reasonable request.
The study design was a 3-exposure, 3-period crossover trial in which participants attended three 2-hour-long exposure sessions (1 each for low, medium, and high exposure in random order), all on same day of the week, separated by 1-week washout periods. Twenty-four sessions of each type were held, and participants were assigned to the exposure sessions using a Latin square design. Two to 4 participants attended each exposure session.
The inclusion criteria were age of 40 to 75 years and speaking either English or Chinese. The exclusion criteria were self-reported history of a major cardiovascular outcome (including myocardial infarction, stroke, and angina), other serious health problems (chronic obstructive lung disease or current asthma), taking antihypertensive medications, smoking or living with a smoker, cognitive impairment, working at a job with high-combustion exposure (eg, taxi/truck driver and restaurant cook), and high-combustion exposure in the preceding 24 hours (such as driving on a highway). The Tufts University Social Sciences institutional review board approved the study protocol.
Participants were instructed to avoid caffeine, to not drive, and to avoid exposure to traffic other than what was necessary to get from their home to the study location on the morning of exposures. Participants were preferentially recruited from neighborhoods close to the study locations that have outdoor TRAP levels similar to the exposure session location. Most participants walked; however, a few were transported to short distances in gasoline-powered cars driven with the in-vehicle air recirculation fan turned on to limit exposure before arrival. Before the first exposure, participants were oriented to what to expect during the sessions to reduce stress reactions. Exposure session type was not disclosed to the participants.
Participants arrived 15 to 20 minutes before the start of each exposure session. Upon arrival, they completed a questionnaire that assessed exposures that could potentially affect their BP. Measures included the validated 16-item Perceived Stress Scale,20 self-reported taking of any medications (day and hour last taken), location and activity for each hour in the preceding 48 hours, consumption of caffeine or alcohol past midnight the previous night, and vigorous physical activity in the last 24 hours by hour. If an exposure of concern was identified, which was rare, the participant was rescheduled.
Particle number concentrations (PNC) and BC concentrations were monitored continuously. PNC was measured using a water-based condensation particle counter (TSI, Inc; model 3873; d50=7 nm) at 1-second resolution and BC concentration was measured with an aethalometer (Magee Scientific; model AE16) at 1-minute resolution. For the first half of the sessions, temperature was measured centrally in the room, and for the latter half of the sessions, temperature was measured directly adjacent to each study participant with a temperature logger (Onset Computer Corporation; model HOBO UX100-003). Table S1 in the Data Supplement details the instruments.
Particle size distributions in a subset of exposure sessions (subset session count: low, 8; medium, 9; and high, 7) were measured with a Scanning Electrical Mobility Spectrometer (Brechtel Manufacturing, Inc). The particle counter operated with butyl alcohol as the condensing fluid and to prevent detectable butyl alcohol scent, the particle counter was enclosed in an airtight box that was vented outdoors. The Scanning Electrical Mobility Spectrometer measured particles between 5 and 600 nm in 59 size bins, executing a scan across the full size range every 75 seconds. Average particle size distributions were generated for high-, medium-, and low-exposure sessions by averaging all scans over the 2-hour exposure session duration and then averaging the same exposure types.
Participants were seated throughout the questionnaire (15 minutes) and exposure sessions (2 hours). During exposure, participants wore sound canceling headphones (Bose noise canceling wireless headphones), were instructed to refrain from doing anything, including reading or meditation, and asked not to fall asleep. If it appeared that a participant was falling asleep, which was rare (<5 instances), they were gently tapped and awakened. An ambulatory BP monitor (Suntech Oscar; Table S1) was placed on the dominant arm of participants and began recording at the start of each exposure session to record SBP, DBP, and HR every 10 minutes.
Exposure sessions were held at 2 near-highway locations (shown in Figure S1) where ambient air was enriched in TRAP. Most of the participants (n=63) attended exposure sessions in a ground-floor community room of a low-income housing development located near the intersection of I-90 and I-93 (average weekday daily traffic, 240 000 vehicles/day) in Chinatown, Boston. For the other 14 participants, sessions were conducted at another community room (on the ground floor in a multistory building) located in Somerville, MA, which was adjacent to I-93 and R38 (average weekday daily traffic, 215 000 vehicles/day). Sessions were conducted in the morning (during 06:00–09:00 hours) to coincide with rush-hour traffic and lower atmospheric dispersion, that is, when TRAP concentrations were expected to be the highest (verified by diurnal trends measured at a vicinal near-highway regulatory monitoring site [ID: 25-025-0044]).
Three levels of exposure—low, medium, and high—were attained by varying the degree of ventilation (and thereby infiltration) and by increasing or decreasing the number or blower setting of HEPA filtration units. Two brands of HEPA air filters were used at both locations: IQ Air Health Pro (1 unit) and Austin Air Healthmate 400 (up to 7 units with 4-stage filter, which also contained granular activated carbon and zeolite).
Based on air quality measurements before the exposure sessions, we determined that a concentration of ≈20 000 to 30 000 particles/cm3 could be expected during the high-exposure sessions and 10-fold lower concentrations could be attained in the low-exposure sessions. We targeted 33-50% lower than high-exposure concentrations, that is, 10 000 particles/cm3, for the medium-exposure sessions.
During low exposure, infiltration of outdoor air into the room was minimized by closing doors and sealing the cracks underneath with duct tape. Neither exposure room had operable windows. Filtration of TRAP was maximized by continually running air filters (4 units at the Somerville location and 8 units at the larger Chinatown location).
During medium exposure, infiltration was restricted by closing doors, but cracks underneath were left unsealed. Filtration was optimized to maintain indoor PNC in the 8000- to 12 000-particles/cm3 range by using 0 to 4 air filters.
During high exposure, infiltration was maximized by cross-ventilating the rooms by partially opening the doors that connected the room directly to outdoors and in the Somerville location, by adding a fan in addition to door opening (since cross-ventilation was not an option in that room). Air filters were not used during high exposures.
Both community rooms were located within a block of restaurants, which resulted in a noticeable odor during the last 30 to 45 minutes of some sessions when restaurants began cooking. Odor was only perceivable in some of the high-exposure sessions because this configuration allowed odors into the rooms.
A linear mixed model was used to analyze the 3-exposure, 3-period crossover design. The primary outcome measure was the change in SBP from 20 minutes after the beginning of each exposure session. Change from 20 minutes was chosen, rather than from the beginning of the exposure session (0 minutes), because a drop in mean SBP was observed within the first 20 minutes of the start of each exposure period. The final 30 minutes of the exposure sessions were excluded from the analyses as the data were deemed to be unreliable because participants became more restless and restaurant cooking odor became more apparent toward the end in some of the high-exposure sessions.
Before calculating change scores in each exposure session, each participant’s SBP measurements from 30 to 90 minutes were smoothed using a 3-time-period, centered moving average. A random intercept was included in the linear mixed model to account for the interdependence of the observations that arose by each participant attending each exposure session. In addition, the model included SBP at 20 minutes, mean room temperature over the 90-minutes for each session, and 2 time-varying covariates, PNC and BC concentrations. A Toeplitz covariance structure was used to characterize the interdependence of the observations over time. Period and carryover effects were assessed in the linear mixed model. The mean dose-response effect of filtration over a 60-minute period (between 30 and 90 minutes) was assessed for statistical significance using a linear contrast. An identical approach was used to analyze DBP and HR. PNC and BC concentrations were also analyzed using a linear mixed model with average room temperature over the 90-minute session as a fixed covariate and a Toeplitz covariance structure.
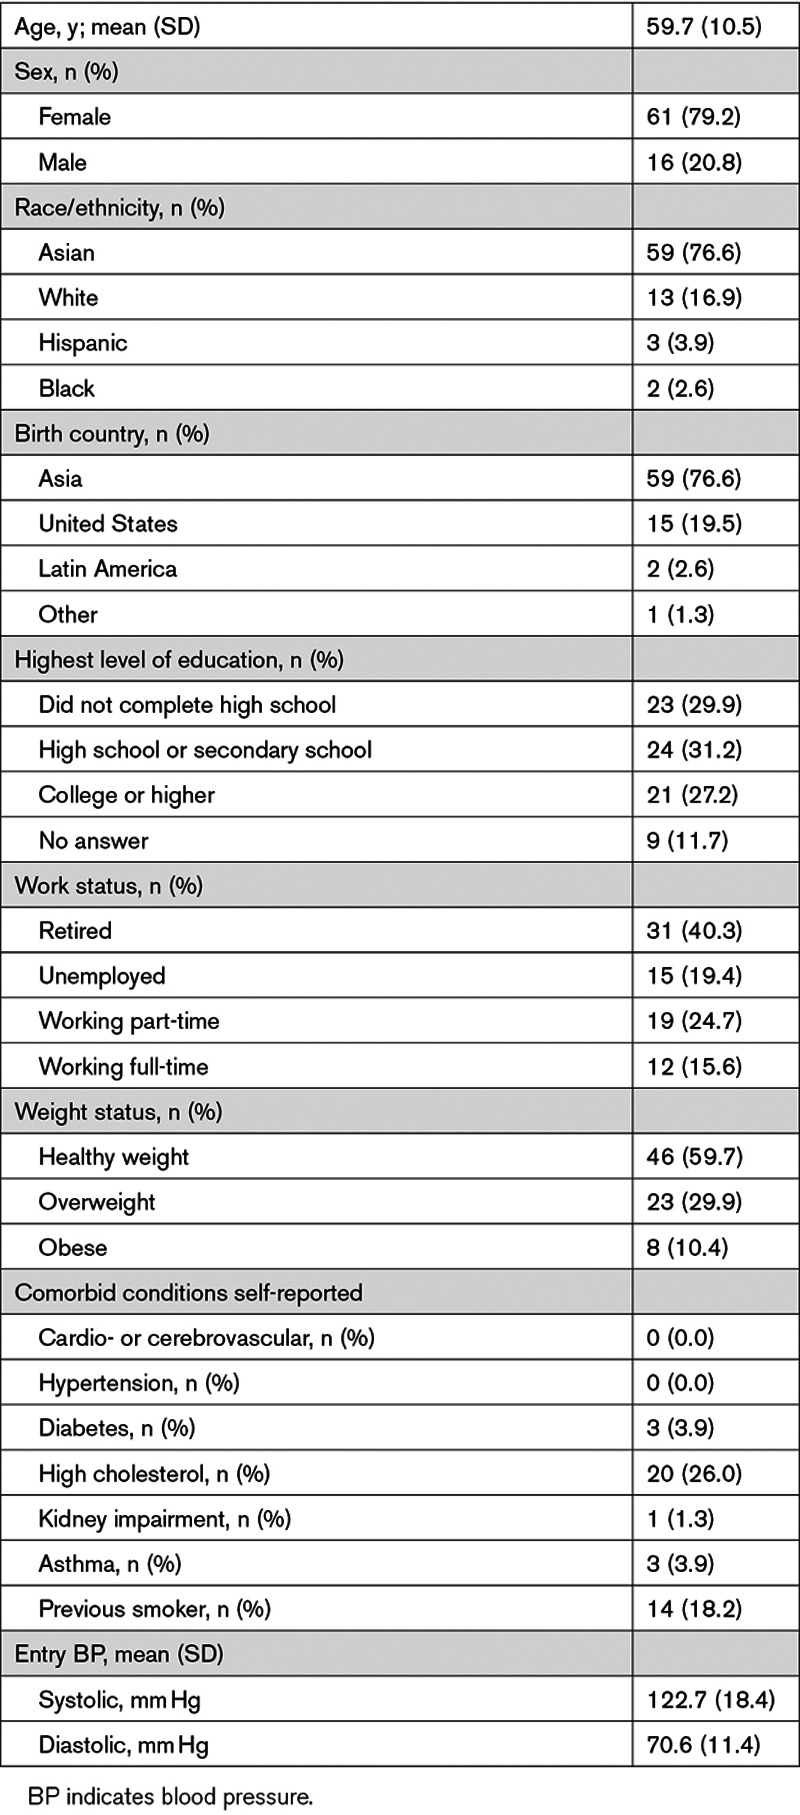
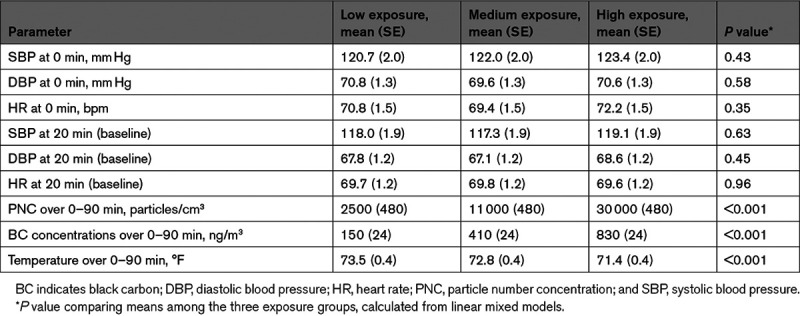
Table 1 summarizes the characteristics of the 77 participants. The average age was ≈60 years, and 80% were women. Approximately three-quarters of the participants were of Asian descent, and approximately two-thirds were either retired or unemployed. None reported diagnosis of hypertension or taking antihypertensive medications. None were current smokers, and 18% were previous smokers. The mean SBP, DBP, and HR at the beginning of the exposure session (0 minutes) and at baseline (20 minutes), shown in Table 2, were similar among the exposure groups.

The measured mean (SE) PNCs during high-, medium-, and low-exposure sessions were 30 000 (480), 11 000 (480), and 2500 (480) particles/cm3, respectively. (Table 2) Mean (SE) BC concentrations during high-, medium-, and low-exposure sessions were 830 (24), 410 (24), and 150 (24) ng/m3, respectively. On average for all participants, concentrations during high-exposure sessions were 14.4-fold elevated (ranged from 3.9-fold to 37.6-fold) for particle number and 8.0-fold elevated (ranged from 1.5-fold to 28.3-fold) for BC once compared with low-exposure sessions. Similarly, the fold elevation of medium to low was 4.9-fold (ranged from 1.4-fold to 13.5-fold) for PNC and 3.5-fold (ranged from 0.4-fold to 16.9-fold) for BC concentrations.
PNC and BC concentrations were relatively stable during the exposure sessions (Figure 1A and 1B; Figure S2). The coefficients of variation for 10-minute means (corresponding to the 10-minute intervals between BP readings) for high, medium, and low exposures were, respectively, 22%, 15%, and 16% for PNC and 23%, 15%, and 19% for BC concentrations.

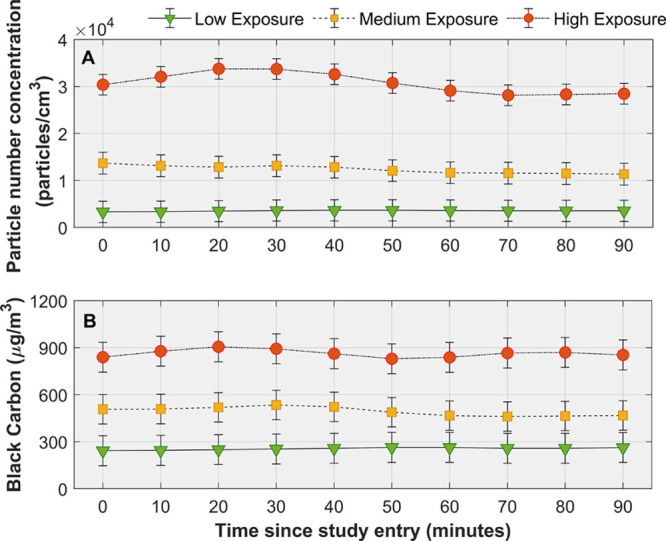
Mean particle number and black carbon concentrations over time by level of exposure. Mean particle number concentrations (A) and black carbon (B) concentrations over time by level of exposure. Means and corresponding 95% CIs (vertical lines) were derived from a linear mixed model that included average room temperature as a fixed covariate. Mean concentrations were significantly different among the three levels of exposure at all time points (P<0.001).
Mean (SE) indoor air temperatures were 71.4 (0.4), 72.8 (0.4), and 73.5 (0.4) °F, respectively, during high-, medium-, and low-exposure sessions. Temperature was on average lower during high exposures because more outside air, which was cooler, entered the exposure rooms.
Particle size distributions for low, medium, and high exposures were dominated by UFP (particles <100 nm; Figure 2A). The mean (SE) modes were similar for all exposure types: 25 (2), 29 (4), and 25 (3) nm for high, medium, and low exposure, respectively. Further, UFP comprised the majority of the total particles in all exposure types: 93% (1), 92% (2), and 89% (2) in the high, medium, and low exposures, respectively. However, there were large differences in size-resolved concentrations within ultrafine size range between exposure types. Figure 2B shows the mean difference in concentrations between high versus medium and high versus low exposures. Comparing high and medium exposures, the largest differences in concentrations were observed for particles in the ≈10- to 30-nm range (maximum at 20 nm of 4000 particles/cm3) while concentrations were similar for particles <10 and >30 nm. In comparison to the high-exposure sessions, the low-exposure sessions had lower concentrations for sizes >10 nm, and the difference was maximum for particles in the ≈15- to 50-nm range (maximum at 30 nm of 14 000 particles/cm3).
Mean changes in SBP over the entire 2-hour-long exposure sessions are shown in Figure S3, including the drop at the beginning and the erratic changes toward the end of the sessions. Restricting the analyses to the central 60 minutes (ie, 30–90 minutes), the low-exposure scenario was significantly effective in minimizing increases in SBP (Figure 3; Table S2A and S2B), despite SBP increasing linearly over time after 30 minutes in all 3 exposure scenarios (P<0.001). Specifically, the mean change in SBP between 30 and 90 minutes was 0.6 mm Hg for low exposure, 1.3 mm Hg for medium exposure, and 2.8 mm Hg for high exposure (linear trend P=0.019). There were no statistically significant differences in DBP and HR among the three exposure scenarios and their patterns over time were virtually the same (Figure 4A and 4B; Tables S3A, S3B, S4A, and S4B).
In a subgroup analysis, participants’ SBP at 20 minutes (baseline) values were dichotomized as normal (<120 mm Hg) or non-normal (≥120 mm Hg). For participants with normal baseline SBP, mean changes in SBP over a 60-minute period (between 30 and 90 minutes) were 2.2, 3.3, and 3.9 mm Hg for low, medium, and high exposures, respectively (linear trend P=0.13; Figure S4A). In contrast, for participants with non-normal baseline SBP, mean changes in SBP were −2.1, −1.1, and 1.4 mm Hg, respectively (linear trend P=0.034; Figure S4B).
We conducted a controlled crossover trial of TRAP and BP within a community setting rather than in an exposure chamber where high- and medium-exposure concentrations were similar to those people routinely encountering near-urban traffic. In this context, we showed that reducing indoor TRAP next to highways protected against increases in SBP. We used a randomized crossover design, which effectively eliminated confounding by personal factors, and achieved about an order of magnitude increase in PNC and BC concentrations between the low- and high-exposure sessions. We also effectively eliminated noise and physical activity—two factors not always addressed in prior exposure studies—further strengthening our findings.
Our primary interpretation of the findings is that reducing TRAP exposure by restricting infiltration and using stand-alone, commercially available HEPA filters can have beneficial effects on SBP in a short-term study. Our results suggest that use of HEPA filtration may be an effective intervention for reducing cardiovascular risk from exposure to TRAP. If the benefits that we observed can be sustained under everyday living conditions, it might be possible to reduce adverse effects of TRAP on SBP for near-highway residents and commuters.
While a 1- to 2-mm Hg difference in SBP is small, all the underlying plausible physiological mechanisms responsible (eg, endothelial dysfunction, vasoconstriction, sympathetic activation, renin-angiotensin system activation, and stress response) can contribute to acute cardiovascular events in susceptible individuals. Thus, BP elevation may serve as a biomarker of adverse pathways, leading to heightened cardiovascular risk. The adverse effects related to the acute BP elevation per se would likely be minor. However, if the stimulus, TRAP in our study, recurs or is sustained due to repeated exposures, it may promote long-term BP increase, which in turn could raise the risk for developing chronic hypertension. We also studied largely healthy individuals. Susceptible patients (elderly, diabetes, and existing heart disease) or those with preexisting hypertension could in theory have more robust BP-raising responses as has been shown elsewhere.21
Our results are consistent with prior controlled exposure trials7,10 of TRAP generated from diesel exhaust engines or ambient air; however, many of these trials used abnormally high concentrations. For example, Mills et al7 exposed 16 men for 2 hours while they exercised to (1) diesel exhaust (350 µg/m3 of PM0.1 and 2×10⁶ particles/cm3); (2) 60-fold lower particulate mass concentrations created by filtering the diesel exhaust (6 µg/m3 of PM0.1 and 2×10³ particles/cm3) in which gaseous pollutants were comparable to unfiltered diesel exhaust; and (3) to filtered ambient air (<1 µg/m3 of PM0.1 and <1×10³ particles/cm3). Consistent with our results, they reported that SBP, but not DBP, was higher for the unfiltered and filtered diesel exhaust scenarios, that is, 145±4 and 144±3 mm Hg, respectively, compared with filtered ambient air (133±3 mm Hg). Cosselman et al10 reported data on 45 participants who were exposed for 2 hours to ≈200 µg/m3 of diesel-generated PM2.5 and 5.3×10⁴ particles/cm3 and to carbon matrix and HEPA-filtered ambient air. Their exposure resulted in a 4.4-mm Hg increase in SBP ([CI, 1.1–7.7 mm Hg] P=0.0009) but not DBP or HR during the 30- to 90-minute exposure period.
In a crossover trial in Barcelona, Spain, Kubesch et al22 exposed 28 adults to high and low levels of TRAP in ambient air (in high- and low-traffic areas during the morning rush hour between 08:00 and 10:00 hours in Barcelona, Spain), with and without intermittent physical activity for 2 hours. They found that both SBP and DBP were higher after exposure to TRAP (but not within the 2-hour exposure window). An interquartile range change in BC and UFP concentrations was associated with 1.2- and 1.1-mm Hg increases in SBP, respectively. In contrast, Weichenthal et al23 reported null associations of SBP and DBP with BC and UFP in a crossover study where 53 female adults were exposed to high TRAP outdoors (11 400 particles/cm3 and 1012 ng/m3 BC) and low (2500 particles/cm3 and 652 ng/m3 BC), and to indoor air, while biking for 2 hours. It is possible that exercise stimulus obscured the effect of TRAP on BP.
It is also worth noting that our exposure concentrations reflect more realistic exposure scenarios. The average PNC during high-exposure sessions of 30 000 particles/cm3 was similar to the near-highway median concentration of 30 000 and 26 000 particles/cm3 reported by Patton et al24 in Somerville and Chinatown, respectively. Patton et al24 also reported median BC concentrations of 800 ng/m3 for both Somerville and Chinatown, which is similar to the average BC concentrations for high-exposure sessions in this study. Brugge et al17 reported an outdoor residential median concentration of 11 000 particles/cm3 (interquartile range, 9000–13 750 particles/cm3) for 23 homes in Boston area, which is equivalent to the average PNC for medium-exposure sessions in this study.
Our previous pilot trials of in-home HEPA filtration did not show health benefits on BP.17,25 Several limitations to those trials included inadequate number of BP measurements and participants on antihypertensive medications or who had had a major cardiovascular event. Our findings in this study contribute meaningful evidence from a causal standpoint that near-highway TRAP is a source of adverse cardiovascular health effects for people exposed to high concentrations. There is evidence that the inhalation of particles can (1) trigger acute autonomic imbalance, (2) cause acute endothelial/vascular dysfunction favoring vasoconstriction and acute worsening of aortic compliance, and (3) increase bioactivity of endothelins or renin-angiotensin system activation. A role for directly inhaled nanoparticles or constituents reaching the systemic circulation having a direct effect upon the vasculature is also plausible albeit less well demonstrated. Each of these factors alone or together could play a role in elevating BP within hours of exposure to airborne particles.26,27
Although we selected participants who were not on antihypertensive medications, 40% of our study participants had SBP that was above the normal benchmark. Comparing participants with elevated versus normal SBP, we found greater effectiveness of low exposure among those with elevated SBP. As SBP has a biological lower limit, this may simply be due to participants with elevated SBP having a greater available range for lowering BP than those with already normal SBP. Our results are consistent with subgroup findings in meta-analyses.28,29
Our particle size distribution observations indicate size-dependent effectiveness of HEPA air filters in UFP range. The majority of the effectiveness studies of portable HEPA filters focus on micron size or larger particles.30 In one study, Singer et al31 measured UFP reductions by stand-alone HEPA filters and reported that they were equally or more effective at reducing fine particles and UFPs compared with built-in mechanical ventilation systems with HEPA filtration. The most penetrating particle size for HEPA filters has been observed to range from 30 to 110 nm. Because particle deposition efficiency (and deposition location) in the human body is a function of particle size, health effects could differ by particle size class. Further research is needed to characterize the size-dependent efficiency of portable HEPA filers under different loading conditions and to evaluate whether the ability of some size ranges to escape filtration is important for health benefits of air filter interventions.
Our study had a few limitations. The short-term exposures we studied cannot be assumed to translate into long-term cardiovascular risk. Nonetheless, recurrent and sustained increases in SBP could plausibly contribute to risk of adverse health outcomes. It is also important to recognize that effects seen in our carefully structured setting could be too subtle to document in an actual lived context.
We cannot rule out the role for TRAP gases, which we did not measure and whose concentrations are expected to vary between exposure types, because changes in room ventilation affect both particles and gases. Further, the stand-alone HEPA filters we used also contained granular carbon (to remove volatile organic compounds) and zeolite coating (to remove moisture), which could have affected concentrations of gases. Nevertheless, there is limited evidence that gases (with the exception of ozone, which is typically low in TRAP due to scavenging by nitrogen oxide) elevate short-term BP compared with PM.7,10,11 In addition, while traffic was the dominant source of air pollution at our sites, there were additional sources nearby, especially restaurants, which may preclude attribution of our results solely to TRAP. The exposure session configurations themselves had some challenges. It is possible that the exposure sessions were not completely blinded as the number of filters, airflow rate, and outdoor odors varied between sessions, along with visual differences in room configuration. Sound that was not completely canceled and differences in airflow rates could have resulted in temporal confounding. Despite participants arriving early and relaxing before their exposure session, their SBP still dropped during the first 20 minutes. Having participants sitting idle and awake for 2 hours contributed to their drowsiness and restlessness toward the end of the sessions and unreliable SBP measurements after 90 minutes. These two factors limited the analyses to the central 60 minutes of the exposure session. Finally, the study participants were primarily Chinese female immigrants living in locations of high TRAP, so the findings may not be generalizable to other populations.
In a community-based setting, we provide strong evidence that reducing exposure to TRAP-enriched air resulted in positive effects on SBP. If applicable to longer time frames and exposures during regular life activities, which needs to be tested in efficacy trials, our findings are consistent with use of portable, stand-alone, commercially available HEPA filters to reduce TRAP exposure and cardiovascular risk from TRAP.
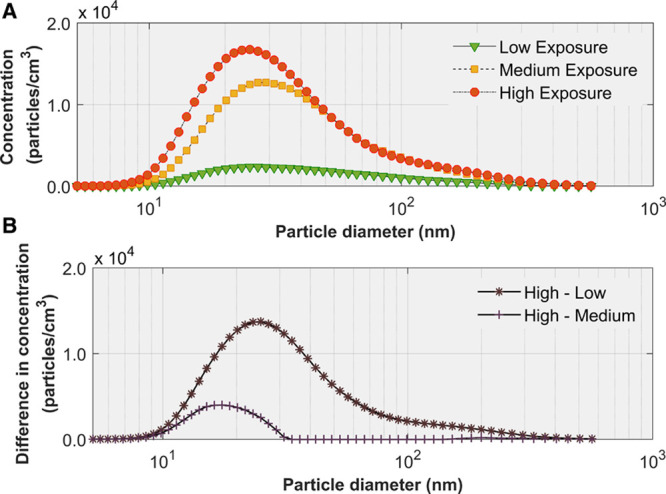
Particle size distributions. A, Mean indoor particle size distributions by level of exposure. Error bars represent SE. B, Mean reduction in particle concentrations between high-to-medium exposures and between high-to-low exposures.
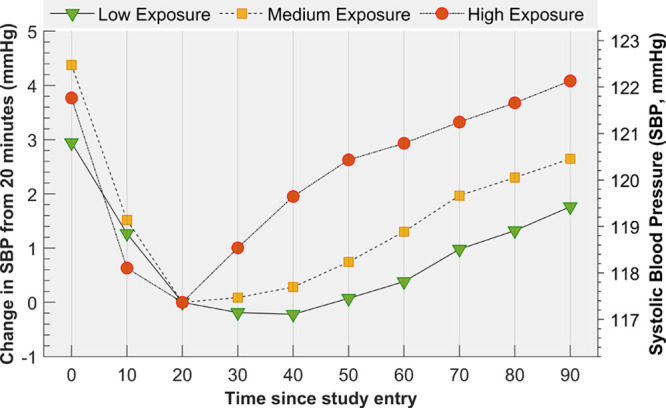
Means and mean changes in systolic blood pressure (SBP) over time by level of exposure. The estimates were derived from a linear mixed model that included 2 fixed covariates, SBP at 20 min and mean room temperature, and 2 time-varying covariates, particle number and black carbon concentrations. Over the 1-h time period, from 30 to 90 min, the mean change in SPB was significantly different among the three levels of exposure (linear trend P=0.019). Mean changes in SBP were significantly different between the low and high levels of exposure as early as 40 min (P=0.048).
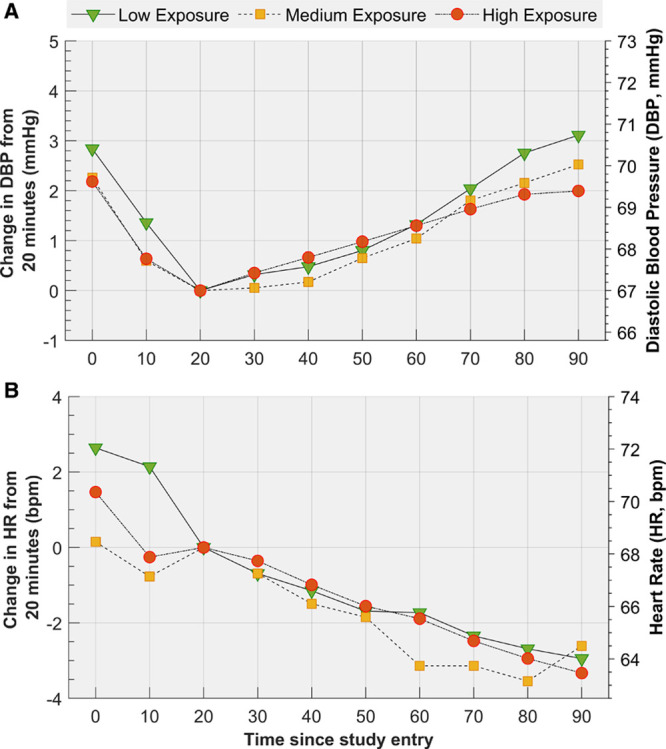
Means and mean changes in diastolic blood pressure (DBP) and heart rate (HR) over time by level of exposure. Means and mean changes in diastolic blood pressure (DBP; A) and heart rate (HR; B) over time by level of exposure derived from a linear mixed model that included 2 fixed covariates, DBP at 20 min and mean room temperature, and 2 time-varying covariates, particle number and black carbon concentrations. Mean changes in DBP and HR were not significantly different among the three levels of exposure (linear trend P=0.64 and P=0.94, respectively).
We acknowledge contributions from David Chen and William Kuttner (Central Transportation Planning Staff for providing traffic statistics) and the generosity of Mystic View Task Force and Tai Tung Association for allowing the use of community rooms for the exposure sessions. D. Brugge was of the grant. He designed the study, supervised data collection and analysis, wrote parts of the manuscript, and edited it extensively. N. Hudda designed and conducted the exposure sessions, analyzed air monitoring data, and played a leading role in writing the manuscript. M. Eliasziw assisted with the study design, performed the health-related statistical analyses, and contributed to writing the manuscript. S. Hersey collected and analyzed particle size distributions and contributed to the manuscript. E. Reisner was MPI of the grant and reviewed the manuscript. R.D. Brook helped design the study and contributed to interpretation of the findings. W. Zamore assisted with designing the study and contributed to the data collection and interpretation of the data. J.L. Durant designed the exposure sessions, supervised air monitoring and analysis, and assisted with editing the manuscript.
This research was supported by the National Institute of Environmental Health Sciences (R01-ES026980 and R01-ES030289) and acknowledges use of Tufts CTSI resources (UL1TR002544).
None.
| BC | black carbon |
| BP | blood pressure |
| DBP | diastolic blood pressure |
| HR | heart rate |
| PM | particulate matter |
| PNC | particle number concentration |
| SBP | systolic blood pressure |
| TRAP | traffic-related air pollution |
| UFP | ultrafine particle |
1.
2.
3.
4.
5.
6.
7.
8.
9.
10.
11.
12.
13.
14.
15.
16.
17.
18.
19.
20.
21.
22.
23.
24.
25.
26.
27.
28.
29.
30.
31.
This is the first randomized controlled trial to demonstrate that reducing traffic-related air pollution exposure in a controlled setting can prevent acute increases in systolic blood pressure.
Reducing indoor exposure to traffic-related air pollution by high-efficiency particulate arrestance (HEPA) filtration and limiting indoor infiltration by simple means may reduce the risk of hypertension for people who live close to major roadways.
The randomized crossover study design permitted assessment of systolic blood pressure levels being affected by reductions in exposure to traffic-related air pollution.
 Effect of Reducing Ambient Traffic-Related Air Pollution on Blood Pressure
 Facebook
 Twitter
 Linkedin
 Whatsapp
