 A Bayesian Mutation–Selection Framework for Detecting Site-Specific Adaptive Evolution in Protein-Coding Genes
Molecular Biology and Evolution


- Altmetric
In recent years, codon substitution models based on the mutation–selection principle have been extended for the purpose of detecting signatures of adaptive evolution in protein-coding genes. However, the approaches used to date have either focused on detecting global signals of adaptive regimes—across the entire gene—or on contexts where experimentally derived, site-specific amino acid fitness profiles are available. Here, we present a Bayesian site-heterogeneous mutation–selection framework for site-specific detection of adaptive substitution regimes given a protein-coding DNA alignment. We offer implementations, briefly present simulation results, and apply the approach on a few real data sets. Our analyses suggest that the new approach shows greater sensitivity than traditional methods. However, more study is required to assess the impact of potential model violations on the method, and gain a greater empirical sense its behavior on a broader range of real data sets. We propose an outline of such a research program.
Introduction
Codon substitution models (Goldman and Yang 1994; Muse and Gaut 1994) are among the important modern tools used for uncovering potential signals of molecular adaptation from protein-coding gene alignments. One set of broadly used models focuses on estimating the ratio of rates of nonsynonymous (dN) and synonymous (dS) substitutions. These models introduce a multiplicative parameter, denoted ω, to entries in a codon substitution matrix corresponding to nonsynonymous events. Because ω is the only distinction between the rate specification of nonsynonymous and synonymous events, it directly corresponds to .
Fitting a model with a single (global) nonsynonymous multiplicative parameter almost always leads to (Yang 2006), given the pervasive purifying selection that operates at most codon sites over most of evolutionary history. Many efforts were thus made to develop codon substitution models with distributions of ω values across sites and/or across the branches of a phylogeny (reviewed in Yang 2019). A common objective of such developments is to uncover specific sites having evolved under an adaptive regime (e.g., with ), perhaps along a particular branch of the phylogeny.
Meanwhile, another set of codon substitution models was proposed, with a focus on accounting for purifying selection at the amino acid level in a site-heterogeneous manner (Halpern and Bruno 1998). Having nucleotide-level parameters controlling a mutational process, and amino acid fitness profiles controlling selection, they have come to be known as mutation–selection models (e.g., Yang and Nielsen 2008; Rodrigue et al. 2010). In these models, the dN/dS ratio is not explicitly parameterized. Instead, it is an emerging quantity, induced by the interplay between mutation, selection, and drift. Spielman and Wilke (2015) have shown how to calculate the dN/dS induced by the mutation–selection framework—which we denote ω0 (Rodrigue and Lartillot 2017)—and found that, under specific conditions (i.e., a substitution process at equilibrium, without selection on synonymous variants), it is always true that , as expected from a model focused on purifying selection.
In the last few years, the mutation–selection framework has been extended for the purpose of detecting genes having evolved under an adaptive regime, in either a global (Rodrigue and Lartillot 2017) or site-specific (Bloom 2017) manner. Like their traditional predecessors, these recent mutation–selection models introduce a multiplicative parameter on nonsynonymous rates. However, because amino acid profiles are also involved in modulating nonsynonymous rates, such a multiplicative parameter—which we denote as (Rodrigue and Lartillot 2017)—cannot be interpreted as the dN/dS ratio; we chose to emphasize this distinction with an asterisk in the notation. Given that the mutation–selection formulation itself induces a certain dN/dS ratio, ω0, the net overall dN/dS ratio, ω, can be thought of as , which can be rearranged to . The latter equation helps clarify the interpretation of as a measure of the deviation in nonsynonymous rates from the expectation under the pure mutation–selection equilibrium; in particular, indicates that nonsynonymous rates are higher than expected, even though they might not be so high as to lead to .
New Approaches
Here, we conduct the first exploration of a Bayesian mutation–selection model with site-heterogeneous amino acid fitness profiles and site-heterogeneous values. The Bayesian nature of the model qualifies it as a random-effects approach, in contrast to the fixed-effects approach utilized to date in maximum-likelihood versions of mutation–selection models (Halpern and Bruno 1998; Holder et al. 2008; Tamuri et al. 2014; Bloom 2017).
Results and Discussion
Models with Global ω or
We first contrasted the difference in behavior between a traditional codon substitution model inspired from Muse and Gaut (1994), with a global ω parameter (a traditional model we denote MG-M0, described in detail in the Materials and Methods section), and a mutation–selection model with a Dirichlet process prior on amino acid profiles across sites and a global parameter (a model presented in Rodrigue and Lartillot, 2017, which we denote here as MutSel-M0*, and also described in the Materials and Methods section).
Simulations
Figure 1 shows results of the two models on data generated through a simulation approach explicitly allowing for fluctuating selection at some sites; for these sites, amino acid fitness profiles change along the branches of the phylogeny, as described in Rodrigue and Lartillot (2017) and in the Materials and Methods section. The simulation system is an attempt at mimicking an adaptive substitution process, where the simulated substitution history tracks a changing amino acid fitness optimum along the branches of the tree, and thus accrues more nonsynonymous substitutions than expected under a pure nearly neutral regime (i.e., mutation–selection balance). An important distinction with Rodrigue and Lartillot (2017) is that here the simulated data set contains only 10% of codon sites generated under adaptive regimes, and 90% of codon sites generated under a pure nearly neutral mutation–selection formulation (Rodrigue et al. 2010). We produced alignments of 300 codons in length, repeating the simulation thrice, with different sets of empirically inferred amino acid profiles (see Lowe and Rodrigue 2020, and the Materials and Methods section).

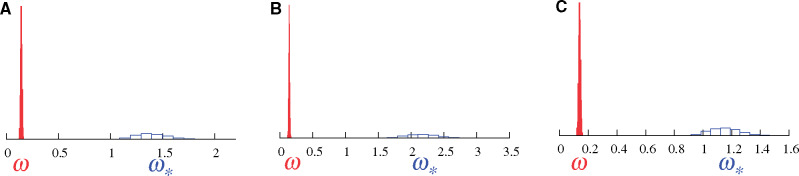
Posterior distributions of ω (red, under MG-M0) and (blue, under MutSel-M0*) on simulated data sets with 10% of sites evolved under adaptive evolution (see Materials and Methods section).
Results under the traditional MG-M0 model (red) reflect the overall purifying selection governing most of the data-generating processes, with posterior mean ω values at 0.14, 0.15, 0.13 in three replicates displayed in panels 1A, 1B, and 1C, respectively. The fact that 10% of sites where produced under an adaptive regime is underwhelming to the MG-M0 model, and indeed little is generally expected of it in practice. Results under the MutSel-M0* model (blue) show a posterior distribution for situated above 1, with (where D refers to the data set) for the first two replicates (fig. 1A and B); indeed, the second replicate has a posterior mean that surpasses 2. For the third replicate, we find a slightly lower probability, at , still highly suggestive of a signal for adaptive evolution.
Previous studies (Rodrigue and Lartillot 2017; Lowe and Rodrigue 2020) have shown that a simulation conducted with 100% of sites under the pure nearly neutral mutation–selection formulation leads to a posterior distribution of situated around 1 (while the ω parameter inferred under the MG-M0 model on such simulated data tends to be closer to 0 than to 1, as shown in Rodrigue and Lartillot 2017). Here, however, 10% of sites have evolved with higher than expected nonsynonymous rates, which pulls the distribution of to the right. Already with the use of single additional parameter, , the mutation–selection framework allows us to detect adaptation where the traditional framework with a single ω parameter would not. Note that these results are under ideal conditions, however, free of the numerous potential model violations present in real data that could sway inferences of .
Real Data
Figure 2 shows the results of these models on a hand-full of real alignments. Figure 2A displays the results on the well-known β-Globin alignment sampled across 17 vertebrates (Yang et al. 2000). As in the simulation, the MG-M0 model indicates that . In contrast, under MutSel-M0*, the posterior mean of is around 1.8, with a high posterior probability in favor of a value greater than 1, , suggesting the presence of adaptive evolution in this gene. As described with the simulation experiment presented above, and assuming negligible effects of potential model violations, adaptive evolution on even a relatively small fraction of the sites of the gene could be sufficient to induce such a rightward shift in the posterior distribution of .
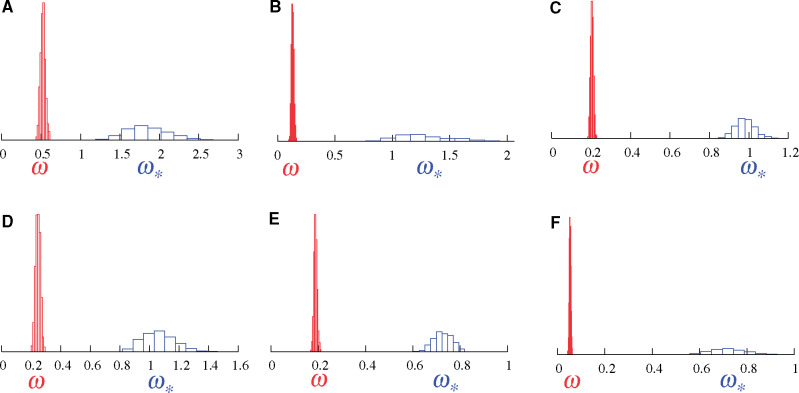
Posterior distributions of ω (red, under MG-M0) and (blue, under MutSel-M0*) on β-Globin, Adh, Vwf, Adora3, Rbp3, S1pr1 data sets (see Materials and Methods section).
Figure 2B displays results on an alignment of the alcohol dehydrogenase (Adh) gene sampled across 23 species of Drosophila. Here again, the MG-M0 model indicates that , with a posterior mean ∼0.13. In contrast, with the MutSel-M0* model, we find a posterior mean ∼1.2, and . As for the β-Globin alignment, and again assuming no major effects from potential model violations, this result could be explained by a fraction of sites evolving under adaptive evolution regimes. No previous phylogenetic approach has found signals of adaptive evolution in this gene, in spite of the fact that population-genetic approaches have long suggested adaptation in many instances (e.g., McDonald and Kreitman 1991; Matzkin and Eanes 2003; Matzkin 2003). While a specific scenario of Adh adaptation in specific species has been refuted by Siddiq and Thornton (2019), their study nonetheless provides strong experimental evidence of major fitness effects of some mutations, suggesting adaptive opportunities across Drosophila.
The four remaining panels of figure 2 (C–F) show results on four genes sampled across placental mammals (Lartillot and Delsuc 2012). Again, in all four genes, whereas is either around 1, or slightly below, which does not suggest adaptive evolution in these genes across placental mammals. This does not rule out the possibility that some of these genes have some sites under adaptive evolution, but perhaps these sites are too few and/or too mildly adaptive to raise beyond 1. Previous simulations studies have pointed to epistasis (Rodrigue and Lartillot 2017) or weak evolutionary signal (Lowe and Rodrigue 2020) as potential reasons for < 1. In the absence of major effects from model violations, these are conditions that tend to make the model conservative in the detection of adaptive regimes.
Models with Heterogeneous ω or
In spite of the potential of the MutSel-M0* model—able to capture relatively subtle signals of adaptive evolution—it still does not directly allow us to pinpoint which sites are most responsible for such signals. This is one of the motivations of site-models. Classical site-models (Nielsen and Yang 1998; Yang et al. 2000; Yang and Swanson 2002) consider alignment sites as having been produced from a distribution of possible ω values. They are typically used in the context of an empirical Bayes approach for identifying sites with a strong statistical support for a ; and they are more efficient at detecting positive selection than the simple MG-M0 model with a single ω for all sites. For instance, they do find sites under positive selection in the case of the β-Globin gene (detailed below, but also see Yang et al. 2000). On the other hand, site-models might still miss those sites under weaker positive selection. In particular, an adaptive regime at a site could be sufficiently strong to increase the dN/dS ratio, but not to the point of driving it well above 1. In other words, at least in their current version, these models might present the same limitation as the classical MG-M0 model, as compared with MutSel-M0* model, although now at the level of the single site. This in turn suggests that the rationale of estimating in the context of a mutation–selection model should be explored not just globally over the whole gene (Rodrigue and Lartillot 2017), but as a distribution across sites of the gene (Bloom 2017).
To illustrate this point, and for simplicity here, we work with the classical MG-M3 model, inspired from Muse and Gaut (1994) and Yang et al. (2000), which invokes a finite mixture of three ω values—with their respective weights—jointly estimated with all other parameters given the data. We also study a new model referred to as MutSel-M3*, which is built from a finite mixture of three values, and respective weights, combined with the Dirichlet process prior on amino acid profiles across sites, and global mutational parameters. The two forms of across-site heterogeneity are independent in the model construction, in that each site draws its amino acid profile and its independently from the two corresponding mixtures.
Simulations
As a verification, figure 3 shows the results under the MG-M3 (red) and MutSel-M3* (blue) models on three simulated data sets, this time generated entirely under the pure mutation–selection framework (i.e., no adaptive regimes within the data-generating processes). In accordance with the simulation, no sites have high probabilities of having (or ). Most sites have posterior probabilities of ranging from 0 to 0.5, or not much more, suggesting that the MutSel-M3* model tends to mildly underestimate some site-specific values. One possible reason for such underestimates is the fact that, in its current form, the mutation–selection apparatus utilized tends to overestimate ω0 (the nonsynonymous to synonymous rate ratio induced by the amino acid fitness profiles), as shown by Spielman and Wilke (2015). Overall, however, if the data-generating process does not depart too drastically from the model’s assumptions, this behavior tends to make MutSel-M3* conservative vis-à-vis inferences of adaptive evolution.
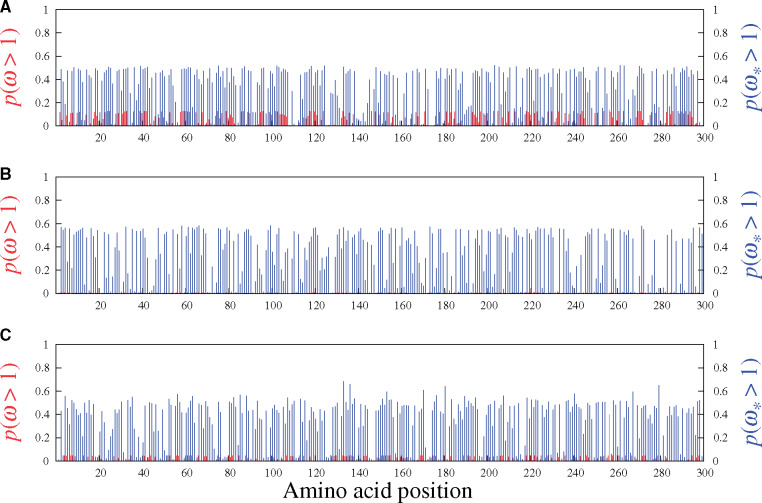
Site-specific posterior probabilities of ω (red, under MG-M3) and (blue, under MutSel-M3*) being greater than 1 on data sets simulated under the pure mutation–selection framework.
These simulations also highlight an inherent risk built into the MutSelM3* model’s construction, in comparison with MG-M3: the threshold for a site to considered of interest—in terms of potential adaptive evolution—is much closer to the value expected under the null (of no adaptive regime) under MutSelM3* than under MG-M3, with the latter reporting site-specific probabilities of having that are close to 0; for the second replicate in particular (fig. 3B), never surpasses 0.007. In other words, finding a site with under the MG-M3 model represents a dramatic increase in nonsynonyomous rate, compared to finding one with under the MutSelM3* model, which could make MutSelM3* more vulnerable to false positives from stochastic effects, or from the effects of model violations.
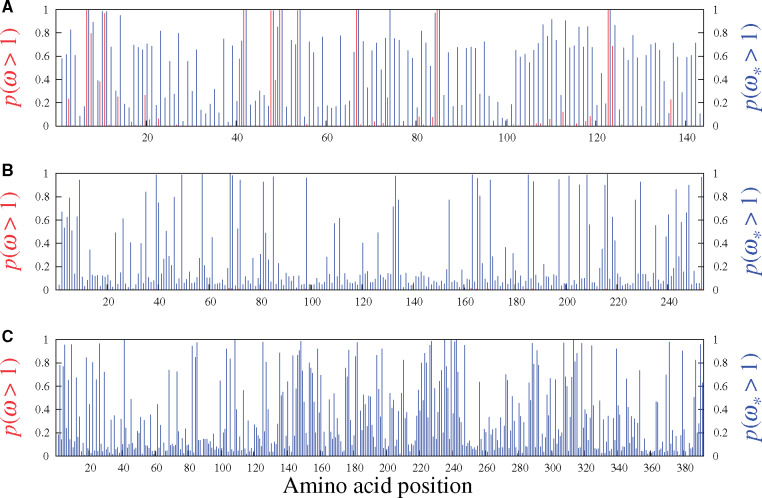
Figure 4 shows the results on the three simulated data sets studied in figure 1 (i.e., with 10% of sites simulated with an adaptive regime). The panels include vertical marks at the top, showing the 30 codon sites simulated under adaptive regimes. Sites evolving under an adaptive regime tend to accrue more nonsynonymous substitutions than under a nearly neutral regime, which would shift to the right of the unit. With a threshold posterior probability of 0.95 for , the MutSel-M3* model correctly identifies 23/30 sites (76%), calls 1 false positive, and misses 7 sites for the first and second replicates, whereas for the third replicate it correctly identifies 20/30, with no false positives. Of note, a single false positive out of 24 discoveries, using a threshold of 0.95, corresponds to an accuracy of ∼96%, thus suggesting that the posterior probabilities are reasonably well-calibrated, reflecting our actual rate of true discovery. The MG-M3 models identify no sites at this threshold, although the plot suggests that it nonetheless faintly detects some adaptive signal. Interestingly, the sites leading to false positives under the MutSel-M3* model also tempt the MG-M3 model; the simulations are stochastic processes, and can, from time to time, accumulate a disproportionately high number of nonsynonymous substitutions, even when the configuration of the simulating model is one of pure mutation–selection balance. In other words, false positives may not come about solely as a result of a problem with MutSel-M3* model itself, but rather, at least partly, from a chance occurrence in the simulation. Still, this demonstrates the increased risk of the MutSelM3* model over MG-M3. However, the MG-M3 model also clearly lacks sensitivity; the sure way of having no false positives is to have no positives at all. It is particularly noteworthy that some of the sites correctly identified by MutSel-M3* show virtually no signal under MG-M3 (e.g., sites 52, 103, 285 in the first replicate, fig. 4A). In contrast, all of the sites simulated with an adaptive regime but missing the 0.95 threshold under MutSel-M3* nonetheless have relatively high probabilities of having . Overall, under ideal conditions, the MutSel-M3* model seems to have considerably greater sensitivity than the traditional-style MG-M3, at the cost of a mildly increased risk of false positives.
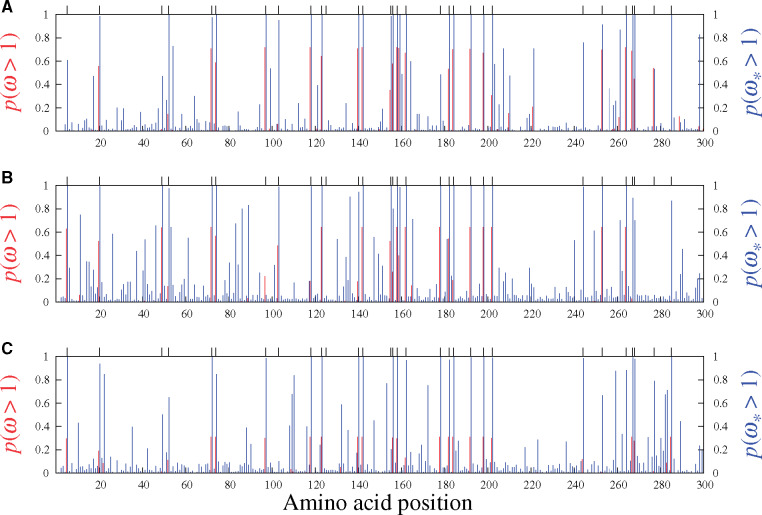
Site-specific posterior probabilities of ω (red, under MG-M3) and (blue, under MutSel-M3*) being greater than 1 on data sets simulated with 30 sites (marked with at top of panels) under an adaptive regime, and the remaining 270 sites under the pure mutation–selection framework.
Real Data
Figures 5 and 6 display the results obtained from analyzing the six real data sets mentioned above with the MG-M3 and MutSel-M3* models. For the β-Globin alignment (fig. 5A), our Bayesian version of the classic MG-M3 model leads to the same set of sites identified with these traditional models in the maximum likelihood context (Yang et al. 2000): at the 95% threshold, the sites are 7, 11, 42, 48, 50, 54, 67, 85, and 123. Under the MutSel-M3* model, these same sites are also found, and the following three are added: 10, 74, and 84. (The complete lists of sites identified at different thresholds are reported in table 1.) It is interesting to note that the MG-M3 model found for site 10, for site 74, and for site 84. These last three sites, and site 84 in particular, yield results compatible with the interpretation of having evolved under a mild adaptive regime, of changing amino acid fitness profiles over time, leading to an increase in nonsynonymous rate; the increase is not to the point where at a site in question, although it is enough for . Sites 10 and 74 are known to be involved in oxygen affinity, which could indeed make them a target for adaptive evolution.
Site-specific posterior probabilities of ω (red, under MG-M3) and (blue, under MutSel-M3*) being greater than 1 on β-Globin, Adh, and Vwf.
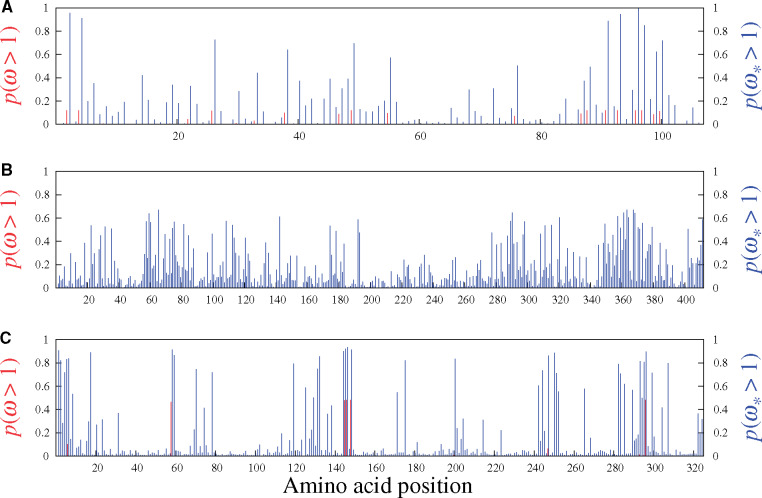
Site-specific posterior probabilities of ω (red, under MG-M3) and (blue, under MutSel-M3*) being greater than 1 on Adora3, Rbp3, and S1pr1.

| Data | Model | Sites |
|---|---|---|
| MG-M3 | 7, 11, 42, 48, 50 54, 67, 85, 123 | |
| Globin | ||
| MutSel-M3* | 7, 10, 11, 14, 42, 48, 50 54, 67, 74, 84, 85, 110, 113, 123 | |
| MG-M3 | – | |
| Adh | ||
| MutSel-M3* | 9, 39, 49, 57, 68, 69, 72, 81, 85, 98, 133, 163, 165, 170, 185, 187, 197, 201, 205, 208, 216, 229, 253 | |
| MG-M3 | – | |
| Vwf | ||
| MutSel-M3* | 5, 9, 26, 41, 82, 85, 103, 108, 125, 147, 148, 158, 177, 182, 197, 226, 227, 235, 239, 241, 242, 247, 288, 291, 307, 313, 318, 324, 339, 371, 379, 390 | |
| MG-M3 | – | |
| Adora3 | ||
| MutSel-M3* | 2, 4, 93, 96 | |
| MG-M3 | – | |
| Rbp3 | ||
| MutSel-M3* | – | |
| MG-M3 | – | |
| S1pr1 | ||
| MutSel-M3* | 1, 58, 144, 145, 146, 148 |
Note.—Numbers in italic font are at the 0.9 level, in plain font at the 0.95 level, and in bold font at 0.99 level.
The sites uncovered by MutSel-M3* on the β-Globin data set are conditional on the overall construction of the model, which makes many oversimplified assumptions. As such, the list of sites should be considered provisional, in need of more thorough investigation by external means, and in the context of a larger scale application of the model. Some of the model violations potentially at play here, and that have mislead other types of approaches to detecting adaptive evolution, include variable effective population size (Rousselle et al. 2018), biased gene-conversion (Ratnakumar et al. 2010), multinucleotide mutations (Venkat et al. 2018), and nonhomogeneous/nonneutral synonymous substitution rates (Wisotsky et al. forthcoming). Richer simulation studies will be needed to better understand how the MutSel-M3* model reacts to such violations, and the extent to which they could be responsible for false positives.
Results of the analysis of Adh (fig. 5B, table 1) suggest several sites under adaptive evolution under the MutSel-M3* model, whereas the MG-M3 yields posterior probabilities of at all sites that are numerically indistinguishable from 0. Given that most studies suggesting adaptation in this gene have relied on population-genetic methodologies, which pool the statistics across all sites, a comparison of sites uncovered by the MutSel-M3* model with previous results is not possible.
As with the analyses of the β-Globin data set, much more work will be required to determine the plausibility of these new results on the Adh data set. In addition to the aforementioned potential model violations, with a sampling across Drosophila, which have high effective population sizes, features such as uneven codon usage can become highly pronounced (Powell and Moriyama 1997), potentially misleading inferences of site-specific adaptation as well. As a hypothetical example, suppose that the codon TTG is used almost exclusively for encoding leucine, and that GTG is similarly strongly favored for encoding valine. Also suppose that leucine and valine are of equivalent fitness at a given site. In such a context, nonsynonymous substitutions between TTG and GTG accumulate more readily than synonymous substitutions. If this feature were to be present to a high extent, it could mislead the MutSel-M3* model into inferring , thus suggesting adaptive evolution where the regime is in fact one of strict purifying selection on codon usage. Simulations should eventually be used to study effects relevant to high effective population sets of taxa—such as codon usage—on the inferences of MutSel-M3*.
Our analysis of the mammalian-level alignment of the gene Vwf also suggests several sites with adaptive signatures under the MutSel-M3* model, and none under the MG-M3 model (fig. 5C, table 1). A previous study, utilizing branch-heterogeneous models, has suggested adaptive evolution conferring venom resistance to opposoms that prey on pitvipers (Jansa and Voss, 2011). Moreover, variants of this gene have been found to have dramatic effects on its own expression levels in mice (Lemmerhirt et al. 2006), and hence with high potential for strong fitness effects.
While these latter studies are precedents to finding sites with signatures of adaptive evolution under the MutSel-M3* model, many of the model violations mentioned above could apply here as well. At the mammalian scale of this Vwf data set, a mutation–selection-based test of selection on codon usage has been shown to be misled by the effect of CpG hypermutability (Laurin-Lemay et al. 2018). This context-dependent mutational feature could have the effect of inflating values beyond 1 at sites where there is in fact no adaptive evolution (Suzuki et al. 2009). Again, however, more simulation work is required to better understand how such issues play out with the MutSel-M3*.
Of the remaining mammalian gene alignments studied with the MutSel-M3* model, two suggest very few sites having evolved under adaptive regimes (Adora3 and S1pr1, in fig. 6A and C, respectively), and one (Rbp3, fig. 6B) with none. The traditional MG-M3 model suggests no sites under adaptive evolution for these data sets. These three genes may be typical of results under the MutSel-M3* model at the mammalian scale (i.e., few, if any sites with high ), but broader empirical studies evaluating the relative proportion of genes with several sites having high probabilities of are pressing.
Future Directions
The traditional codon models based on ω have become increasingly well understood thanks to decades of empirical applications and simulation studies. A similar project should be considered within the mutation–selection framework. We have already suggested several lines of research meriting further attention, and we expand on these themes below.
Simulation Studies
A flurry of recent research has shown how a variety of approaches are highly susceptible to model violations, with many instances of purported signals of molecular adaptation being the result of unaccounted features of the evolutionary process (e.g., Ratnakumar et al. 2010; Rousselle et al. 2018; Venkat et al. 2018; Laurin-Lemay et al. 2018; Wisotsky et al. forthcoming). From the codon substitution modeling perspective, this raises important questions regarding the mutation–selection-based approach we propose here: whereas the biological expectation under traditional models is for ω values closer to 0 than to 1, such that is a drastic threshold, representing a very pronounced increase in nonsynonymous rates, the biological expectation under the new approach is for values closer to 1, and thus naturally approaching threshold of . This could make the mutation–selection-based methods highly susceptible to model violations that mildly increase nonsynonymous rates for reasons other than adaptive evolution. We plan to use richer simulations to study how the new approach reacts to such model violations, and if expanding the model to recognize features such as variable effective population size, CpG hypermutability, codon usage and gene conversion biases, could introduce greater robustness to inferences of adaptive evolution.
Empirical Studies
A more detailed examination, ideally combined with experimental corroborations, of the sites uncovered by the model is pressing, and hopefully based on far more than the hand-full of data sets of the present study. This would help build our empirical understanding how the model behaves in a variety of different contexts (Moutinho et al. 2019; Slodkowicz and Goldman 2020). We hope to apply the model on a few thousand genes from the OrthoMamm database (Scornavacca et al. 2019) in a first step, before engaging broader applications across varied taxanomic contexts.
Model Variations
While we have outlined the modeling strategy with a three-component finite mixture of values, in combination with a Dirichlet process prior on amino acid profiles, many other possibilities could be considered: various parametric families on (as did Yang et al. 2000, with ω), nonparametric approaches on (as proposed for ω by Huelsenbeck et al. 2006), grids of predetermined values (in the spirit of Murrell et al. 2013), along with similar choices on modeling amino acid fitness heterogeneity (e.g., Rodrigue et al. 2010; Rodrigue 2013; Rodrigue and Lartillot 2014). The potentially complex interactions between the numerous combinations also entail a large study.
Applications
We propose these modeling ideas in two independent software packages (see below). One of our Markov chain Monte Carlo implementations can run under fixed topology as well as sample over trees, and thus enable studies of the impact of phylogenetic uncertainty in inferences of adaptive evolution, utilizing both traditional and mutation–selection codon substitution models; this also suggests more extensive studies on the potential of such models for phylogenetic inference per se. Another implementation we offer lends itself to integrative modeling objectives, with a wide suite of potential research avenues utilizing the mutation–selection-based approaches. Foreseeable directions in the short-term with the latter implementation include capturing the evolution of effective population size over the phylogeny, along with joint inferences of continuous-trait evolution, as formalized by Lartillot and Poujol (2011).
Materials and Methods
Simulated Data
We used the simulation system described in Rodrigue and Lartillot (2017) to generate artificial data sets using a mutation–selection framework with global mutation parameters and site-specific amino acid fitness profiles. The mutation-level parameters (which assume no selection on synonymous variants) are as given in Rodrigue and Lartillot (2017), as is the phylogenetic tree (with 38 tips). With nearly neutral simulations (i.e., with the pure mutation–selection formulation, such as detailed below), the amino acid fitness profile used to simulate a codon site is chosen at random from a set of empirically derived profiles. We obtained such profiles by running the pure Dirichlet process-based mutation–selection model (Rodrigue et al. 2010) on a multigene data set at the scale of placental mammals (Lartillot and Delsuc 2012), and calculating the posterior mean amino acid profile at each site. The simulation draws at random (with replacement) one such site-specific posterior mean profile to run the evolutionary process along the tree at one codon site, repeating to produce alignments of 300 codons. For simulations with adaptive evolutionary regimes, the starting profiles are altered along the branches of the phylogeny as detailed in Rodrigue and Lartillot (2017), with the Red Queen parameter set to 0.01. In contrast to the simulations in Rodrigue and Lartillot (2017), however, the adaptive simulations herein are applied to only 10% of sites of the alignment; these 30 sites were chosen at random, that is, they were spread out randomly across the alignment. The remaining 270 codon sites are simulated with the Red Queen parameter set to 0, thus constituting pure mutation–selection regimes.
Real Data
We used previously studied alignments of protein-coding genes provided by the authors of earlier works:
β-Globin: 17 vertebrate sequences of β-globin gene, 144 codons in length, taken from Yang et al. (2000);
Adh: 23 Drosophila sequences of the alcohol dehydrogenase gene, 254 codons in length, taken from Yang et al. (2000);
Vwf: 62 sequences, at the scale of placental mammals, of the von Willbrand factor gene, 392 codons in length, taken from Lartillot and Delsuc (2012), as were the next three alignments;
Adora3: 67 sequences of the adenosine receptor A3 gene, 107 codons in length;
Rbp3: 54 sequences of the retinol-binding protein 3, 412 codons in length;
S1pr1: 67 sequences of the sphingosine-1-phosphate receptor 1 gene, 325 codons in length.
Substitution Models
The MG-M0 codon substitution model, inspired from Muse and Gaut (1994), but with a single ω parameter distinguishing nonsynonymous events, has entries given as:
Here, μij is the mutational parameterization, which we set as a general-time reversible nucleotide-level model (Lanave et al. 1984), with six exchangeability parameters (five degrees of freedom) and four frequency parameters (three degrees of freedom). The MG-M3 model has the same form, but rather than a single ω parameter, it invokes three different values (with their respective weights), and has a likelihood function consisting of the a weighted average of likelihood scores under each of the three ω values (Yang et al. 2000).
The MutSel-M0* model, presented in Rodrigue and Lartillot (2017), is given as:
Priors
Branch lengths are endowed with an exponential prior of mean controlled by a hyperprior, itself endowed with an exponential prior of mean 1. Nucleotide exchangeabilities and frequencies are each endowed with flat Dirichlet priors, whereas ω and have priors following a gamma law, controlled by two hyperparameters, each endowed with exponential priors of mean 1. Weights of finite mixture on ω or follow with flat Dirichlet prior. Amino acid fitness profiles follow a Dirichlet process prior (Rodrigue et al. 2010), implemented under a stick-breaking representation (Lartillot et al. 2013; Rodrigue and Lartillot 2014).
Data Availability
For convenience, all data sets (simulated and real) studied herein are included in the Supplementary Material.
The models presented have been implemented in an experimental version (2) of PhyloBayes-MPI (https://github.com/bayesiancook/pbmpi2), allowing for a joint sampling across parameter space, auxiliary variables, and tree topology space. We have also implemented the models in a new software called BayesCode, which is focused on integrative comparative methods under fixed topology (https://github.com/bayesiancook/bayescode). Example scripts demonstrating the use of the software are provided in the Supplementary Material.
Acknowledgments
The work was funded by the Natural Sciences and Engineering Research Council of Canada (N.R.), and the French National Research Agency, Grant ANR-15-CE12-0010-01/DASIRE (T.L., N.L.).