 Loss of SIRT1 in diabetes accelerates DNA damage-induced vascular calcification
Cardiovascular Research


- Altmetric
Aims
Vascular calcification is a recognized predictor of cardiovascular risk in the diabetic patient, with DNA damage and accelerated senescence linked to oxidative stress-associated pathological calcification. Having previously shown that systemic SIRT1 is reduced in diabetes, the aim was to establish whether SIRT1 is protective against a DNA damage-induced senescent and calcified phenotype in diabetic vascular smooth muscle cells (vSMCs).
Methods and results
Immunohistochemistry revealed decreased SIRT1 and increased DNA damage marker expression in diabetic calcified arteries compared to non-diabetic and non-calcified controls, strengthened by findings that vSMCs isolated from diabetic patients show elevated DNA damage and senescence, assessed by the Comet assay and telomere length. Hyperglycaemic conditions were used and induced DNA damage and enhanced senescence in vSMCs in vitro. Using H2O2 as a model of oxidative stress-induced DNA damage, pharmacological activation of SIRT1 reduced H2O2 DNA damage-induced calcification, prevented not only DNA damage, as shown by reduced comet tail length, but also decreased yH2AX foci formation, and attenuated calcification. While Ataxia Telanglectasia Mutated (ATM) expression was reduced following DNA damage, in contrast, SIRT1 activation significantly increased ATM expression, phosphorylating both MRE11 and NBS1, thus allowing formation of the MRN complex and increasing activation of the DNA repair pathway.
Conclusion
DNA damage-induced calcification is accelerated within a diabetic environment and can be attenuated in vitro by SIRT1 activation. This occurs through enhancement of the MRN repair complex within vSMCs and has therapeutic potential within the diabetic patient.
1. Introduction
The prevalence of diabetes is a growing global epidemic, with almost 9% of the population affected.1 Diabetes is associated with elevated oxidative stress, arising from hyperglycaemia through the activation of the polyol pathway,2 due to poor patient glycaemic control3 and resulting in increased cardiovascular risk. One of the key comorbidities associated with diabetes is vascular calcification,4,5 a major cause of mortality within the western world, in which lipoprotein and calcium accumulate within the blood vessels, leading to the formation of fatty streak lesions and mineralized matrix deposition.6 At a molecular level, advanced vascular calcification is associated with cellular senescence,7,8 telomere erosion and persistent DNA damage9,10 in response to various cellular stresses including hyperglycaemia and reactive oxygen species production, further promoting the development of calcified matrix deposition within the vessel. However, the mechanism by which glycaemic conditions effect DNA damage and the cellular pathways underpinning this is still unclear.
The DNA damage response (DDR) is a collection of canonical pathways, which, following a stress factor, stimulate a variety of sensor proteins including MRE11 RAD50, NBS1 (MRN complex),11 and the histone variant H2AX.12 The MRN complex has been implicated in several aspects of DNA double-strand breaks, from initial detection, to triggering DDR signalling pathways and facilitating repair.13 Considered to be a flexible scaffold, the MRN complex binds to the break, bridging the broken DNA, before activating the checkpoint signalling pathway.14 These sensors are then phosphorylated via recruited transducer proteins such as Ataxia Telanglectasia Mutated (ATM) to the site of damage,15 leading to the activation of effector molecules such as checkpoint kinases and ultimately p53, which contribute to an arrest in the cell cycle, followed by DNA repair or apoptosis. Furthermore, H2AX is phosphorylated by these recruited kinases at the site of DNA damage, leading to increased recruitment of DDR machinery.6
Sirtuin 1 (SIRT1) is a NAD+ dependent deacetylase, with roles in longevity, ageing, glucose metabolism, and calcification.16,17 This lab and others have previously reported that a reduction of SIRT1 leads to increased smooth muscle calcification,18,19 and these data suggest it could be via the osteogenic transcription factor pathway, Runx2. However, the mechanisms linking the loss of SIRT1 with increased DNA damage and prevalence of calcification have yet to be elucidated.20,21 SIRT1 deacetylase targets a variety of transcription factors, including the tumour suppressor protein p53,22 tightly regulating its activation with protection against the DDR pathway by promoting cell survival and suppressing apoptosis.23 Additionally, a functional link has been shown between SIRT1 and a member of the double-strand DNA break repair complex, NBS1, in increasing the resistance to DNA damage,24 but whether loss of SIRT1 and subsequent NBS1 activation contributes to diabetes-associated DNA damage has yet to be confirmed. SIRT1 activators, specifically SRT1720, has been shown to operate as a possible therapeutic for type II diabetes models,25 and has been found to increase phosphorylated ATM in DNA damage models, reducing the lag time in the initiation of DNA repair.26
Within the blood, hyperglycaemia, considered a defining trait of diabetes, decreases the reduction of NADPH to NAD+, limiting the amount of NAD+ substrate available to SIRT1, reducing its activation and subsequent phosphorylation of the MRN complex.27,28 In turn, this leads to an increase in hyperglycaemic-induced DNA breaks, and a lack of their repair, due to the decrease in active MRN complex, thus making SIRT1 activation an attractive target for DNA damage repair. Based on previous data showing attenuation of vascular calcification following the activation of the SIRT1 pathway in vitro,19 the aim of this study was to establish of the links between SIRT1, DNA damage and subsequent vascular cell calcification.
With previous work demonstrating the significant loss of SIRT1 within the diabetic patient,19,29 two key questions remain; could activation of the DDR be linked to lower SIRT1 expression previously been reported in patients with diabetes and secondly, could modulation of the DDR underpin DNA damage-induced calcification that occurs in diabetes?
2. Methods
2.1 Histological staining
Popliteal arteries harvested from patients with (diabetes mellitus, DM) and without (non-DM) diabetes undergoing lower limb amputation were used for histochemical analysis. A panel of internal mammary artery (IMA) sections were used as non-calcified, non-atherosclerotic controls. Tissue was collected with informed consent under Ethics Reference 14/NW/1062 and the study was performed in accordance to the Declaration of Helsinki. Patient details including age, sex, and degree of atherosclerosis are included in Supplementary material online, Table S1. Arterial sections were immunolabelled with antibodies as previously described30, Supplementary material online, Table S2. A TUNEL assay (Promega) was used as per manufacturer’s instructions. Sudan black B lipofuscin staining was used as previously described.31 All sections were counterstained with nuclear fast red and imaged using a Zeiss AxioVert microscope. Quantification of p21, γ-H2AX, ATM, MRE11, RAD50, and NBS1 was achieved using colour devolution on ImageJ32; five fields of view (FoV) were quantified per patient sample for each stain. Arterial plaques were graded according to the Oxford grading system.33
2.2 Cell culture
Human vascular smooth muscle cells (vSMCs) were also harvested from the patient popliteal arterial samples. Non-diabetic primary human coronary artery vSMCs were purchased from Caltag, UK. All vSMCs were cultured in smooth muscle cell (SMC) Basal Media 2 (PromoCell), until 80% confluent, then transferred to either; DMEM containing 5 mM glucose (control conditions; Ctrl), DMEM 5 mM glucose, supplemented with 5 mM β-glycerophosphate (βGP) and 2.6 mM CaCl2 (osteogenic conditions; Ost) or DMEM containing 25 mM glucose supplemented with 5 mM βGP and 2.6 mM CaCl2 [high glucose (HG) conditions, to reflect hyperglycaemic diabetic milieu]. SIRT1 was modulated via activator SRT1720 (0.5 µM) and SIRT1 inhibitor Sirtinol (10 µM) as previously optimized and described.19 Cells were used between passage 3 and 6.
2.3 Comet assay
A total of 5 × 10⁵ vSMCs were seeded in 12 well plates in assay dependent conditions for four days. Cells were then treated with 200 µM H2O2 for 30 min, washed in PBS and left to recover in fresh media for 0–3 h, and the comet assay was conducted as previously described.29 Five fields of view per slide were taken using a fluorescent microscope (Zeiss AxioImager Z1) and quantified with CASPLab.
2.4 Reverse transcription and quantitative polymerase chain reaction
Total RNA was extracted from vSMCs using TriZol (Invitrogen, USA) and quantified using the Nanodrop2000, (Thermo, USA). qPCR was performed using SYBR Green Lo-ROX (BioLine) using the StepOnePlus (Thermo, UK). Primers used are detailed in Supplementary material online, Table S3.
2.5 Relative telomere length quantification
Total RNA was extracted from DM vSMCs and controls as described above was examined for telomere length. In brief, qPCR was conducted using Tel O primers to amplify the CG rich telomere sequence and normalized against single copy genes (Col6a and Col3a). Initial denaturation was carried out at 95°C for 10 min, followed by 40 cycles of 95°C for 60 s, annealing at 58°C for 30 s, and extension at 72°C for 30 s. qPCR was performed using SYBR Green Lo-ROX (Bioline) using the StepOnePlus (Thermo, UK).
2.6 Western blot analysis
Western blot analysis was performed as previously described34 on whole cell lysates or cell fractions which were isolated using a Nuclear Extraction Kit (Abcam) and quantified via a BCA assay (Thermo, UK). A 20 µg protein extracts were separated on NuPAGE Bis-Tris Gels (Invitrogen, UK), transferred to a PVDF membrane, blocked, and probed with antibodies, Supplementary material online, Table S2. Densitometry was performed using ImageLab software (BioRad) with all samples normalized to α-tubulin.
2.7 Immunofluorescence
vSMCs were seeded in eight well-chamber slides, treated for 4 days before fixing with paraformaldehyde (4%) for 15 min at room temperature. Cells were blocked and permeabilized with Tween-20 (1%) in 5% goat serum in PBS and stained with antibodies, Supplementary material online, Table S2. Slides were mounted with DAPI anti-fade gold (Life Technologies, UK) and imaged using a fluorescent microscope (Zeiss AxioImager Z1). Images were quantified using ImageJ software.
2.8 Alizarin red staining
vSMC calcification was determined using Alizarin red S staining. Cells were cultured for 7 days in calcifying media, with or without the constant presence of 200 µM H2O2 and or 0.5 µM SRT1720, before being washed with PBS prior to fixing with paraformaldehyde (4%) for 15 minutes. Cells were then washed with PBS before incubating with 2% Alizarin red in PBS for 10 minutes. Before washing again with PBS and imaging under a light microscope. Positive staining observed in red.
2.9 Alkaline phosphatase activity
Alkaline phosphatase (ALP) activity was assessed using the p-nitrophenol phosphate (pNPP) assay. In brief, cells were cultured for 4 and 7 days in calcifying media with or without SRT1720 activator. Cells undergoing DNA damage were then treated with 200 µM H2O2 for 30 minutes prior to harvesting and all cells were lysed with 0.05% Triton-X and quantified using a BCA kit as described above. Enzymatic activity was determined using 10 M pNPP, read at 410 nm spectrophotometrically, then normalized to total protein concentration and expressed as nmol of nitrophenol formed per µg of cellular protein per minute.
2.10 Chromatin immunoprecipitation
Chromatin immunoprecipitation (ChIP) assays were performed using a SimpleChIP enzymatic chromatin IP kit (Cell Signalling Technologies, USA) as previously described.35 In brief, sheared chromatin was isolated from day 4-treated vSMCs using an anti-acetyl-lysine antibody (AbCam). PCR was then performed with primers designed for ATM, RAD50, MRE11 and NBN promotor regions, Supplementary material online, Table S3. Fold enrichment was determined via the anti-acetyl-lysine immunoprecipitation compared to the 2% input sample, using the comparative Ct method. Amplification compared to negative control was calculated to confirm specific binding, Supplementary material online, Figure S1.
2.11 Statistical analysis
All experiments were performed a minimum of four times using independent populations of cells and data are presented as the mean ± SEM. Shapiro–Wilk normality test was used to assess normality. Analysis of variance was performed with the relevant post hoc tests for normally distributed data, and Mann–Whitney U test, where data were not normally distributed, both using Prism 5 software (GraphPad Software, USA).
3. Results
3.1 Diabetic patients exhibit cellular DNA damage and decreased tissue expression of SIRT1
Vessels taken from DM and non-DM patients undergoing lower limb amputation were examined histologically for calcification, senescence and DNA damage markers. Von Kossa staining positively identified calcification in both DM and non-DM arterial samples, with an absence of SIRT1 staining within the vessel wall on the DM sections, while positive SIRT1 staining was evident in the non-DM patient vessel (Figure 1). Senescence markers, Sudan Black and p21 staining confirmed the presence of senescence located within the smooth muscle layer of the DM vessel, with less staining in non-DM vessels. Furthermore, the TUNEL assay and γ-H2AX staining demonstrated the presence of double-stranded breaks (DSBs) in DM vessels, which was less apparent in non-DM vessels (Figure 1A). The number of p21-positive foci and γ-H2AX staining was quantified using ImageJ in both DM, non-DM (Figure 1) and IMA (Supplementary material online, Figure S2) arterial sections. A significantly higher number of p21 foci were detected in DM vessels compared to both non-DM (P = 0.015) and IMA vessels (P = 0.0020). Furthermore, significantly less p21 foci were observed in IMA compared to non-DM vessels (P = 0.030) (Figure 1B). γ-H2AX was also quantified within the tissue. DM vessels exhibited significantly greater levels of γ-H2AX compared to both DM (P < 0.0010) and non-DM vessels (P < 0.0010) (Figure 1C).

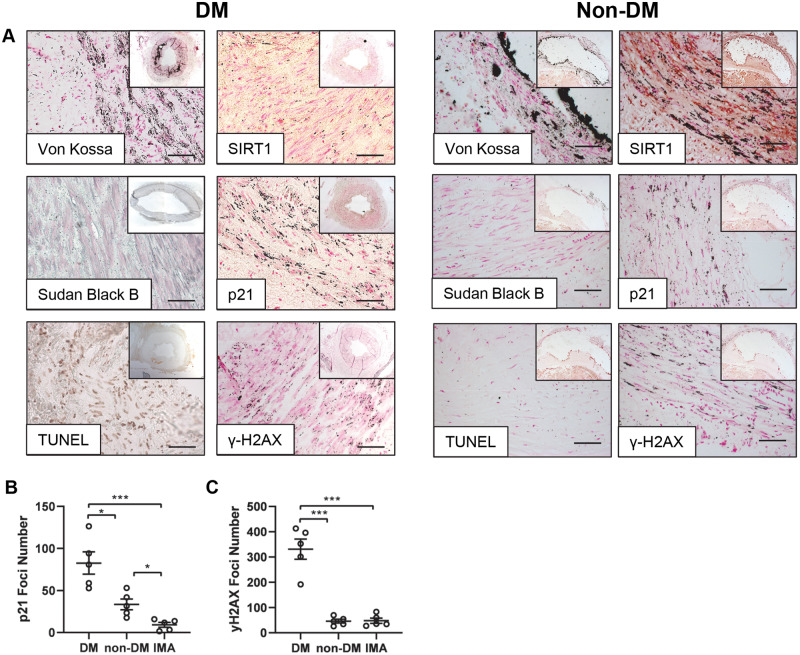
Vessels isolated from patients with diabetes exhibit DNA damage and low SIRT1 expression. Representative micrographs of popliteal arteries harvested from diabetic patients (DM) and non-diabetic patients (non-DM) undergoing lower limb amputation. (A) DM and non-DM patient vessels were stained; for von Kossa, indicated by silver phosphate ion accumulation (n = 5), SIRT1 (n = 5), senescence markers lipofuscin (Sudan B) (DM n = 4, non-DM n = 5), p21 (n = 5). TUNEL assay, demonstrating double stranded DNA nicks (n = 5) and γ-H2AX (n = 5). Scale bar = 200μm. (B) Quantified p21 foci number in DM, non-DM and control internal mammary artery (IMA) vessels (n = 5 patients per group; 5 FoV per patient) and (C) γ-H2AX foci (n = 5, 5 FoV). A one-way ANOVA followed by a Tukey post hoc test was performed. *P < 0.05, **P < 0.01, ***P < 0.001.
Given the apparent localization of these DNA damage markers within the medial layer of the vessel wall, it was next of interest to establish whether DNA damage was increased in vSMCs isolated from patients with diabetes compared to non-DM cells and if this inversely correlated with SIRT1 expression. Therefore, known markers of DNA damage were analysed in an in vitro cell culture model. vSMCs harvested from DM calcified popliteal vessels demonstrated an increased level of persistent DNA damage compared to healthy vSMC controls, indicated by a significantly greater comet tail percentage (P < 0.0010) and tail moment (P < 0.0010) (Figure 2A) compared to non-calcified controls. Telomere length was also significantly decreased four-fold in DM vSMCs compared to healthy controls (P = 0.0095) (Figure 2B). Conversely, markers of senescence, p21 and p53 mRNA abundance was increased in DM patients, compared to healthy controls (P = 0.0022), (P = 0.048), respectively (Figure2C andD). ATM, a protein known to phosphorylate γ-H2AX following DNA breaks, was up-regulated three-fold in DM vSMCs compared to healthy controls at the mRNA level (P = 0.048) (Figure 2E). SIRT1 expression was significantly decreased in diabetic vSMCs at both the mRNA (P = 0.0020) (Figure 2F) and protein level (P = 0.0022) (Figure 2G), corroborating the immunohistochemical data (Figure 1A) and supporting previous systemic findings in diabetic patients.19
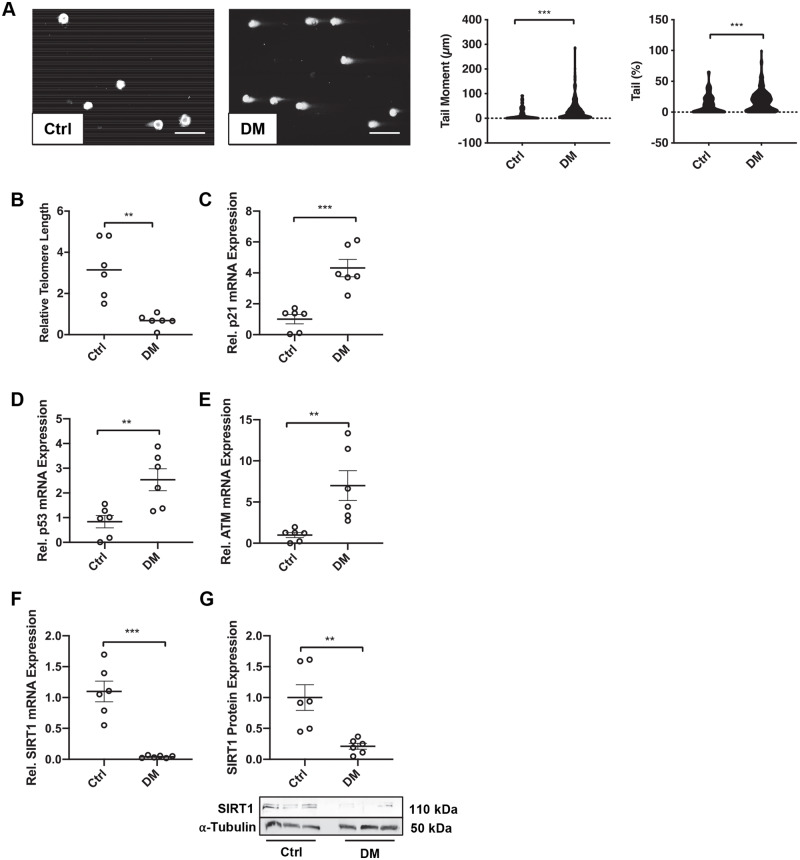
Diabetic patient vSMCs exhibit DNA damage and low SIRT1 expression. (A) Double stranded DNA breaks were assessed via the comet assay in control (n = 6) and diabetic (DM) (n = 6) vSMCs. Tail moment and tail DNA percentage were calculated via CASPLab. Scale bar = 20μm. (B) Telomere length of control (n = 6) and DM (n = 6) vSMCs was quantified via qPCR and normalised to Col3a1 and Col6a1. (C) p21 (n = 6) (D) p53, (n = 6) (E) ATM (n = 6) and (F) SIRT1 (n = 6) mRNA expression from DM vSMCs was compared to controls via qPCR. (G) SIRT1 protein expression within DM and control vSMCs was assessed by western blot analysis and normalized to α-tubulin (n = 6). A Mann–Whitney U test was performed. *P < 0.05, **P < 0.01, ***P < 0.001.
3.2 Hyperglycaemic conditions induce DNA damage
Phosphorylation of histone H2AX at Ser139 is considered to be an early marker of DNA damage and correlates with the development of DSBs.36 To determine how a diabetic environment modulates DNA damage in vSMCs, and if this could be linked to calcification, a well-established in vitro calcification model30 was utilized, modified to incorporate diabetic conditions. Cells were cultured in either a healthy physiologically relevant concentration of 5 mM glucose37 (Control; Ctrl), or 5 mM glucose with the addition of CaCl2 and βGP (Osteogenic; Ost), or finally, 25 mM glucose and osteogenic conditions (High glucose; HG), comparable to a DM patient during a moderate hyperglycaemic attack.38 Control cells exhibited a baseline of 12 γ-H2AX foci per cell, with many cells exhibiting no foci at all (Figure 3A). However, when cultured in HG, cells exhibited significantly more foci when compared to both control (P = 0.0072) and osteogenic (P = 0.0079) conditions.
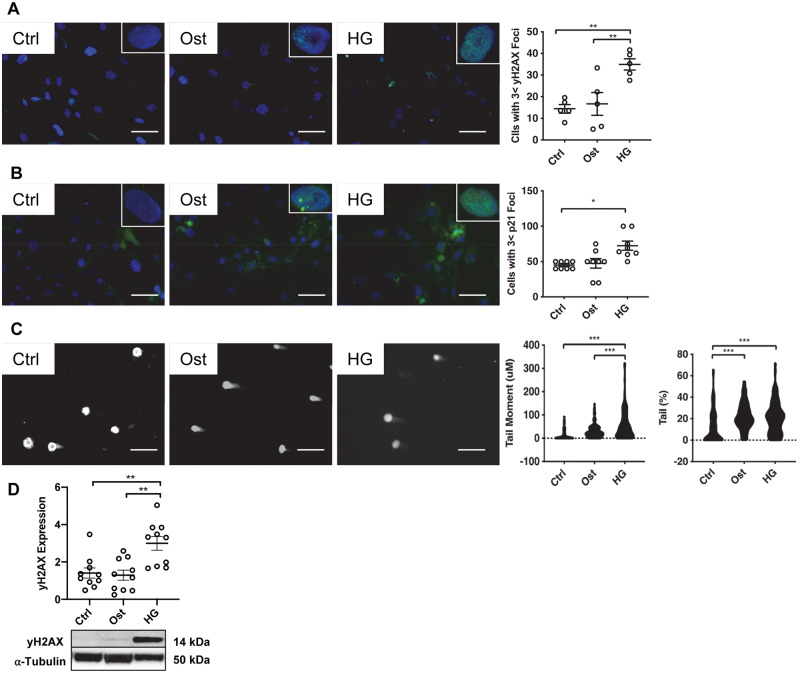
Hyperglycaemic conditions increase DNA damage in vitro. The effect of osteogenic (Ost) and hyperglycaemic (HG) conditions in a vSMC model was assessed. (A) γ-H2AX foci (n = 5) and (B) p21 foci (n = 8) were examined via fluorescent staining (green) and quantified using ImageJ, with representative images shown. Scale bar = 20μm. (C) DSBs were confirmed via the comet assay and quantified via CASPLab (n = 6). (D) γ-H2AX expression was assessed in protein harvested from all three treatments via western blot analysis and normalized to α-tubulin (n = 10), with representative images shown. A one-way ANOVA followed by a Tukey post hoc test was performed. *P < 0.05, **P < 0.01, ***P < 0.001.
The tumour suppressor protein, p53, has previously been reported to mediate cell cycle arrest in HG conditions19 and its expression further activates downstream senescence marker p21, therefore p21 foci were next examined. There was no apparent difference in the number of p21 foci detected between osteogenic conditions compared to control conditions (Figure 3B), however, it is of note that in the presence of the HG conditions p21 foci were significantly increased compared to control (P = 0.033). A comet assay was used to determine naturally occurring DSBs in the in vitro model. Tail moment was significantly increased in HG conditions compared to both osteogenic (P < 0.0001) and control conditions (P < 0.0001) and furthermore, a two-fold increase was observed in tail percentage between both control and osteogenic and HG conditions (Figure 3C). Finally, total γ-H2AX protein expression harvested at Day 4 was assessed via western blotting, with a significant increase detected in HG conditions compared to both osteogenic (P = 0.0003) and control conditions (P < 0.0001) (Figure 3D).
3.3 SIRT1 attenuates DNA damage-induced vSMC osteogenic differentiation
Given the loss of SIRT1 within a diabetic environment, and having shown that HG conditions induce DNA damage (Figure 3), it was next of interest to determine whether restoration of SIRT1 could rescue the DNA damage and its calcification effects. vSMCs were cultured in the three growth conditions in the presence or absence of H2O2 and SIRT1 activator, SRT1720. Cells exposed to elevated oxidative stress by treatment with H2O2 for 7 days exhibited no significant change in the control conditions; however, there was a significant increase in calcification in osteogenic (P = 0.043) and HG (P = 0.047) conditions compared to the same conditions without H2O2 treatment (Figure 4A). Furthermore, the addition of SRT1720 to H2O2 treated cells reduced alizarin red staining by half in both osteogenic (P = 0.042) and HG (P = 0.047) conditions (Figure 4A).
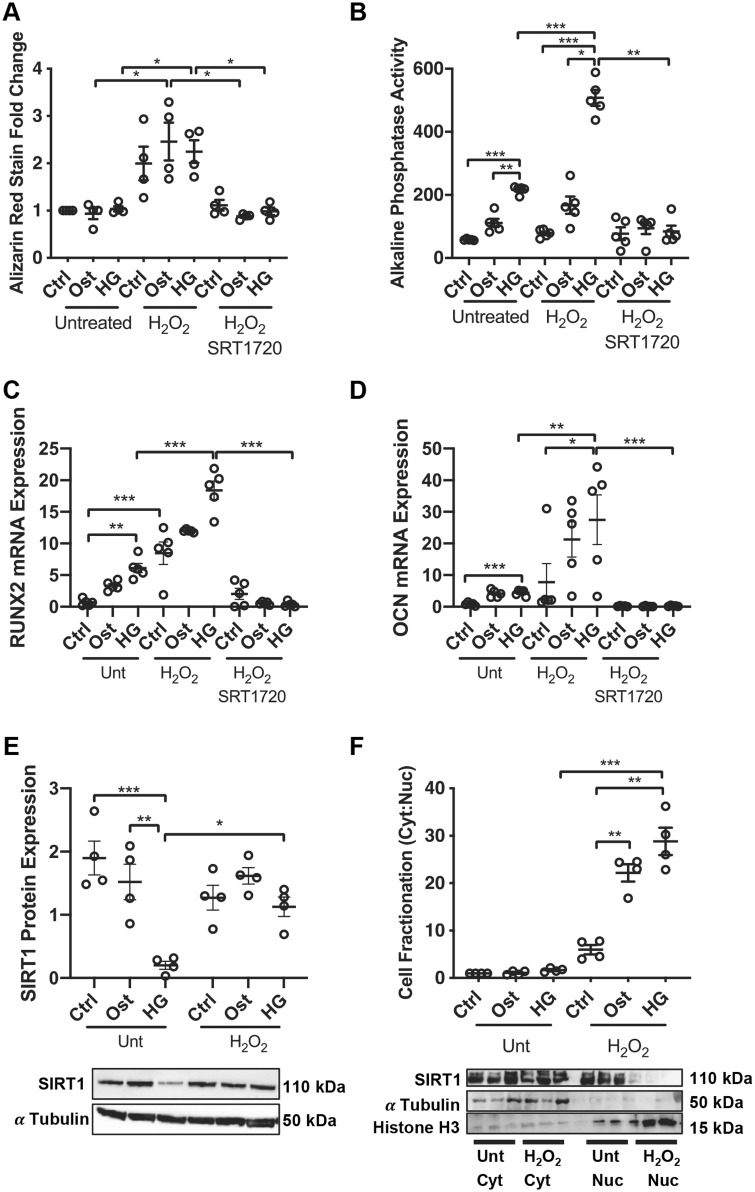
SIRT1 activation inhibits DNA damage-induced osteogenic differentiation. Thirty minutes of 200 µM H2O2 treatment induces osteogenic vSMC differentiation through the Runx2 pathway. (A) Alizarin red staining was assessed at Day 7 following constant treatment with H2O2 for 7 days and quantified colorimetrically (n = 4). (B) ALP activity was assessed at Day 4 via the p-nitrophenol phosphate assay (n = 5). (C) Runx2 (n = 5) and (D) OCN (n = 5) mRNA expression was assessed via qPCR. (E) SIRT1 protein levels were determined in total protein isolated from untreated and H2O2-treated cells via western blot analysis and normalised to α-tubulin (n = 4). (F) Protein was fractionated and nuclear and cytoplasmic SIRT1 levels assessed via western blot analysis and normalized to histone H3 and α-tubulin, respectively (n = 4). A one-way ANOVA followed by a Tukey post hoc test was performed. *P < 0.05, **P < 0.01, ***P < 0.001.
ALP activity; an early marker of osteogenic differentiation, was increased on Day 4 in osteogenic (P = 0.0029) conditions as expected and this effect was enhanced in HG conditions compared to control (P = 0.0002). Furthermore, in the presence of H2O2 treatment, ALP activity was increased in HG compared to both control (P = 0.0004) and osteogenic (P = 0.011) conditions. However, when treated with SRT1720 to restore SIRT1 levels, the H2O2-induced ALP activity was prevented in HG conditions (P < 0.0001) (Figure 4B), supporting the Alizarin red data shown in Figure 4A.
To confirm the development of osteogenic differentiation, Runx2 and OCN mRNA abundance was examined following 4 days of treatment. Both Runx2 (Figure 4C) and OCN (Figure 4D) were elevated in untreated HG conditions compared to control (P = 0.019) and (P < 0.0001) respectively, with a further significant increase under HG conditions when cells were treated with H2O2 (P = 0.0059) and (P = 0.029), respectively. SIRT1 activation reduced both Runx2 (P < 0.0001) and OCN (P = 0.0009) mRNA levels in HG conditions. Given the observed increase in osteogenic markers following H2O2, the effect of H2O2 on SIRT1 expression was assessed. Following 4 days of H2O2 treatment in HG conditions, SIRT1 was significantly reduced compared to control (P = 0.0010), however following H2O2 treatment, SIRT1 expression was increased in all three conditions, with a significant up-regulation detected between the two HG conditions (P = 0.0079) (Figure 4E). To further identify the regulation and cellular translocation of SIRT1 following H2O2 treatment, its subcellular localization was determined using fractionation studies. In untreated conditions, there was an even distribution of SIRT1 between the cytoplasm and the nucleus. However, when treated with H2O2 under HG conditions, SIRT1 was retained almost entirely to the cytoplasm, instead of being translocated to the nucleus (P = 0.0005) as occurred in untreated conditions (Figure 4F).
3.4 SIRT1 activation protects against DNA damage
Having demonstrated the loss of SIRT1 correlates with an increase in DNA damage, the effect of SIRT1 modulation was examined in vSMCs following recovery from DSBs induced by H2O2. vSMCs were treated for 4 days with SIRT1 activator, SRT1720, or a SIRT1 inhibitor, Sirtinol, before either staining and counting γ-H2AX foci within the nucleus or undergoing single-cell electrophoresis. Cells were either left untreated or treated with 200 µM H2O2 for 30 min, then left to recover in fresh media before staining at 1 h and 3 h time points. γ-H2AX staining was significantly increased at 3 h following damage within control conditions with the addition of Sirtinol (P = 0.028), and significantly decreased by the addition of SRT1720 (P = 0.015) (Figure 5A). Similarly, within the osteogenic conditions, cells treated with Sirtinol exhibited significantly more γ-H2AX foci compared to SRT1720 treatment (P = 0.0088). Within the HG treated cells, a significant increase was observed in γ-H2AX at 1 h following treatment between SIRT1 activated and inhibited cells (P = 0.015). Following 3 h recovery, SRT1720 reduced foci count by over half compared to Sirtinol treatment (P < 0.0001), with SRT1720-treated cells expressing 40% less foci than untreated conditions (P = 0.0039). Sirtinol increased foci accumulation by over 20% compared to untreated conditions (P = 0.0037) (Figure 5A).
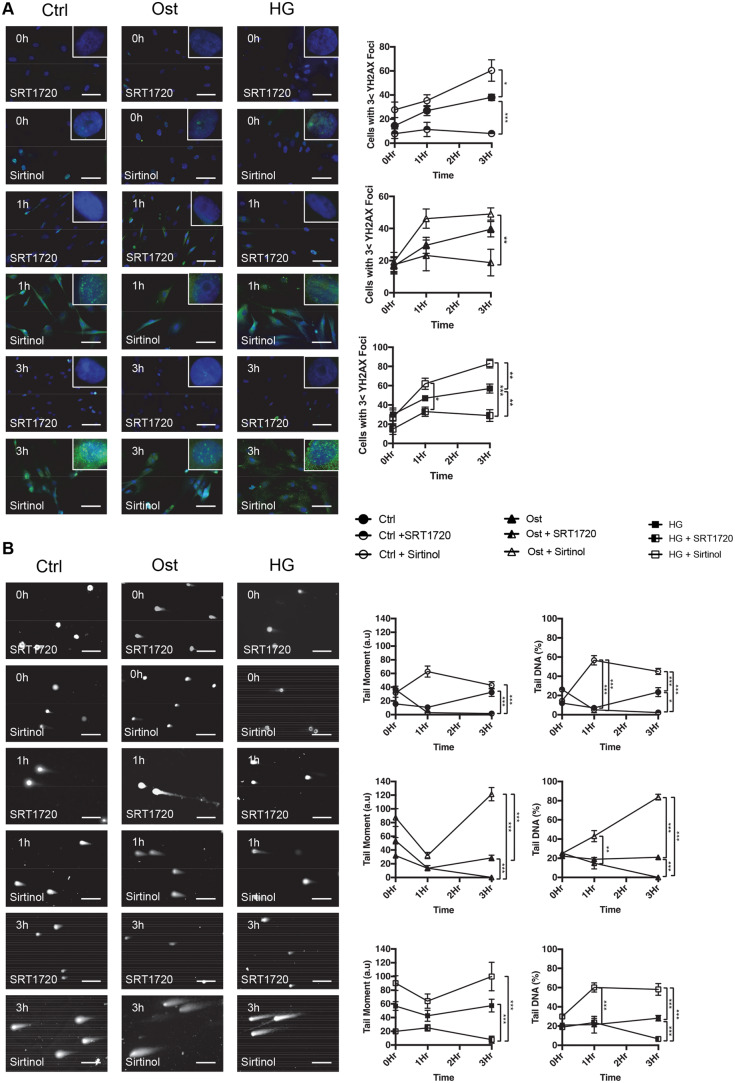
SIRT1 activation decreases DNA damage. γ-H2AX expression was confirmed via fluorescent staining. Cells were pre-treated with SRT1720 (SIRT1 activator) or Sirtinol (SIRT1 inhibitor) for 4 days prior to 30 min H2O2 treatment and left to recover for up to 3 h before (A) staining for γ-H2AX (green) and with DAPI (blue) (n = 4) or (B) undergoing the comet assay to confirm DSBs. (n = 6). A two-way ANOVA followed by a Tukey post hoc test was performed. *P < 0.05, **P < 0.01, ***P < 0.001.
DSBs were again assessed using the comet assay. Following pre-treatment for 4 days with SIRT1 activator, SRT1720, or SIRT1 inhibitor, Sirtinol, cells were either left untreated or treated with 200 µM of H2O2 for 30 min and left to recover in fresh media before DNA was isolated and assessed to determine DNA damage (Figure 5B). Tail moment, an index of induced DNA damage, taking into consideration both migration and relative amount of DNA in the tail, was also used to assess the DNA damage and subsequent repair. Within controls, tail moment did not vary significantly between 0 h and 3 h after damage, however, a significant increase was identified between Sirtinol (P < 0.0001) and untreated (P < 0.0001) cells, compared to SRT1720 treatment. Within osteogenic conditions, SIRT1 inhibition increased tail moment over five times compared to control (P < 0.0001) and SRT1720 treatment (P < 0.0001), with SIRT1 activation reducing tail moment compared to untreated controls (P < 0.0001). Under HG conditions, SIRT1 activation significantly reduced tail moment compared to untreated (P < 0.0001) and Sirtinol treated (P < 0.0001).
Tail percentage was increased 1 h after damage in Sirtinol-treated control conditions compared to both untreated control (P < 0.0001) and SRT1720 treated conditions (P < 0.0001). Furthermore, following a 3 h recovery a significant increase was observed in untreated compared to SRT1720 treated cells (P = 0.0014), with a greater increase detected in Sirtinol control conditions compared to both untreated (P < 0.0001) and SRT1720 (P < 0.0001). Within osteogenic conditions, Sirtinol treatment significantly increased tail percentage by 40% compared to SRT1720 conditions (P = 0.0046), with no difference observed between untreated and SRT1720. However, following a 3 h recovery, SRT1720 reduced tail percentage by over 10%, significantly less than both untreated (P < 0.0001) and Sirtinol-treated (P < 0.0001). Sirtinol inhibition of SIRT1 increased tail percentage by four-fold compared to untreated (P < 0.0001). Finally, a significant increase in tail DNA percentage was observed in Sirtinol HG conditions compared to control after 1 h (P < 0.0001), which was sustained during the 3 h recovery period (P < 0.0001). A significant reduction was observed following SRT1720 pre-treatment compared to both untreated (P < 0.0001) and Sirtinol-treated cells (P < 0.0001).
3.5 SIRT1 activation reduces chromatin acetylation and increases MRN activation
When DNA damage occurs within the nucleus, the cell responds by recruiting sensor proteins to the damage sites which orchestrate the formation of multiprotein complexes for DDR activation.39 Initially H2AX is bound to DSBs, where it binds and is phosphorylated via an active acetylated ATM. This phosphorylation binds NBS1 first, forming a trimeric complex with MRE11 and RAD50, tethering the MRN complex to the DNA damage site before translocating to the nucleus and forming distinct foci with γ-H2AX at DSBs.13
Calcified vessels from DM and non-DM patients were assessed for the presence of ATM and the MRN complex using immunohistochemistry. Positive staining confirmed the presence of ATM, RAD50 MRE11 and NBS1 within the vSMC layer of DM vessels, which was present to a lesser extent in non-DM vessels (Figure 6A) and absent in control, non-calcified, non-atherosclerotic IMA (Supplementary material online, Figure S2). Foci number for ATM, RAD50, MRE11 and NBS1 was quantified using ImageJ. ATM foci number was significantly greater in DM vessels compared to both non-DM (P = 0.012) and IMA (P < 0.0001), with non-DM vessels exhibiting significantly greater numbers of ATM foci than IMA (P = 0.039). Secondly, MRE11 foci number was significantly greater in DM compared to non-DM (P = 0.0002) and IMA tissue (P = 0.0008) and also in non-DM compared to IMA (P = 0.0023). The number of RAD50 foci was significantly greater in DM vessels compared to both non-DM (P = 0.0011) and IMA (P = 0.0004), with non-DM vessels exhibiting significantly greater numbers of RAD50 foci than IMA (P = 0.0033) (Figure 6B). NBS1 foci number was significantly increased in DM vessels compared to non-DM (P = 0.015) and IMA (P = 0.0002), with non-DM significantly increased compared to IMA (P = 0.043).
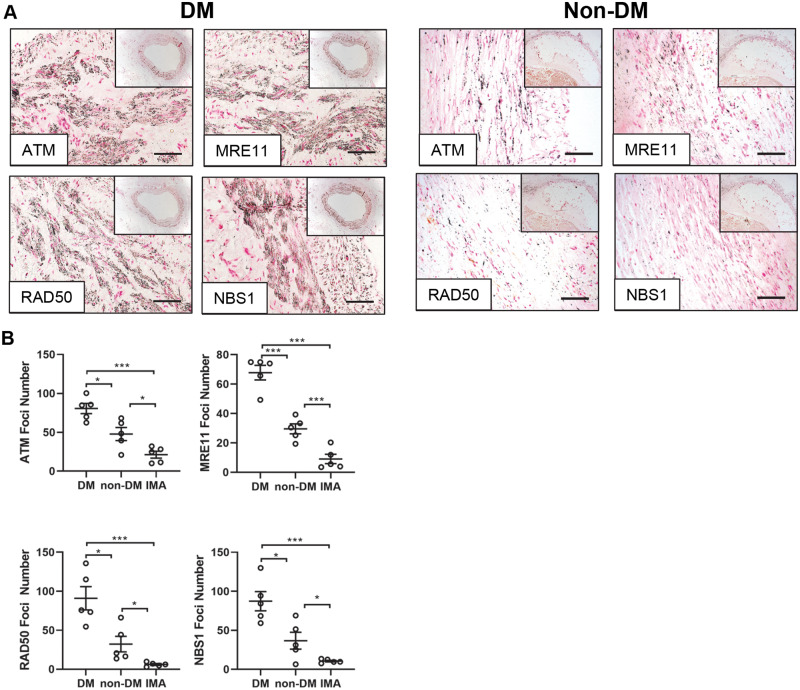
DNA damage markers ATM and the MRN complex are present in diabetic patient vessels. (A) Representative micrographs of popliteal arteries harvested from diabetic (DM) and non-diabetic (non-DM) patients undergoing lower limb amputation and stained for ATM, MRE11, RAD50 and NBS1 (n = 5). Scale bar = 200μm. (B) Positive black foci number was calculated via ImageJ for ATM, MRE11, RAD50, and NBS1 in diabetic (DM), non-diabetic (non-DM), and control internal mammary artery (IMA) vessels (n = 5 patients per group; 5 FoV per patient). A one-way ANOVA followed by a Tukey post hoc test was performed. *P < 0.05, **P < 0.01, ***P < 0.001.
Since DDR activation is primarily activated by the protein ATM phosphorylating downstream effector proteins,40 its activation profile was considered. Total ATM protein expression was increased in HG compared to control conditions (P = 0.043) (Figure 7A). H2O2-treated cells induced significantly less ATM than H2O2 with SRT1720 (P = 0.040), with SRT1720 activation increasing ATM expression significantly compared to untreated HG conditions (P = 0.0008). Activation of the MRN complex was next examined. Phosphorylation of MRE11 was significantly increased following SIRT1 activation compared to untreated (P = 0.0010) and H2O2 alone (P < 0.0001), with no significant change detected between untreated and H2O2 damage in all three conditions. Total RAD50 protein expression was significantly elevated following HG H2O2 treatment (P = 0.0010) compared to untreated HG conditions. Moreover, a further up-regulation was observed following SIRT1 activation (P < 0.0001). Finally, no change was found in NBS1 phosphorylation following H2O2 treatment, however, a significant increase was observed under HG conditions with SIRT1 activation, compared to untreated HG (P = 0.0015) and H2O2 alone (P = 0.0002).
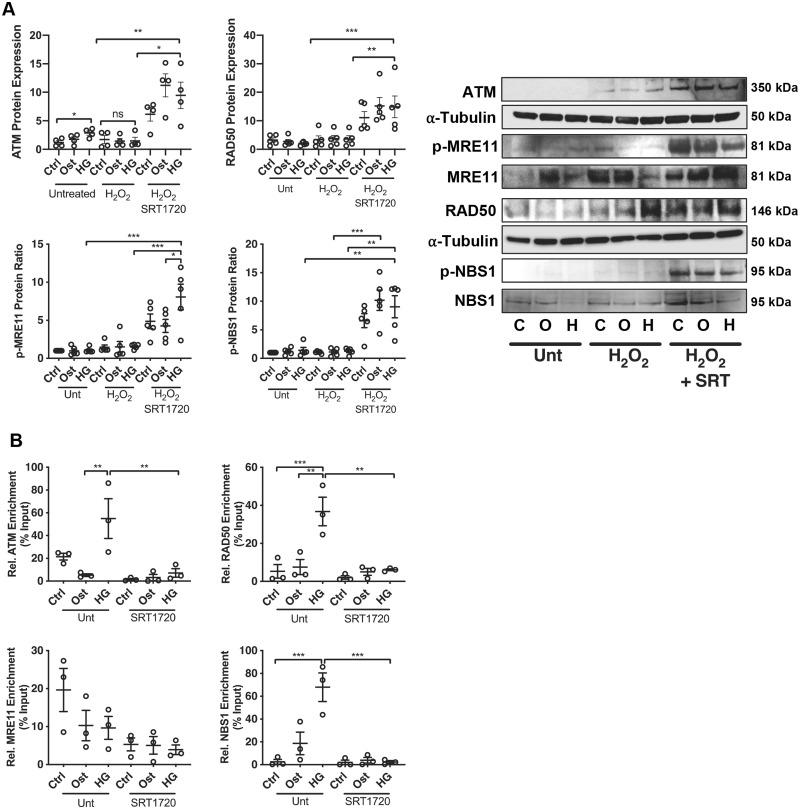
SIRT1 activation reduces activation of the MRN complex. (A) Expression of ATM (n = 4), p-MRE11 (n = 5), MRE11 (n = 5), RAD50 (n = 5), p-NBS1 (n = 5), and NBS1 (n = 5) was assessed within the vSMC calcification model in control (C), osteogenic (O) and high glucose (H) conditions in the absence (unt) or presence of DNA damage (H2O2) and SIRT1 activator (SRT), via western blot analysis and normalized to α-tubulin, with representative images shown. (B) Chromatin immunoprecipitation was performed with an anti-acetyl-lysine antibody to assess the acetylation profile of the promotor regions of ATM and MRN complex with the vSMC model (n = 3). A one-way ANOVA followed by a Tukey post hoc test was performed. *P < 0.05, **P < 0.01, ***P < 0.001.
Secondly, ChIP qPCR was performed to determine the acetylation profile of the promotor region within the ATM gene. Acetylation was significantly increased in the HG environment compared to osteogenic conditions (P = 0.0054), with SIRT1 activation significantly reducing the acetylation around the H3K27Ac marks (P = 0.0074) (Figure 7B). Acetylation of the MRE11 promotor region was reduced under osteogenic and HG conditions, correlating with an increase in total MRE11 production. RAD50 promotor acetylation was significantly increased following HG treatment compared to control (P = 0.0019) and osteogenic conditions (P = 0.0010), with SIRT1 activation significantly reducing acetylation (P = 0.0012). NBS1 promotor acetylation was significantly increased following HG treatment (P = 0.0002) and reduced following SIRT1 activation (P = 0.0002) (Figure 7B).
4. Discussion
Previously, SIRT1 has been identified as a longevity gene and was shown to be down-regulated within diabetic patients,19,41 while up-regulation of SIRT1 has been reported to slow a range of degenerative diseases via regulation of energy balance and protection against cellular senescence and apoptosis.29,42 Vascular calcification, a highly prevalent pathology and a serious comorbidity of diabetes, is associated with major cardiovascular events, in which vascular smooth muscle cells play an integral role in mediating the development of calcification via osteogenic differentiation and the release of vesicles that deposit calcium-phosphate hydroxyapatite crystals along the matrix. Whilst previous studies have focused on the development of DNA damage within atherosclerotic plaques, this is the first in vitro study to demonstrate that DNA damage-activated osteogenic differentiation in smooth muscle cells may be perpetuated via a loss of SIRT1. Furthermore, this study demonstrates that restoring SIRT1 levels, may further activate the MRN DNA repair complex and return cells to their normal quiescent state, thereby preventing subsequent damage due to senescence and apoptosis.
This study clearly establishes an increased presence of DNA damage markers in calcified popliteal vessels from patients with diabetes compared to those without. This strengthens previously published data demonstrating reduced SIRT1 within diabetic serum compared to healthy controls.19 The findings within this study demonstrate a link between the loss of SIRT1 and increased DNA damage in patients with diabetes. Additionally, senescence markers, Sudan Black, p21 and the TUNEL assay suggest that the development of calcification correlates with increased DNA damage in areas which lack SIRT1. The expression of SIRT1 was reduced in diabetic vSMCs compared to healthy controls, with a significant up-regulation of p53, p21 and a decrease in telomere length, suggesting that an integral part of the diabetic vSMC phenotype is the development of a senescent state and an increase in DNA damage, in agreement with previous findings.43,44 Interestingly, ATM expression was up-regulated in diabetic vSMCs, implicating that whilst DNA damage is increased in diabetic cells, the response mechanism may be inhibited further downstream within this pathway, thus, unable to prevent senescence.
To further investigate the mechanistic pathways involved, a human coronary artery cell model was used, where vSMCs were cultured under osteogenic conditions in the presence or absence of high glucose, with or without H2O2 to induce DNA damage and also in the presence of either a SIRT1 activator (SRT1720) or a SIRT1 inhibitor (Sirtinol). HG conditions were found to increase the rate of DNA damage, γ-H2AX and p21 foci numbers and both tail percentage and tail length of comets compared to controls. Whilst vSMCs within normal vessels are characterized as having low levels of osteogenic marker expression, this study demonstrated that an increase in osteogenic markers Runx2 and OCN occurred following DNA damage, with HG conditions exacerbating their expression. Additionally, ALP activity and Alizarin red staining was also increased within H2O2 damaged cells. Although SIRT1 has multiple functions, this is the first study to directly link the increase in SIRT1 activity to a reduction in DNA damage-induced vascular calcification and osteogenic differentiation of vSMCs.
Following DNA damage, SIRT1 expression was increased within H2O2 damaged cells, and upon further investigation via cell fractionation, SIRT1 levels were found to be significantly reduced within the nucleus following DNA damage, with increased SIRT1 expression within the cytoplasm compared to control conditions. Whilst previous work has been conducted on the role of SIRT1 within the nucleus, predominantly as a nuclear shuttling partner for a variety of transcription factors including key senescence regulator p53 and FOXO,45–47 there is still debate surrounding SIRT1 regulation within the cytoplasm as well as the nucleus under different metabolic states.48 Previous work in Drosophila has shown that during embryonic development, dynamic changes occur in the subcellular localization of Sir2,49 with more recent studies suggesting that the nucleo-cytoplasmic shuttling of SIRT1, as observed in here and elsewhere, increases cellular resistance to apoptosis and may increase participation in cellular differentiation.50,51 Furthermore, this study is the first to demonstrate a lack of SIRT1 in the nucleus compared to its presence in the cytoplasm in H2O2 and HG-treated conditions, suggesting a direct cytoplasmic regulation of SIRT1 within this diabetic environment. Previous studies have suggested that phosphorylation of SIRT1 at Ser-16452 may inhibit the nuclear translocation of SIRT1, allowing its retention in the cytoplasm and overall reduction in activity. Collectively, these data may offer an explanation as to the lack of improvement observed in the DDR even though SIRT1 protein levels are increased during H2O2 treatment, due the inability of SIRT1 to interact and promote the activation of DNA repair pathways53 and further suppress osteogenic differentiation.19
To further evaluate the role of SIRT1 in H2O2-induced DNA damage, SIRT1 was inhibited via Sirtinol and activated via SRT1720. The presence of γ-H2AX was confirmed via quantification of foci accumulation in the nucleus. Inhibition of SIRT1 demonstrated an increase in foci, which exponentially increased during a 3 h recovery time. Conversely, γ-H2AX staining for cells treated with SRT1720 peaked at 1 h following H2O2 treatment, with a reduction in γ-H2AX staining detected after 3 h. Previous studies have suggested a mechanism in which SIRT1 physically interacts with acetyl-transferase Tip60, inhibiting the acetylation of γ-H2AX and thus reducing the cellular response, something these data corroborate.54 Furthermore, SIRT1 knockout cells appear to have increased sensitivity to radiation damage and are more likely to undergo cell death than wild-type cells,55 again suggesting that deacetylation of proteins in this pathway is required to prevent cells from acquiring a senescent or apoptotic phenotype.
DNA damage was also assessed using the comet assay, with SIRT1 activation significantly reducing comet length after 3 h, suggesting activation of a repair pathway, with SIRT1 inhibition having converse effects. Further examination of the DNA repair pathways demonstrated phosphorylation of both NBS1 and MRE11 within SIRT1 activated cells, which may account for the repair observed in DNA damaged cells following SIRT1 activation. Previous studies have suggested that following DNA damage, NBS1 and SIRT1 are both recruited to the chromatin, and associated with one another, causing a deacetylation of NBS1, a prerequisite to its activation.24 This effect is corroborated by these data, with SIRT1 activation reducing acetylation around the H3K27ac mark within the transcription start site, suggesting that deacetylation promotes production of the NBS1 protein, enabling an active MRN repair complex to be produced. In addition, within HG conditions, acetylation of the NBS1 promotor is significantly increased with no further phosphorylation or production of NBS1 protein, indicating that whilst HG conditions are sufficient to induce DNA damage, they do not activate the DNA repair MRN complex, possibly explained by the reduction of SIRT1 within the cells. These data further confirm that SIRT1 activation is required for the phosphorylation of MRE11 following DNA damage via the ATM kinase, which is simultaneously up-regulated via SIRT1 activation. Previous studies have demonstrated that phosphorylation of MRE11 via ATM at s676 and s678 is important in the response to DNA DSBs and is dependent on the activation and presence of NBS1.56 This is consistent with data in this study, suggesting that both MRE11 and NBS1 should be phosphorylated to induce repair. Interestingly, RAD50 expression significantly increased following DNA damage within HG conditions, however, no increase in DNA repair was observed via the comet assay. This is in line with previous studies that demonstrate phosphorylation of both MRE11 and NBS1 may be more critical to MRN activation than RAD50 production.57
In summary, these data suggest a model in which DNA repair through the MRN complex is not fully activated by a diabetic environment, possibly due to loss of SIRT1 within the patient. Loss of SIRT1 may lead to increased acetylation of NBS1, blocking its phosphorylation sites, thereby inhibiting further activation of ATM and thus the formation of the MRN complex, and ultimately DNA repair.28 This work extends previous studies suggesting that a loss of SIRT1 may be responsible for inducing a pro-apoptotic, pro-calcification environment in which p53-mediated DNA repair is inhibited.58,59 These findings add further strength to this hypothesis, demonstrating that an increase in SIRT1 expression promotes MRN activation, resulting in increased DNA repair and cell survival. Most importantly, this work highlights the complex regulation SIRT1 in diabetes, and importance in the role of DNA damage in vascular calcification. This offers new insights into specific therapeutic targets that could be used for development with potent SIRT1 analogues in the future, thus providing hope into an improved management of diabetic-associated calcification, a pathology for which there is no current treatment.
Supplementary material
Supplementary material is available at Cardiovascular Research online.
Conflict of interest: none declared.
Funding
This work was supported by a Manchester Metropolitan University Research Studentship (to F.B.L. and R.W.) and a British Heart Foundation (PG/14//30/307 to M.Y.A. and F.W.).
Time for primary review: 22 days
References
1
2
3
4
5
6
7
8
9
10
11
12
13
14
15
16
17
18
19
20
21
22
23
24
25
26
27
28
29
30
31
32
33
34
35
36
37
38
39
40
41
43
44
45
46
47
48
49
50
51
52
53
54
55
56
57
Translational perspective
Our study provides the first evidence that DNA damage is enhanced in the vasculature of the diabetic patient and that this process, in tandem with loss of SIRT1, exacerbates pathological smooth muscle cell calcification. We propose that current SIRT1 activators and their analogues may be useful as investigational tools, and further elucidation of downstream mechanisms of SIRT1 will aid the development of novel and more precise drug regimens.