 Diet-induced dyslipidemia induces metabolic and migratory adaptations in regulatory T cells
Cardiovascular Research

 ,
Frank H Schaftenaar,
Amanda C Foks,
Amy Harms,
Estefania Moreno-Gordaliza,
Ilze Bot,
,
Frank H Schaftenaar,
Amanda C Foks,
Amy Harms,
Estefania Moreno-Gordaliza,
Ilze Bot,

- Altmetric
Aims
A hallmark of advanced atherosclerosis is inadequate immunosuppression by regulatory T (Treg) cells inside atherosclerotic lesions. Dyslipidemia has been suggested to alter Treg cell migration by affecting the expression of specific membrane proteins, thereby decreasing Treg cell migration towards atherosclerotic lesions. Besides membrane proteins, cellular metabolism has been shown to be a crucial factor in Treg cell migration. We aimed to determine whether dyslipidemia contributes to altered migration of Treg cells, in part, by affecting cellular metabolism.
Methods and results
Dyslipidemia was induced by feeding Ldlr−/− mice a western-type diet for 16–20 weeks and intrinsic changes in Treg cells affecting their migration and metabolism were examined. Dyslipidemia was associated with altered mTORC2 signalling in Treg cells, decreased expression of membrane proteins involved in migration, including CD62L, CCR7, and S1Pr1, and decreased Treg cell migration towards lymph nodes. Furthermore, we discovered that diet-induced dyslipidemia inhibited mTORC1 signalling, induced PPARδ activation and increased fatty acid (FA) oxidation in Treg cells. Moreover, mass-spectrometry analysis of serum from Ldlr−/− mice with normolipidemia or dyslipidemia showed increases in multiple PPARδ ligands during dyslipidemia. Treatment with a synthetic PPARδ agonist increased the migratory capacity of Treg cells in vitro and in vivo in an FA oxidation-dependent manner. Furthermore, diet-induced dyslipidemia actually enhanced Treg cell migration into the inflamed peritoneum and into atherosclerotic lesions in vitro.
Conclusion
Altogether, our findings implicate that dyslipidemia does not contribute to atherosclerosis by impairing Treg cell migration as dyslipidemia associated with an effector-like migratory phenotype in Treg cells.

1. Introduction
Atherosclerosis is an autoimmune-like disease affecting the arterial wall in which (modified) lipoproteins, such as low-density lipoprotein (LDL) accumulate in the subendothelial space and elicit an adaptive immune response involving CD4+ T cells.1 Dyslipidemia as exemplified by hypercholesterolemia and/or hypertriglyceridemia is a driving force for the development of atherosclerosis. A disease in which this is epitomized is familial hypercholesterolemia (FH), which is an inherited disease with a prevalence of 1 in 500 individuals worldwide2,3 and is characterized by dyslipidemia and premature cardiovascular disease (CVD). Given the autoimmune-like nature of atherosclerosis, immunomodulation has enormous potential as a therapy for CVD. Regulatory T (Treg) cells represent a subset of CD4+ T cells which maintains tolerance to self-antigens and regulates inflammation to dampen tissue damage.4 Treg cells are thus considered a promising therapeutic target to treat autoimmune-like disorders, including atherosclerosis.5 Accordingly, as Treg cell abundancy is low in advanced atherosclerotic lesions in mice6 and humans,7–9 a local loss of tolerance to lipoproteins is speculated to be causal in atherosclerosis progression.
The capacity of Treg cells to bind to activated endothelium is inversely related to the degree of diet-induced dyslipidemia, presumably through decreased expression of ligands for P- and E-selectin on Treg cells.6 Thereby, fewer Treg cells which egress from secondary lymphoid organs (SLOs) can migrate towards atherosclerotic lesions, thereby contributing to a local loss of tolerance. Diet-induced dyslipidemia likely also affects Treg cell migration through a distinct mechanism. Specifically, obesity-induced lipid accumulation and metabolic stress primes CD4+ T cells to acquire an effector phenotype by altering mammalian target of rapamycin complex 2 (mTORC2) activity in the PI3K-p110δ-Akt kinase signalling pathway. This alteration lowers the expression of CD62L and C-C chemokine receptor type 7 (CCR7)10 which are involved in the homing of T cells to lymph nodes (LNs) through high endothelial venules. Thus, dyslipidemia potentially modulates Treg cell migration by affecting the membrane expression of proteins required for their migration to sites of inflammation and LNs.
Recently, it was discovered that Treg cells also adapt their metabolism during inflammation and require glycolysis to generate sufficient ATP for their migration.11
Dyslipidemia could affect Treg cell migration by affecting the cellular metabolism of Treg cells. Cholesterol accumulation in ATP-binding cassette G1 (ABCG1)-deficient Treg cells inhibits mTORC1.12 mTORC1 can regulate cellular metabolism by promoting glycolysis in T cells through its downstream targets hypoxia inducible factor-1α (HIF1α) and Myc.13,14 Moreover, mTORC1 can inhibit fatty acid (FA) oxidation, by inhibiting the rate-limiting enzyme carnitine-palmitoyl transferase 1A (Cpt1a).15,16 Additionally, dyslipidemia can affect cellular metabolism in Treg cells through the lipid-induced activation of peroxisome proliferator activated receptors (PPARs), a class of lipid-activated transcription factors which can modulate cellular metabolism.17
Altogether, these reports indicate that key regulators of cellular metabolism and migration in Treg cells can be affected by perturbations in the levels of extra- and intracellular lipids.
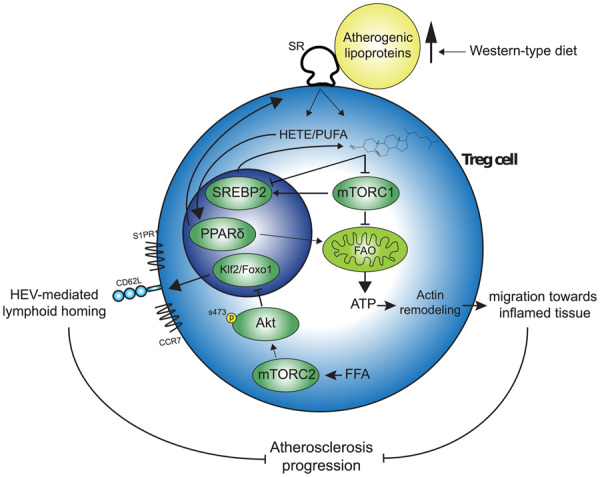
In this article, we used Ldlr−/− mice to investigate dyslipidemia-induced effects on the migratory phenotype and cellular metabolism of Treg cells residing in SLO. We discovered that dyslipidemia induced intrinsic changes in mTOR signalling and glycolysis, and increased PPARδ target gene expression and FA oxidation in splenic Treg cells. Dyslipidemia increased the capacity of Treg cells to migrate towards sites of inflammation and the PPARδ agonist GW501516 increased their migration in an FA oxidation-dependent manner. These results indicate that dyslipidemia can induce an effector-like migratory phenotype in Treg cells residing in specific SLOs, in part by skewing their metabolism, possibly leading to an increased potency to migrate towards sites of inflammation.
2. Methods
2.1 Mice
Diet-induced dyslipidemia and atherosclerosis were established by feeding Ldlr−/− mice from 9 to 12 weeks of age a western-type diet (WTD) containing 0.25% cholesterol and 15% cocoa butter (Special Diet Services) for 16–20 weeks (unless stated otherwise). The animals were otherwise kept under standard laboratory conditions and were fed a normal chow diet (NCD) and water ad libitum. At sacrifice, the mice were anaesthetized by subcutaneous injections with ketamine (100 mg/mL), sedazine (25 mg/mL), and atropine (0.5 mg/mL). The mice were euthanized while sedated by disrupting their perfusion, as is described in the Supplementary material online, Experimental Procedures. Alternatively, the mice were euthanized while sedated by cervical dislocation, depending on the organs which were harvested. All animal work was performed according to the guidelines of the European Parliament Directive 2010/63EU and the experimental work was approved by the animal ethics committee of Leiden University.
2.2 Flow cytometry
Spleens and lymph nodes were mashed through a 70 μm cell strainer after isolation. For the staining of surface markers, cells were stained at 4°C for 30 min in staining buffer [PBS with 2% (vol/vol) foetal bovine serum (FBS)] in which we diluted the antibodies. Intracellular transcription factors were stained for by following the FoxP3 staining protocol (eBioscience, Santa Clara, CA, US.). Filipin III (Cayman Chemicals, Ann Arbor, MI, USA) and Bodipy™ (Thermo Fisher, Waltham, MA, USA) staining for cellular lipids (details in Supplementary material online, Experimental Procedures) was quantified in CD4+CD25+ Treg cells, of which ±95% expressed FoxP3 in SLOs (data not shown). For phosphorylated proteins, cells were fixed with BD Phosflow™ Lyse/Fix Buffer (BD Biosciences) and subsequently permeabilized with Phosflow Perm buffer III (BD Biosciences, Franklin Lakes, NJ, USA). Flow cytometric analysis was performed on a FACSCantoII (BD Biosciences) or a Cytoflex S (Beckman Coulter, Brea, CA, USA) and data were analysed using Flowjo software (TreeStar, Ashland, OR, USA).
2.3 Cell culture
Treg cells were stimulated using plate-coated anti-CD3e (5 μg/mL; eBioscience), anti-CD28 (0.5 μg/mL; eBioscience), and 200 U/mL recombinant mIL-2 (Peprotech) and cultured in RPMI-1640 supplemented with 2 mM l-glutamine, 100 U/mL pen/strep and 10% FBS (all from Lonza). In vitro lipid loading experiments were performed by supplementing culture medium with 10% mouse serum from Ldlr−/− mice with normolipidemia or dyslipidemia. Alternatively, lipid loading was achieved by culturing Treg cells with β-very LDL particles. Etomoxir was used at 100 µM, which has no off-target effects on oxidative phosphorylation.18
2.4 RNA and immunoblot analysis
RNA isolation was performed using the guanidium isothiocyanate method after which cDNA was generated using RevertAid M-MuLV reverse transcriptase per manufacturer’s instructions (Thermo Fisher). Quantitative gene expression analysis was performed using Power SYBR Green Master Mix on a 7500 Fast Real-Time PCR system (Applied Biosystems, Foster City, CA, USA). Gene expression was determined using the ddCt method. Immunoblot analysis was performed as described previously.19
2.5 FA oxidation assay
Freshly isolated or cultured Treg cells were incubated for 2 h (unless otherwise stated) at 37°C after which the supernatant was transferred to 20 mL scintillation vials which were sealed with a rubber stopper containing Whatman filtration paper pre-equilibrated in milliQ. After 48 h of incubation at 37°C, the Whatman filtration paper containing the metabolized 3H2O was harvested. More details on this assay are provided in the supplements.
2.6 Metabolic flux assay
OCR and extracellular acidification rate (ECAR) were measured using an XF96e Extracellular Flux Analyzer (Seahorse Bioscience, North Billerica, MA, USA) per manufacturer’s instructions.
2.7 Treg cell peritoneum migration
Treg cell peritoneum migration was based on Fu et al.20 and performed as described previously.
2.8 Aorta influx
Aortic Treg cell influx was examined based on Li et al.21 and performed as described previously.
2.9 Transmigration assay
Treg cells were applied to transwell tissue culture well inserts (5 μm pore-size) and left to migrate towards 250 ng/mL CCL21 (Peprotech, London, UK) for 6–8 h. The number of migrated cells was determined manually using a haemocytometer.
2.10 Serum analysis
Concentrations of total cholesterol and triglycerides in the serum were determined using a colorometric assay. Concentrations of free FAs in the serum were quantified using the Free Fatty Acid Quantification Kit (Sigma) as per manufacturer’s instructions. Mice were fasted for 4 h prior to blood collection for measurement of blood glucose levels. Blood samples were taken from the tail vein and directly applied to an Accu-Check glucometer (Roche Diagnostics, Mannheim, Germany).
2.11 Serum lipidomics
Ldlr −/− mice were fed a WTD or maintained on an NCD for 8 weeks and upon sacrifice, serum samples were collected and frozen at −80°C until use. The operating procedures of the targeted lipidomics platform are optimized from the previously published method.22 The leukotrienes, hydroxyl-FAs, epoxy-FAs, and lipoxins were analysed using a fully targeted method as previously described.23
2.12 Suppression assay
Treg cells were isolated and co-cultured in complete RPMI with splenocytes labelled with 5 μM CellTrace Violet. The cells were stimulated with anti-CD3e (1 μg/mL; eBioscience), anti-CD28 (0.5 μg/mL; eBioscience), and 100 U/mL recombinant mIL-2 (Peprotech). The suppressive capacity of Treg cells was determined by flow cytometry by measuring the proliferation of CellTrace Violet labelled CD4+ T effector cells after 72 h in different Treg: splenocyte ratios in which the amount of splenocytes per well were set at 50 000 cells.
2.13 Statistical analysis
A two-tailed Student’s t-test was used to compare individual groups with Gaussian distributed data. Correction for multiple comparisons was performed using Bonferroni correction. Non-parametric data were analysed using a Mann–Whitney U-test. Data from three groups were analysed using a one-way analysis of variance (ANOVA) with a subsequent Tukey’s multiple comparison test. A P-value below 0.05 was considered significant. In the figures * indicates P < 0.05, ** indicates P < 0.01, *** indicates P < 0.001, and **** indicates P < 0.0001.
3. Results
3.1 Diet-induced dyslipidemia alters mTORC2 signalling and decreases Treg cell LN homing
To study alterations in Treg cell metabolism and migration in the context of dyslipidemia and atherosclerosis, NCD fed Ldlr−/− mice were compared to Ldlr−/− mice which were fed a WTD for 16–20 weeks. WTD-fed mice develop advanced atherosclerotic lesions with a low abundance of Treg cells6 and metabolic dysregulation in the form of hypercholesterolemia (Supplementary material online, Figure S1A) and hypertriglyceridemia (Supplementary material online, Figure S1B) but not hyperglycemia (Supplementary material online, Figure S1C).
We first examined whether WTD-induced dyslipidemia changes LN migration of splenic Treg cells as dyslipidemia affects CD62L expression in this Treg cell compartment.6
A peritoneal homing experiment20 was performed using isolated splenic CD4+ T cells from NCD- or WTD-fed donor Ldlr−/− mice which were injected i.v. into CD45.1 acceptor mice and the number of donor Treg cells (normalized for the number of injected Treg cells) in mesenteric LNs were quantified. We observed that fewer Treg cells from WTD-fed mice (WTD-Treg cells) had migrated towards mesenteric LNs compared with Treg cells from NCD-fed mice (NCD-Treg cells) (Figure 1A). Interestingly, the number of donor conventional T (Tconv) cells which had migrated into the mesenteric LNs was equal in both diet-groups (Supplementary material online, Figure S1D). We postulated that, similar to CD4+ effector T cells in obesity, the observed decrease in LN homing was caused by metabolic stress in Treg cells which increased mTORC2 activity. Through phosphorylation of Akt kinase at the serine 473 residue24 and subsequent phosphorylation of forkhead Box O1 (Foxo1), increased mTORC2 activity decreases the expression of Klf2, CD62L, CCR7, and S1pr1, as suggested in Figure 1B. Klf2 encodes Krüppel-like factor 2 which, like Foxo1, is a transcription factor whose target genes include CD62L, CCR7, and sphingosine-1-phosphate receptor 1 (S1Pr1).24 The percentage p-Akt S473 expressing Treg cells was elevated in WTD-Treg cells as compared to NCD-Treg cells (Figure 1C). The percentage of p-Akt S473 expressing splenic Tconv cells was also increased in WTD-fed mice (Supplementary material online, Figure S1E), though this effect was ∼30-fold smaller than in Treg cells.
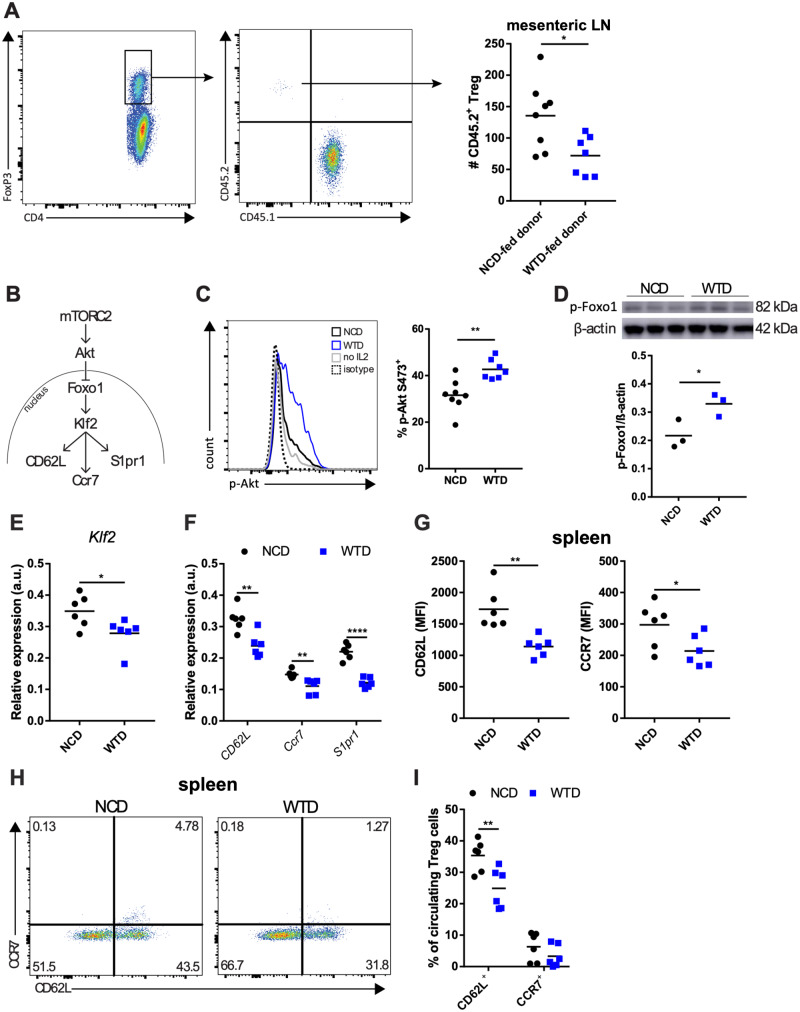
Diet-induced dyslipidemia in Ldlr−/− mice increases mTORC2 activity and decreases lymph node homing of splenic Treg cells. (A) Quantification of adoptively transferred Treg cells in mesenteric LN in a peritoneal homing experiment. CD4+ donor T cells were adoptively transferred and the presented Treg cell number is normalized for the number of Treg cells which was present in each CD4+ donor cell fraction. n = 7–8 mice/group. (B) mTORC2-Akt-Foxo1-Klf2 axis. (C) Representative plot of p-Akt detection by flow cytometry (left panel) and percentage of p-Akt+ cells in splenic Treg cells from NCD-fed (NCD-Treg cells) or WTD-fed mice (WTD-Treg cells). n = 7–8 mice/group. (D) Representative immunoblot and quantification of p-Foxo1 levels in NCD- and WTD-Treg cells. n = 3 mice/group. (E) Klf2 mRNA expression and (F) mRNA expression of CD62L, Ccr7 and S1pr1 in NCD- and WTD-Treg cells. n = 6 mice/group. (G) MFI for CD62L and CCR7 on NCD- and WTD-Treg cells. n = 6 mice/group. (H) Representative plots of percentages of CD62L+ and CCR7+ from the experiment in G. (I) CD62L and CCR7 expression in Treg cells in the blood of NCD- and WTD-fed mice. n = 6 mice/group. A two-tailed Student’s t-test was used. *P < 0.05, **P < 0.01, ***P < 0.001, and ****P < 0.0001. A represents one experiment. C–H are representative data for two independent experiments. MFI, median fluorescence intensity.
In WTD-Treg cells, levels of p-Foxo1, reflecting Foxo1 excluded from the nucleus,24 were elevated (Figure 1D). The decreased Klf2 expression (Figure 1E) could, together with less nuclear Foxo1, explain the decreased expression of CD62L, Ccr7, and S1pr1 observed in WTD-Treg cells (Figure 1F). We observed, using flow cytometry, decreased protein expression of CD62L and CCR7 (Figure 1G) and a decreased percentage of Treg cells expressing CD62L and/or CCR7 (Figure 1H) in splenic WTD-Treg cells. Interestingly, the percentage of CD44+ (Supplementary material online, Figure S1F) or CD69+ Treg cells (Supplementary material online, Figure S1G) and Ccr2 and Ccr5 expression in Treg cells (Supplementary material online, Figure S1H) were unaffected by diet-induced dyslipidemia, suggesting that mostly the LN homing genes were affected. Lastly, the percentage of circulating CD62L+ Treg cells was ∼10% lower in WTD-mice as compared to NCD-mice (Figure 1I).
Overall, these data indicate that, similar to diet-induced obesity, WTD-induced dyslipidemia caused intrinsic changes in mTORC2 activity in Treg cells and decreased the capacity of Treg cells to migrate towards LNs.
3.2 Diet-induced dyslipidemia increases lipids and inhibits mTORC1 activity in WTD-Treg cells
Next, we characterized lipid accumulation of Treg cells in various SLOs and the circulation.
First, we examined the cholesterol levels in Treg cells in the blood, spleen, draining LN (mediastinal, medLN), and non-draining LN (inguinal, iLN) in NCD- and WTD-fed Ldlr−/− mice using filipin staining. WTD-Treg cells in spleen and medLN showed cholesterol accumulation whereas Treg cells in the blood and iLN were unaffected (Figure 2A). Cholesterol accumulation after 4 weeks of WTD (where the inflammatory response is not at its peak in Ldlr−/− mice) was observed specifically in Helios+ Treg cells (Supplementary material online, Figure S2A), suggesting that lipid accumulation may be subset specific.25
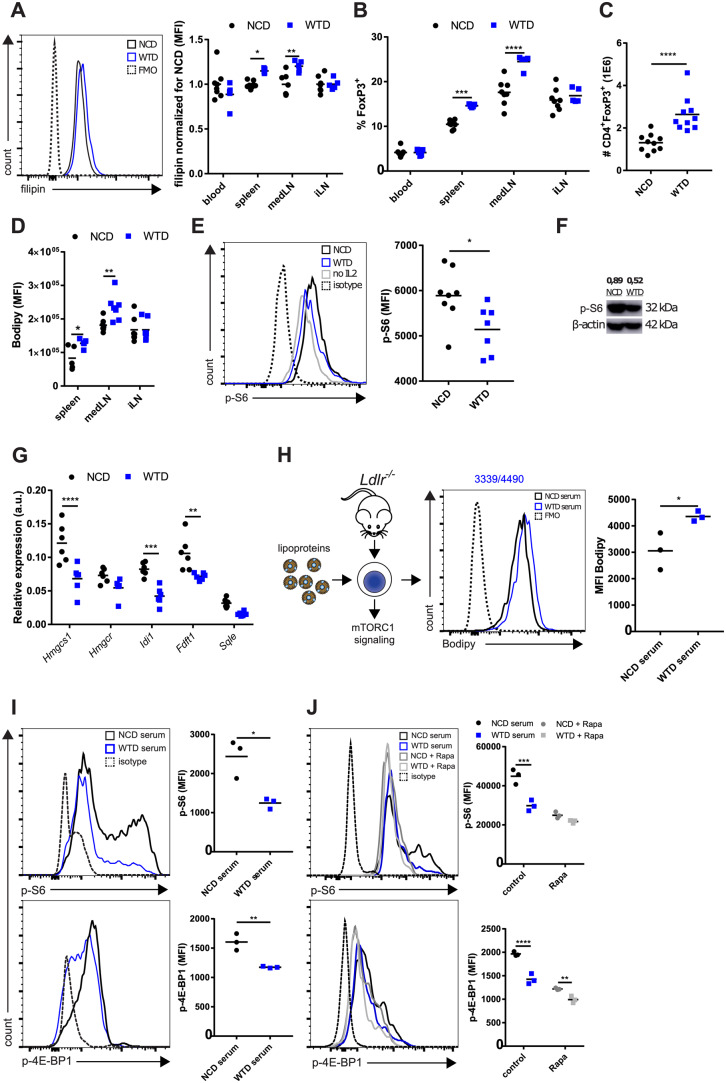
mTORC1 activity is diminished in Treg cells from WTD-fed Ldlr−/− mice. (A) Filipin staining for cholesterol in CD4+CD25+ Treg cells from blood, spleen, mediastinal lymph node (medLN), and inguinal lymph node (iLN) of NCD- and WTD-fed Ldlr−/− mice. Normalized per tissue for the NCD group. n = 5–8 mice/group. (B) Percentage of Treg cells in same tissues and groups as in (A). (C) Absolute number of Treg cells in spleen of NCD- or WTD-fed mice. n = 10 mice/group. (D) Bodipy staining for lipid droplets in CD4+CD25+ Treg cells. (E) p-S6 levels in splenic Treg cells from NCD-fed (NCD-Treg cells) or WTD-fed mice (WTD-Treg cells) as measured by flow cytometry. n = 7–8 mice/group. (F) p-S6 immunoblot of flow-sorted NCD- and WTD-Treg cells. p-S6 levels were normalized for β-actin levels as shown above the lanes. n = 1 mouse/group. (G) mRNA expression of genes from mevalonate pathway in NCD- and WTD-Treg cells. n = 6 mice/group. (H) In vitro lipid loading of Treg cells to study mTORC1 signalling. n = 3 mice/group. (I) p-S6 and p-4E-BP1 levels in isolated splenic Ldlr−/− Treg cells after 48 h in vitro lipid loading with serum. n = 3 per group. Cells from three donor mice were used. (J) p-S6 and p-4E-BP1 levels after 48 h in vitro lipid loading of isolated wildtype splenic Treg cells with rapamycin and/or serum. n = 3 mice/group. Cells from three donor mice were used. A two-tailed Student’s t-test was used. Non-parametric data were analysed using a Mann–Whitney U-test. *P < 0.05, **P < 0.01, ***P < 0.001, and ****P < 0.0001. A–E and G–I are representative data for three individual experiments. J represents one experiment. K is representative for two individual experiments. FMO, fluorescence minus one control.
The percentages of Treg cells in spleen and medLN were increased after 16–20 weeks of WTD (Figure 2B), which might be caused by proliferation in an earlier stage of atherosclerosis. In the spleen, this increase in the percentage of Treg cells resulted in a strongly expanded splenic Treg cell population (Figure 2C). Furthermore, dyslipidemia associated with lipid droplet accumulation in Treg cells in the spleen and medLN (Figure 2D). Given the extent of lipid accumulation and the size and relevance of this population, we specifically used splenic Treg cells for more extensive molecular, metabolic and functional characterization. Hence, when comparing NCD- and WTD-Treg cells we refer to Treg cells isolated from spleens of Ldlr−/− mice fed an NCD or WTD, respectively, unless explicitly stated otherwise.
In line with cholesterol accumulation, mTORC1 activity, reflected by phosphorylated (p)-S6 levels, was lower in WTD-Treg cells than in NCD-Treg cells as measured by flow cytometry (Figure 2E) and immunoblot (Figure 2F). In addition, mRNA expression of Srebp1 and Srebp2, which is decreased by inhibition of mTORC126,27 and whose activity is decreased in conjunction with mTORC1 upon increased lysosomal- and endoplasmic reticulum-cholesterol levels,28 was diminished in WTD-Treg cells (Supplementary material online, Figure S2B). The expression of enzymes which are crucially involved in cholesterol synthesis through the mevalonate pathway was decreased at an mRNA level (Figure 2G). In particular, Hmgcs1, Idi1, and Fdft1 mRNA expression was decreased by ∼50% (Figure 2G). Next, we measured suppressive capacity of NCD- and WTD-Treg cells as Treg cells lacking Raptor, an essential protein in mTORC1, lose their suppressive capacity due to reduced activity of the mevalonate pathway.19NCD-Treg cells and WTD-Treg cells had similar capacity to suppress proliferation of CD4+ T effector cells (Supplementary material online, Figure S2C). In line, no differences were observed in the percentage of ICOS+ Treg cells (Supplementary material online, Figure S2D) and Il10 and Tgfb mRNA expression (Supplementary material online, Figure S2E), though there was a slight increase in CTLA-4+ (Supplementary material online, Figure S2F) cells in WTD-Treg cells as compared to NCD-Treg cells. mTORC1 activity as measured by p-S6 levels was also decreased in Tconv cells from WTD-fed mice (Supplementary material online, Figure S2G) indicating that mTORC1 signalling in non-Treg cells can also be affected by dyslipidemia.
Subsequently, we aimed to mimic dyslipidemia in vitro by culturing Treg cells in medium supplemented with serum from NCD or WTD-fed mice, or with isolated β-very low-density lipoprotein (β-VLDL) (Figure 2H), thereby increasing cholesterol load without lipotoxicity-induced apoptosis as can occur with oxidized LDL (oxLDL).29 Lipid loading in vitro through serum supplementation mimicked the effects of hypercholesterolemia on mTORC1 activity as measured by levels of p-S6 and p-4E-BP1 (an additional mTORC1 target) levels in Treg cells (Figure 2I). Importantly, this effect of serum supplementation also occurred in Treg cells isolated from C57/BL6 mice and was mTOR-dependent, as preincubation with rapamycin (an mTOR inhibitor) severely diminished the WTD-serum induced inhibition of mTORC1 activity (Figure 2J). Additionally, p-S6 was reduced by ∼50% when incubating Treg cells with isolated β-VLDL (Supplementary material online, Figure S2H).
Altogether, these results showed that dyslipidemia induced lipid accumulation in Treg cells and reduced mTORC1 activity and the expression of genes crucially involved in the mevalonate pathway, without altering their suppressive capacity.
3.3 WTD-Treg cells have impaired glycolysis but increased FA oxidation
Next, we reasoned that dyslipidemia-induced mTORC1 inhibition would change the bioenergetic metabolism in WTD-Treg cells and measured glycolysis in NCD- and WTD-Treg cells using an XF analyzer. We observed a decrease in the basal ECAR in WTD-Treg cells (Figure 3A), reflecting decreased lactate producing glycolysis. Furthermore, WTD-Treg cells had decreased glycolytic reserve and glycolytic capacity upon exposure to the complex I inhibitor oligomycin (Figure 3B). We observed a decrease in mRNA expression of the target genes of HIF1α and Myc (Glut1, Pgk1, LDHa, Pkm2) when culturing Treg cells with WTD serum in vitro (Supplementary material online, Figure S3A). However, immunoblot analysis revealed that HIF1α levels were unchanged (Supplementary material online, Figure S3B) as were the mRNA expression levels of Glut1, Pgk1, LDHa, Pkm2 (Supplementary material online, Figure S3C) in freshly isolated WTD-Treg cells as compared to NCD-Treg cells. Similar to HIF1α, Myc can transcriptionally regulate the expression of glycolytic genes14; however, Myc protein levels were equal between NCD- and WTD-Treg cells (Supplementary material online, Figure S3D). We speculate that, as the Treg cells, we used were preactivated, mTORC1 inhibition affected glycolysis only upon activation as mTORC1 activity is strongly increased upon activation.19
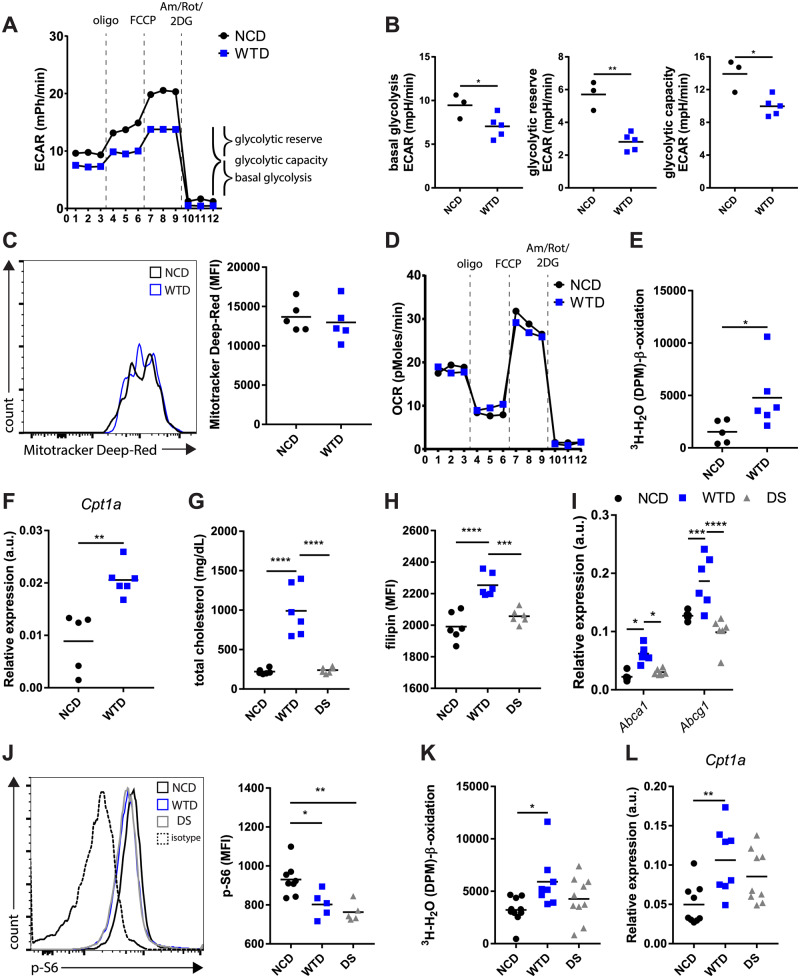
Diet-induced dyslipidemia in Ldlr−/− mice impaired glycolytic metabolism but enhanced mitochondrial FA oxidation in WTD-Treg cells. (A) ECAR in NCD- and WTD-Treg cells in response to indicated compounds. n = 3–5 mice/group. (B) Basal glycolysis, glycolytic reserve, and glycolytic capacity quantified from (A). (C) Mitochondrial mass in isolated NCD- and WTD-Treg cells. n = 5 mice/group. (D) OCR in same assay as in (A). (E) 3H-palmitic acid detritiation in isolated NCD- and WTD-Treg cells. n = 5–6 mice/group. (F) Cpt1a expression in isolated NCD- and WTD-Treg cells. n = 5–6 mice/group. (G) Total serum cholesterol levels in diet-switch experiment, examining NCD- and WTD-fed Ldlr−/− mice as well as mice switched from a WTD to an NCD. n = 6 mice/group. (H) Filipin staining in NCD-, WTD-, and diet-switch (DS)-Treg cells. n = 6 mice/group. (I) mRNA expression of Abca1 and Abcg1 in NCD-, WTD-, and DS-Treg cells. n = 6 mice/group. (J) p-S6 levels as measured by flow cytometry in NCD-, WTD-, and DS-Treg cells. n = 5–8 mice/group. (K) 3H-palmitic acid detritiation after 4 h incubation with 3H-palmitic acid in NCD-, WTD-, and DS-Treg cells. n = 8–10 mice/group. (L) Cpt1a mRNA expression in NCD-, WTD-, and DS-Treg cells. n = 8–10 mice/group. Data were analysed using a two-tailed Student’s t-test and a one-way ANOVA with a subsequent Tukey’s multiple comparison test. *P < 0.05, **P < 0.01, ***P < 0.001, and ****P < 0.0001. A–J represents data from two independent experiments. Data in K and L are pooled from two independent experiments showing similar effects. DS, diet switch group.
mTORC1 can also promote mitochondrial biogenesis,30 but the mitochondrial mass in Treg cells was equal in both groups (Figure 3C). In line, the OCR, a measure for oxidative phosphorylation, showed no differences between NCD-Treg cells and WTD-Treg cells (Figure 3D), implicating diet-induced dyslipidemia did not affect mitochondrial function.
As mTORC1 can modulate FA oxidation through Cpt1, we next studied FA oxidation in Treg cells by measuring the detritiation of 3H-palmitic acid. Rapamycin increased mitochondrial FA oxidation in Treg cells as compared to the control (Supplementary material online, Figure S3E). In line with dyslipidemia-induced mTORC1 inhibition, isolated WTD-Treg cells displayed twice the level of mitochondrial FA oxidation (Figure 3E) and a comparable increase in Cpt1a expression (Figure 3F). Importantly, FA oxidation in Tconv cells was unaffected (Supplementary material online, Figure S3F). Although CPT1 deficient Treg cells proliferate normally,18 mitochondrial FA oxidation has also been shown to regulate Treg cell proliferation.31 Importantly, WTD-Treg cells were not more proliferative than NCD-Treg cells at this advanced timepoint of feeding mice a WTD (Supplementary material online, Figure S3G). To examine whether the metabolic adaptations in WTD-Treg cells were specifically linked to diet-induced dyslipidemia and not the chronic systemic low-grade inflammation which is associated with atherosclerosis,32 we performed a diet-switch experiment in which we reverted WTD-fed mice to an NCD. At 18 days after reverting the mice to an NCD, total cholesterol levels in the serum were normalized in the diet-switch group (Figure 3G). Accordingly, cholesterol levels were normalized in Treg cells from diet-switch mice (hereafter referred to as DS-Treg cells) (Figure 3H). In line, gene expression of liver-X-receptor (which is activated by cholesterol-derivatives) target genes Abca1 and Abcg1 was increased in WTD-Treg cells but not in DS-Treg cells (Figure 3I). We next measured mTORC1 activity and FA oxidation to assess whether these were also normalized in Treg cells when WTD-fed mice are switched to an NCD. Strikingly, flow cytometric analysis revealed that mTORC1 activity in DS-Treg cells was diminished as compared to NCD-Treg cells (Figure 3J). This suggests that normalization of mTORC1 activity may occur gradually after normalization of cellular cholesterol levels. Remarkably, however, despite mTORC1 activity being attenuated, mitochondrial FA oxidation (Figure 3K) and Cpt1a expression in DS-Treg cells were equal to NCD-Treg cells (Figure 3L).
Collectively, these data indicate that glycolysis and FA oxidation are modulated in WTD-Treg cells but that the latter effect of dyslipidemia might not be exclusively mediated by mTORC1.
3.4 WTD increases PPARδ ligands in serum and the expression of PPARδ target genes in Treg cells
We sought to determine which additional mechanism(s) could contribute to increased Cpt1a expression and FA oxidation in WTD-Treg cells and reasoned that PPARs might be involved as these are activated by dietary lipids and can modulate glycolysis and FA metabolism.33
We were unable to detect PPARα expression in NCD- or WTD-Treg cells (Supplementary material online, Figure S4A). PPARδ and PPARγ share some of their target genes, but the mRNA expression of PPARγ target genes Scd1 and Dgat did not differ between NCD- and WTD-Treg cells (Supplementary material online, Figure S4B). Since PPARγ target genes are involved in the uptake and biosynthesis of lipids and PPARδ expression was about 10-fold higher compared to PPARγ expression in Treg cells (Supplementary material online, Figure S4A), we focused on the role of PPARδ.
We first examined PPARδ activation in Treg cells and treated isolated Treg cells with GW501516, a PPARδ agonist, in vitro. GW501516 treatment increased the expression of Cpt1a, Slc25a20, and Plin2 while decreasing Lipe expression (Figure 4A). Slc25a20 and Plin2 expression were increased and Lipe expression was decreased in WTD-Treg cells as compared to NCD-Treg cells (Figure 4B), indicating that specific target genes of PPARδ which are involved in FA catabolism (Slc25a20, Lipe) and lipid droplet formation (Plin2) were indeed modulated in WTD-Treg cells.
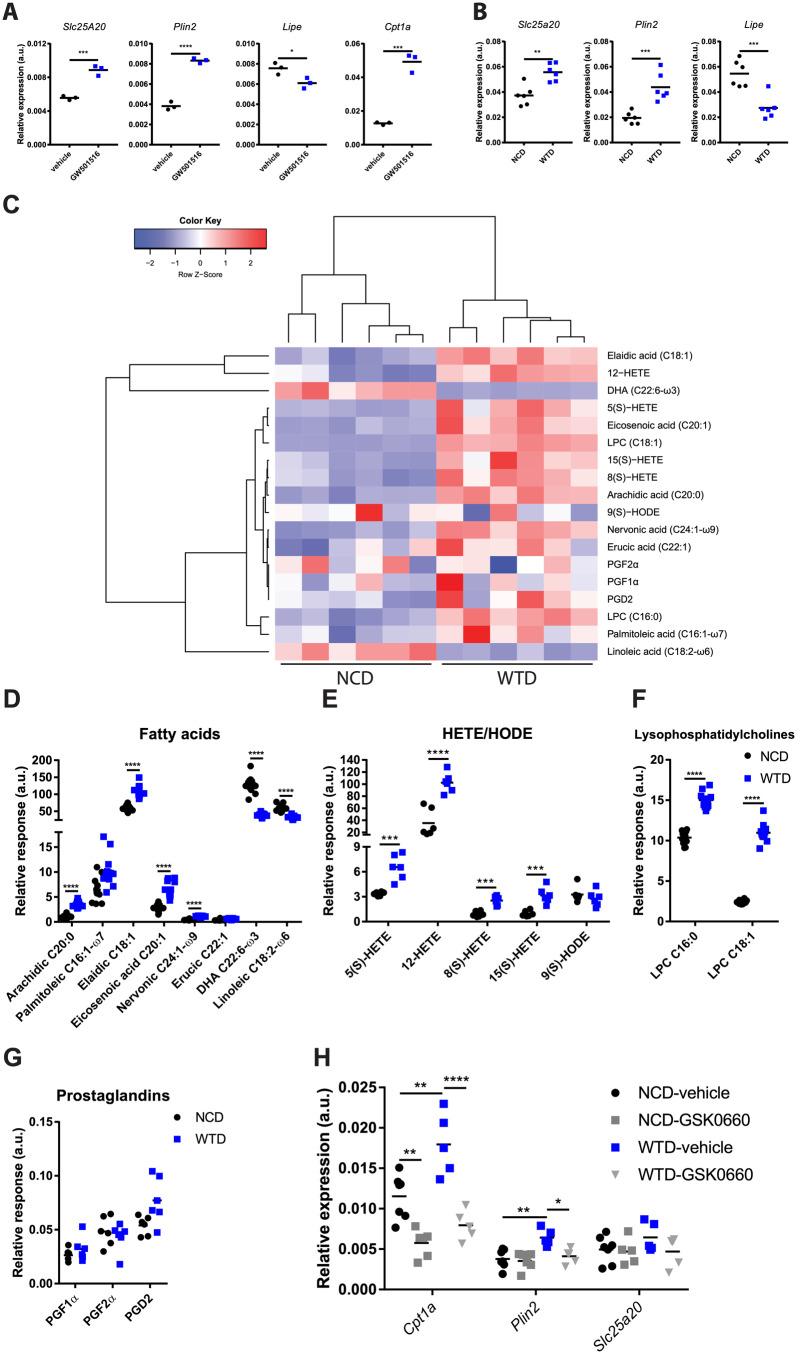
Diet-induced dyslipidemia in Ldlr−/− mice increases circulating PPARδ ligands and PPARδ target gene expression in WTD-Treg cells. (A) mRNA expression of Slc25a20, Plin2, Lipe, and Cpt1a in flow-sorted Treg cells treated with GW501516 or vehicle in vitro. n = 3 mice/group. (B) mRNA expression of Slc25a20, Plin2 and Lipe in NCD- and WTD-Treg cells. n = 6 mice/group. (C) Heatmap showing abundance of selected natural PPARδ ligands from lipidomics screen in serum of NCD and WTD-fed mice. (D) Abundance of PPARδ ligands from fatty acids subclass (n = 12 mice/group), (E) hydroxyeicosatetraenoic acid (HETE) and hydroxyoctadecadienoic acid (HODE) subclasses (n = 6 mice/group), (F) lysophosphatidylcholine subclass (n = 12 mice/group), and (G) prostaglandin subclass (n = 6 mice/group). (H) mRNA expression of PPARδ target genes of NCD- and WTD-Treg cells after in vitro treatment with GSK0660 or vehicle. n = 5–7 mice/group. A two-tailed Student’s t-test with a Bonferroni correction for multiple comparisons was used. Data from four groups were analysed using a one-way ANOVA. *P < 0.05, **P < 0.01, ***P < 0.001, ****P < 0.0001. As C summarizes the data in D–G, the sample size corresponds to the sample size in D–G. In D–G, relative response indicates the abundance of each lipid species relative to its internal standard.
Long-chain FAs which are taken up via CD36, a scavenger receptor and transcriptional target of PPARγ,34 modulate the activity of PPARδ and expression of genes involved in FA- and glucose metabolism.35 Compared to NCD-Treg cells, CD36 levels were increased on WTD-Treg cells but not DS-Treg cells (Supplementary material online, Figure S4C), suggesting that elevated CD36 expression might contribute to increased FA oxidation in WTD-Treg cells. CD36 expression in Tconv cells from WTD-fed mice was also increased but remained far lower as compared to Treg cells (Supplementary material online, Figure S4D). We performed metabolomics profiling by high-performance liquid chromatography and mass spectrometry of the free and total oxidized lipids in sera of NCD- and WTD-fed mice to quantify changes in PPARδ ligand abundance. We selected previously described PPARδ ligands36–38 in our lipidomics platform and examined relative changes in the serum of Ldlr−/− mice fed a WTD for 8 weeks. In general, PPARδ ligands were increased in the dyslipidemia serum of WTD-fed Ldlr−/− mice as compared to NCD control serum (Figure 4C). Especially saturated- and monounsaturated FAs (Figure 4D), hydroxyeicosatetraenoic acid (HETE) (Figure 4E), and lysophosphatidylcholine (Figure 4F) were increased in WTD serum. There were no changes in the abundance of serum prostaglandins (Figure 4G). HETEs can be synthesized from various polyunsaturated FAs, including arachidonic acid (AA), dihomo-γ-linolenic acid (DGLA), or eicosapentaenoic acid (EPA) through similar pathways. AA (20:4 ω-6) showed a 20% decrease in WTD serum as compared to NCD serum (Supplementary material online, Figure S4E). EPA was nearly undetected in WTD serum (Supplementary material online, Figure S4F) but DGLA was actually increased (Supplementary material online, Figure S4G), suggesting that increases in DGLA could have contributed to increased HETEs in WTD serum. Specific triglyceride-derived FAs, which were identified as potent natural ligands for PPARδ but not for PPARγ in macrophages,36 were increased in WTD-serum, including palmitoleic, elaidic, eicosenoic, and erucic acid (Figure 4D). To observe whether free fatty acids (FFAs) and triglycerides indeed changed upon a DS (possibly explaining changes in Cpt1a expression) we measured their serum levels. Reverting WTD-fed mice to an NCD normalized the FFA levels in the serum (Supplementary material online, Figure S4H) as well as serum triglycerides (Supplementary material online, Figure S4I). Next, we tested whether PPARδ activation could indeed explain increased gene expression of Cpt1a, Plin2 and Slc25a20 in WTD-Treg cells. We treated isolated NCD- and WTD-Treg cells in vitro with the PPARδ antagonist/inverse agonist GSK0660 and observed that the increased mRNA expression of Cpt1a and Plin2, but not of Slc25a20, in WTD-Treg cells was sensitive to GSK0660 (Figure 4H). After 4 weeks of WTD, the expression of the PPARδ target gene Plin2 was elevated in WTD-Treg cells and the PPARγ-antagonist T0070907 had no effect on its expression (Supplementary material online, Figure S4J), suggesting that the effects of prolonged dyslipidemia on lipid metabolism-associated genes might indeed be PPARδ-mediated.
The presented data show that dyslipidemia increased the abundance of PPARδ ligands in the circulation, thereby possibly increasing PPARδ activity in Treg cells and contributing to increased FA oxidation.
3.5 Treg cells with high level of FA oxidation migrate more efficiently towards sites of inflammation
We explored whether changes in glycolytic- and FA metabolism affected WTD-Treg cell migration. We mimicked PPARδ activation by dyslipidemia in primary Treg cells in vitro using the PPARδ agonist GW501516 and assessed their migration in a peritoneal homing assay. Similar to WTD-Treg cells, mitochondrial FA oxidation was increased in GW501516-treated Treg cells compared with the control condition (Figure 5A). Additionally, GW501516 treatment decreased Glut1 expression on Treg cells on an mRNA (Figure 5B) and protein level (Figure 5C). Importantly, the expression of membrane proteins involved in migration, including CCR5, CCR7 (the receptor for CCL21), CXCR3, CD62L, and LFA-1 were unaffected by GW501516-induced PPARδ activation (Supplementary material online, Figure S5A). GW501516-treated Treg cells migrated more efficiently towards the inflamed peritoneum as compared to vehicle control (Figure 5D). Moreover, this effect was FA oxidation-dependent as preincubating GW501516-treated Treg cells with etomoxir (an irreversible CPT1 inhibitor) abolished it. Importantly, etomoxir did not affect Treg cell viability (Figure 5E). A transwell migration assay with CCL21 (the ligand for CCR7, whose expression was not affected by GW501516 thus allowing us to assess its metabolic effects) confirmed that GW501516-treated Treg cells displayed more potent migration, again in an FA oxidation-dependent fashion (Figure 5F). Next, as we unravelled a metabolic phenotype in WTD-Treg cells that might actually promote their migratory capacity, we assessed this in a peritoneal homing assay. Although the absolute number of migrated WTD-Treg cells was equal to NCD-fed donor derived Treg cell migration (Figure 5G), the percentage of WTD-Treg cells in the peritoneal Treg cell population was higher than NCD-Treg cells (Figure 5H). Supposedly, this was because the total number of Treg cells, which were recruited towards the inflamed peritoneum in the WTD-Treg cell-injected mice, was lower but the migratory capacity of WTD-Treg cells was higher than NCD-Treg cells. To study WTD-Treg cell migration in an atherosclerosis-specific context, we performed an in vitro aorta homing experiment using NCD- and WTD-Treg cells with or without preincubation with etomoxir. Indeed, WTD-Treg cells migrated more efficiently into atherosclerotic lesions as compared to NCD-Treg cells (Figure 5I). Here, as opposed to GW501516-treated Treg cells, the increased migratory capacity of WTD-Treg cells was only mildly affected by pre-treatment with etomoxir.
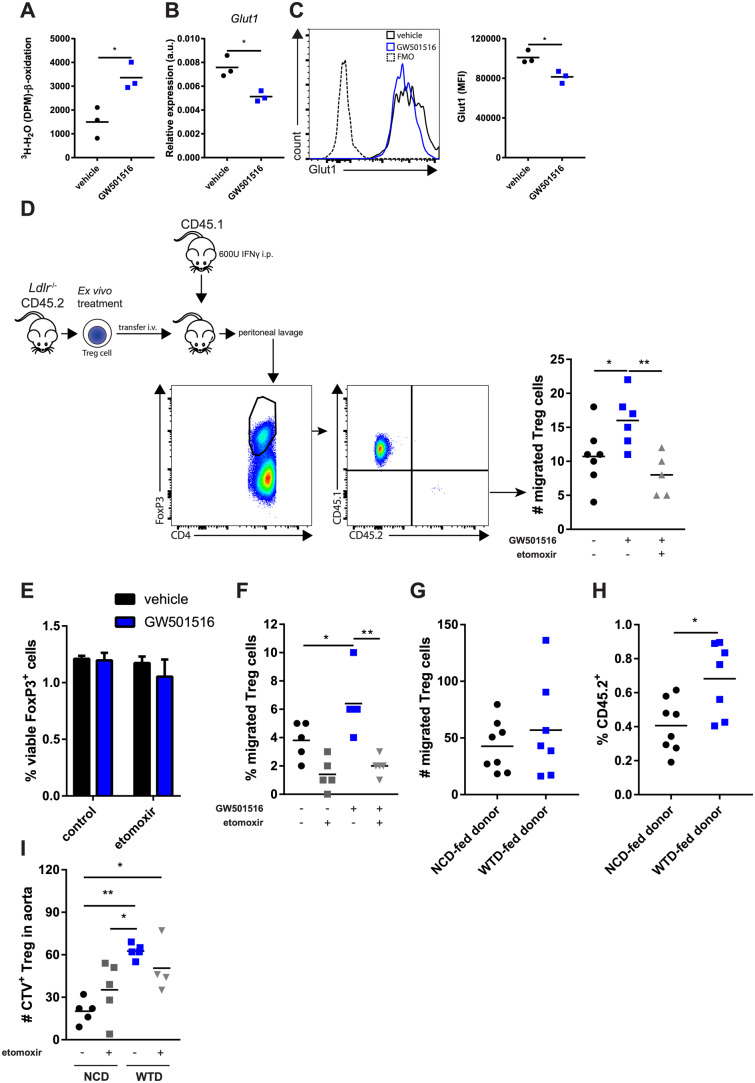
Increased FA oxidation increases Ldlr−/− Treg cell migration. (A) 3H-palmitic acid detritiation in flow-sorted Treg cells treated with GW501516 in vitro. n = 3 mice/group. (B) Glut1 mRNA expression in flow-sorted Treg cells treated with GW501516 in vitro. n = 3 mice/group. (C) Glut1 protein expression measured in Treg cells from A by flow cytometry. (D) Peritoneal homing experiment using isolated Treg cells treated with GW501516. n = 5–7 mice/group. (E) Viability of isolated Treg cells with indicated treatments. n = 3/group (mean ± standard deviation). (F) Transmigration of isolated Treg cells towards CCL21 in vitro after indicated pretreatments. n = 5 mice/group. (G) Peritoneal homing experiment of NCD- vs. WTD-Treg cells. CD4+ T cells from NCD or WTD mice were injected i.v. and the number of Treg cells retrieved from the peritoneum were normalized for the number of Treg cells present in each donor CD4+ fraction. n = 7–8 mice/group. (H) Percentage of transferred NCD- and WTD-Treg cells relative to total number of peritoneal Treg cells. n = 7–8 mice/group. (I) In vitro aortic homing assay of NCD-Treg cells vs. WTD-Treg cells with or without preincubation with 100 μM etomoxir. Treg cells were left to migrate towards atherosclerotic aortic arches from Apoe−/− mice. n = 4–5 mice/group. A–C and E and F represent data of two of three independent experiments. D represents data from two pooled experiments which showed similar effects. G–I represents data from one experiment. A two-tailed Student’s t-test and one-way ANOVA were used. *P < 0.05 and **P < 0.01.
In conclusion, these results indicate that PPARδ-induced increases in FA oxidation potentiate Treg cell migration and that WTD-Treg cells might actually migrate more efficiently towards sites of inflammation.
3.6 Diet-induced dyslipidemia increases lipids in T cells from atherosclerotic lesions of Ldlr−/− mice
Finally, we examined lipid-associated changes in Treg cells in atherosclerotic lesions. We assessed the amount of cholesterol and lipid droplets in CD4+CD25hi T cells from atherosclerotic lesions of the aortic arches of NCD- and WTD-fed Ldlr−/− mice (Figure 6A). In atherosclerotic lesions from aortic arches the amount of cholesterol (Figure 6B) and lipid droplets (Figure 6C) was, similar to the spleen and medLN, higher in CD4+CD25hi T cells from WTD-fed mice as compared to NCD-fed mice. Again, similar to WTD-Treg cells, CD4+CD25hi T cells from the atherosclerotic lesions of WTD-fed mice had increased expression of CD36 as compared to NCD controls (Figure 6D). Finally, we measured apoptosis of WTD-Treg cells as Treg cells inside atherosclerotic lesions are particularly apoptotic as atherosclerosis progresses, which is linked to dyslipidemia.6 Indeed, Treg cells were more sensitive to rotenone-induced apoptosis than Tconv cells (Supplementary material online, Figure S6).
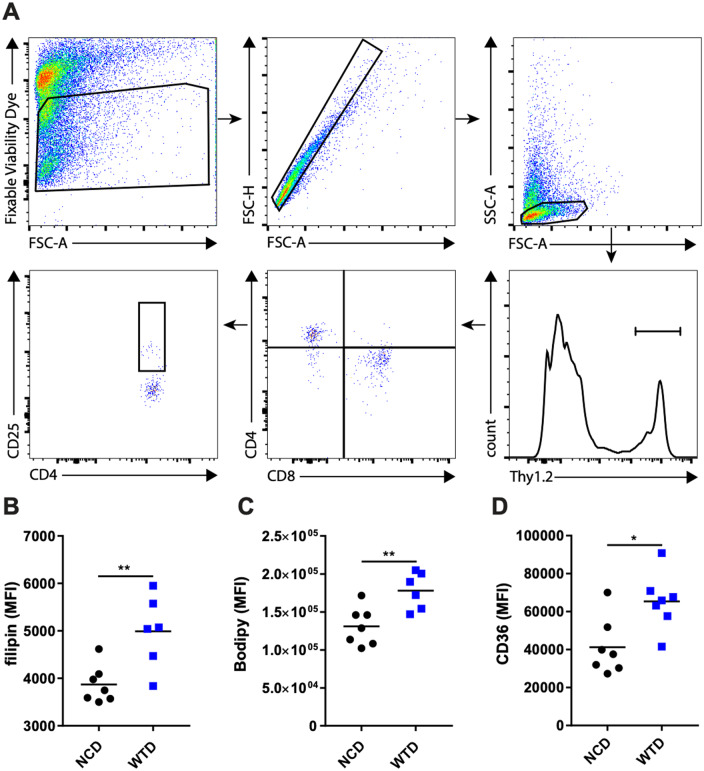
The effects of WTD-induced dyslipidemia on CD4+CD25hi T cells in atherosclerotic lesions from Ldlr−/− mice. (A) The representative gating strategy for CD4+CD25hi T cells in digested atherosclerotic lesions microdissected from the aortic arch. (B) Filipin staining in CD4+CD25hi T cells from A. n = 6–7 mice/group. (C) Bodipy staining in CD4+CD25hi T cells from A. n = 6–7 mice/group. (D) CD36 staining in CD4+CD25hi T cells from A. A two-tailed Student’s t-test was used. n = 7 mice/group. *P < 0.05, **P < 0.01. The plots in A represent an example for the applied gating strategy used in B–D, as shown in one biological sample.
4. Discussion
A decrease in Treg cells in atherosclerotic lesions is associated with the degree of dyslipidemia. We showed that Treg cells accumulate cholesterol and other neutral lipids during dyslipidemia which, through intrinsic changes in mTORC1/mTORC2 signalling and PPARδ activity, skewed their migration towards sites of inflammation instead of LNs. Pharmacological activation of PPARδ with GW501516 mimicked the effects of dyslipidemia on FA oxidation in Treg cells and increased their migration towards sites of inflammation. These findings suggest that the decrease in Treg cell immunosuppression in advanced atherosclerosis is not due to dyslipidemia-induced impairments in migratory capacity as dyslipidemia actually induced an effector-like migratory phenotype in Treg cells, by biasing migration towards sites of inflammation.
An important point to address is how Treg cell-mediated immunosuppression is decreased in atherosclerotic lesions while diet-induced dyslipidemia induces intrinsic (metabolic) changes which skews their migratory phenotype, presumably in a beneficial manner. We propose that diet-induced dyslipidemia enhances the capacity of Treg cells to migrate towards sites of inflammation but that lipid accumulation in combination with the local environment inside atherosclerotic lesions is unfavourable for Treg cells, thereby disrupting their immunosuppressive capacity. In support of this, Treg cells inside murine atherosclerotic lesions become increasingly apoptotic as lesions progress during diet-induced atherosclerosis, an effect which is counteracted by restoration of normocholesterolemia.6 The main culprit lipoprotein in atherosclerosis is the cholesterol-rich LDL particle, which becomes oxidized in the vessel wall. oxLDL can dose-dependently induce apoptosis in human Treg cells39 and has been suggested to induce apoptosis in murine Treg cells as well.9 This suggests that dyslipidemia itself contributes to a microenvironment inside lesions which is especially unfavourable for Treg cells.
Another feasible explanation for a loss of Treg cells inside lesions is that Treg cells might lose expression of FoxP3 inside atherosclerotic lesions and are therefore not identifiable as Treg cells. Indeed, oxLDL can increase methylation of the demethylated regions in the promotor of the FoxP3 gene in Treg cells from healthy subjects,40 thus decreasing FoxP3 expression. Moreover, WTD-induced atherogenesis was shown to decrease FoxP3 expression in Treg cells and induce their differentiation to follicular helper T cells, which was partly mediated by membrane cholesterol accumulation.41 These reports indicate that the inflammatory phenotype is, in part, dictated by the intracellular lipid status of CD4+ T cells.
We showed that diet-induced dyslipidemia did not affect LN migration and FA oxidation in Tconv cells, suggesting that the migratory and metabolic adaptations we observed can be Treg cell-specific. We speculate that the difference in CD36 expression between Tconv and Treg cells might explain why the latter are more sensitive to perturbations in environmental lipid levels. Nevertheless, it would be interesting to metabolically characterize Tconv cells (Thelper cell subsets) in SLOs and atherosclerotic lesions as their response to dyslipidemia will depend on the metabolic demand and differ among subsets. Data from previous reports suggest that dyslipidemia contributes to a microenvironment in lesions which is especially hostile for Treg cells, indicating that decreased immunosuppression by Treg cells in atherosclerotic lesions is likely due to local apoptosis and differentiation to T helper cell subsets but not due to decreased migration of circulating Treg cells towards lesions.
Diet-induced dyslipidemia affected Treg cells differently depending on the tissue compartment we examined. Lipoproteins in the blood can infiltrate LNs through the high-endothelial venules or the lymphatics system. Presumably, the increase in Treg cells and their lipid content in the medLN might be explained by ongoing inflammation in atherosclerotic lesions and copious amounts of (modified) lipoproteins which may drain to the medLN. Splenic Treg cells are presumably more sensitive to circulating lipids as these lipids presumably enter the spleen more easily since it is a very well-vascularized SLO. Our findings that splenic Treg cells are affected by dyslipidemia are especially relevant since this population encounters blood–borne antigens (e.g. derived from modified LDL42) and contains antigen-specific Treg cells during atherosclerosis.29 We speculate that circulating Treg cells in WTD-fed Ldlr−/− mice did not show enhanced lipid accumulation because circulating Treg cells represent a mixed population, consisting of cells recirculating between (lymphoid) tissues and the blood- and lymph compartments, and our results indicated that this phenomenon is not uniform across (lymphoid) tissues. Importantly, we did observe increased lipids in aortic Treg cells, though it is unlikely that, as opposed to the spleen, aortic CD4+CD25hi T cells predominantly represent Treg cells as these can also be activated Tconv cells.
In the spleen, dyslipidemia led to elevated cholesterol in Treg cells which decreased mTORC1 activity and led to decreased expression of genes from the mevalonate pathway. Endocytosis of lipoproteins could have resulted in large amounts of cholesterol in lysosomes which are sensed by mTORC1. Lysosomal cholesterol accumulation can specifically activate the mTORC1 complex through the SLC38A9–Niemann-Pick C1 signalling complex.43 Instead, our data suggested cholesterol overload in Treg cells decreased mTORC1 activity. This is also supported by literature describing Treg cell-specific genetic deletion of Abcg1 in mice with normolipidemia and dyslipidemia resulted in an increase in free cholesterol levels and decreased mTORC1 activity in Treg cells.12 Interestingly, a recent report described that PPARδ activation in natural killer cells can limit mTORC1-regulated glycolysis,44 suggesting that, although we presume it is the main mechanism, inhibition of mTORC1 in vivo might not be exclusively mediated by cholesterol accumulation.
Dyslipidemia increased the mitochondrial FA oxidation rate and reversion to normolipidemia through dietary intervention abolished this effect, suggesting that systemic lipid metabolism is tightly linked to cellular lipid metabolism in Treg cells. Although glycolysis and glycolytic capacity were slightly impaired, increased ATP generation through FA oxidation might have compensated for decreased glycolysis when large amounts of ATP are required for cytoskeletal actin rearrangements during cell migration.45,46 In Treg cells, glucokinase has been shown to be crucial for glycolysis-derived ATP generation to facilitate Treg cell migration upon migratory stimuli.11 In our analyses, Gck mRNA expression was undetected in the majority of WTD-Treg cells (data not shown). However, the Treg cells used in the report describing Gck to be important for Treg cell migration were primarily generated or treated in vitro meaning that these cells probably depended mainly on glycolysis for ATP generation. In support of this, in CD8+ T cells, the ECAR dose-dependently increases with the concentration of glucose in the culture medium.47 As dyslipidemia and GW501516 treatment augmented FA oxidation and migration, our study suggests that the dominant ATP-generating catabolic pathway is crucial for Treg cell migration and how bioenergetic metabolism is skewed by which environmental stimuli might determine which catabolic pathway is dominant. Pre-treatment of WTD-Treg cells with etomoxir had a smaller impact on migratory capacity than in GW501516-treated Treg cells, suggesting that WTD-Treg cells might be more flexible in switching to alternative catabolic pathways to generate ATP. Of note, the reported metabolic adaptations might coincide with a changed repertoire of chemokine receptors and/or selectin molecules beyond the ones we examined, as mTORC1 regulates many facets of T cell migration,48 thus warranting further investigation. In addition, the link between dyslipidemia-induced changes in FA metabolism and Treg cell function warrants further investigation as Treg cell function is altered by metabolic immunomodulation19 but we observed no apparent differences in immunosuppression in WTD-Treg cells. Since literature has described a WTD to have no effect6 or increase Treg cell function in vitro49 in different models of dyslipidemia this suggests a complex link between dyslipidemia, metabolism and Treg cell function.
We speculate that the concept of dietary lipids modulating Treg cell metabolism and migration is of particular interest to FH, as dyslipidemia can be quite severe in these patients. The most common germline mutations causing FH are in the LDLr, APOE, or PCSK9 gene.50 Treg cells from patients with mutations in either of the latter two have a functional LDL receptor, potentially resulting in even more lipoprotein uptake than FH patients with loss-of-function mutations in the LDLr gene. Interestingly, a recent study reporting comprehensive lipid profiling in children showed that non-statin-treated FH children have increased serum levels of DHA, linoleic acid and polyunsaturated FA as compared to non-FH children.51 This indicates that dyslipidemia in FH patients might lead to PPARδ activation in human Treg cells and that cellular metabolism might be affected through similar mechanisms as described in our study.
There are some limitations to this study. We described that dyslipidemia was associated with changes in mTORC1 and PPARδ activity in WTD-Treg cells and metabolic adaptations. However, it remains unclear whether and how these are linked and what the relative contributions of mTORC1 and PPARδ are to the dyslipidemia-induced alterations in glycolysis and FA metabolism. Using a Treg cell-specific knock-out model for Raptor to study the contribution of mTORC1 inhibition to the observed metabolic phenotype is problematic as Raptor-deficient Treg cells are metabolically distinct from wildtype Treg cells.19 The exact contribution of PPARδ in our studies can be examined in mice with Treg cell-specific PPARδ deficiency, although Treg cells from these mice might have distinct glycolytic- and FA metabolism from wildtype Treg cells without dietary intervention, possibly affecting the effect of dietary intervention.
Altogether, our observations suggest that dietary lipids can alter Treg cell metabolism and migratory function. This indicates that pharmacological intervention to increase Treg cell migration alone might not suffice to dampen atherosclerosis or other autoimmune-like diseases if the microenvironment at the site of inflammation is not suitable for Treg cells.
Supplementary material
Supplementary material is available at Cardiovascular Research online.
Authors’ contributions
J.A. and J.K. conceptualized and designed the work. J.A., F.H.S., H.D., P.J.v.S., G.H.M.v.P., B.S., A.C.F., E.M., I.B., and Y.W. acquired data for the work. J.A., E.M., A.H., T.H., H.C., I.B., and J.K. contributed to the analysis and/or interpretation of data for the work.
Conflict of interest: none declared.
Funding
This work was supported by European Union’s Seventh Framework [grant number 603131], by contributions from Academic and SME/industrial partners to H.D. and F.S. and by the Netherlands Heart Foundation [grant number 2016T008] to A.C.F. and grant number CVON2017-20. H.C. was supported by the NIH [grant numbers, AI131703, AI150241, and AI150514].
Data availability
The complete mass spectrometry lipidomics screen as reported in the study is available in the Dryad repository through https://doi.org/10.5061/dryad.70rxwdbv0.
Translational perspective
Dyslipidemia, in the form of hypercholesterolemia and hypertriglyceridemia, is a driver of atherosclerosis and cardiovascular disease (CVD). Hence, lipid-lowering therapy is a cornerstone in the treatment of CVD. In the past years, the clinical feasibility of immunotherapy to treat CVD has also been established. As regulatory T (Treg) cells are specialized in immunosuppression, these cells represent a promising target for additional immunotherapies. The presented study suggests that dyslipidemia affects the metabolism of Treg cells and their migration towards sites of inflammation, such as atherosclerotic lesions, suggesting that lipid-lowering therapy and metabolic immunotherapy might affect Treg cells through previously unidentified mechanisms.
References
1
2
3
4
5
6
7
8
9
10
11
12
13
14
15
16
17
18
19
20
21
22
23
24
25
26
27
28
29
30
31
33
34
35
36
37
38
39
40
41
42
43
44
45
46
47
48
49
50