
Contributed by Owen N. Witte, December 1, 2020 (sent for review October 26, 2020; reviewed by K. Christopher Garcia and Stephen Schoenberger)
Author contributions: P.A.N., J.M., and O.N.W. designed research; P.A.N., J.M., D.C., G.B.S., and M.B.O. performed research; P.A.N., J.M., D.C., N.J.B., C.S.S., Y.Q., Z.M., and J.W.P. analyzed data; and P.A.N., J.W.P., and O.N.W. wrote the paper.
Reviewers: K.C.G., Stanford University; and S.S., La Jolla Institute.
1Present address: Immune Education Department, Agenus, Lexington, MA 02421.
T cell receptors (TCRs) surveil cellular environment by recognizing peptides presented by the major histocompatibility complex. TCR sequencing allows for understanding the scope of T cell reactivity in health and disease. Specific TCR clones can be used as therapeutics in cancer and autoimmune disease. We present a technique that allows for TCR sequencing based on intracellular signaling molecules, such as cytokines and transcription factors. The core concept is highly generalizable and should be applicable to global gene expression analysis where intracellular marker-based cell isolation is required.
T cell receptors (TCRs) are generated by somatic recombination of V/D/J segments to produce up to 1015 unique sequences. Highly sensitive and specific techniques are required to isolate and identify the rare TCR sequences that respond to antigens of interest. Here, we describe the use of mRNA sequencing via cross-linker regulated intracellular phenotype (CLInt-Seq) for efficient recovery of antigen-specific TCRs in cells stained for combinations of intracellular proteins such as cytokines or transcription factors. This method enables high-throughput identification and isolation of low-frequency TCRs specific for any antigen. As a proof of principle, intracellular staining for TNFα and IFNγ identified cytomegalovirus (CMV)- and Epstein-Barr virus (EBV)-reactive TCRs with efficiencies similar to state-of-the-art peptide-MHC multimer methodology. In a separate experiment, regulatory T cells were profiled based on intracellular FOXP3 staining, demonstrating the ability to examine phenotypes based on transcription factors. We further optimized the intracellular staining conditions to use a chemically cleavable primary amine cross-linker compatible with current single-cell sequencing technology. CLInt-Seq for TNFα and IFNγ performed similarly to isolation with multimer staining for EBV-reactive TCRs. We anticipate CLInt-Seq will enable droplet-based single-cell mRNA analysis from any tissue where minor populations need to be isolated by intracellular markers.
The adaptive immune response depends on T cell receptor (TCR) diversity to orchestrate a defense against any foreign antigen (1, 2). The αβ TCR is a heterodimer of alpha and beta polypeptides that as a pair recognize peptides, derived from proteins, presented on the major histocompatibility (MHC) complex (3). Alpha and beta chains are generated in the thymus by random somatic recombination of the V, D, and J regions to yield a theoretical diversity of over 1015 clonotypes (3). Those TCRs that react with self-derived epitopes or do not recognize MHC are predominantly deleted during development (4). One recent estimate of adult TCR diversity in the peripheral blood is 108 unique clones (1). Isolating rare antigen-specific TCR sequences from such diverse populations remains a significant technical challenge.
Robust techniques have been developed for sequencing TCRs of immunodominant viral and tumor T cell responses (56789–10). Immunodominance is the observation that the immune response is focused on a small number of antigenic epitopes and was initially discovered when only one MHC allele allowed the immune recognition of virus-infected cells (11). Peptide-MHC multimers representing these epitopes are used for physical staining of the TCR and allow for robust and antigen-specific TCR sequencing, often via fluorescence-activated cell sorting (FACS) selection of the multimer-positive population (6, 12). Multimer-based isolation of T cells coupled with TCR sequencing revolutionized our understanding of how viral antigens produce T cell responses (13, 14). However, these reagents are epitope specific and laborious to construct and so are best suited for studying a small number of well-defined, dominant epitopes (13, 15).
More recently, surface activation markers such as CD137 and CD107a/b have been used to isolate live T cells that have been activated in vitro, allowing for isolation and sequencing of antigen-specific TCRs without multimer staining (5, 8). These activation marker techniques permit isolation of TCRs reactive with previously undefined epitopes (8, 10). The activation marker CD137 has been used for isolation of novel tumor-associated, as well as neoantigen-reactive TCRs (8, 10). Once cells are isolated, single-cell sequencing can produce TCR alpha/beta pair identity of thousands of cells (1617–18). Cell surface markers like CD137 are used as proxies for the intracellular effector molecules that respond to T cell activation and can return a false positive signal. These surface activation markers are expressed on up to 0.5% of CD8+ T cells in absence of TCR stimulation. This background expression could make it difficult to specifically identify low-frequency responses. Yet many therapeutic T cell responses to viruses and tumors are against undefined, low-frequency epitopes.
We sought to establish an mRNA sequencing protocol that could characterize low-frequency T cell populations of defined phenotype and function. We surmised that a method based on intracellular protein profiling could provide the desired additional specificity. Such a method would allow targeting of any protein, including cell type-defining signaling molecules and transcription factors. Transcription factors (TFs), alone or in combination, are lineage-defining molecules and have been shown necessary and sufficient for cell differentiation and identity in many contexts (19202122–23). For example, in the neuronal lineage, the TFs SOX2, PAX6, and EOMES identify human radial glia progenitors (24). In T cells, our area of interest, FOXP3 uniquely marks T regulatory cells (Tregs), which can oppose cytotoxic T cell responses and either prevent destruction of healthy tissue or promote tumor progression (25262728–29). Another CD4+ cell type involved in tissue homeostasis is Th17 cells, which produce IL-17 and protect organs from bacteria, but can also mediate autoimmune pathology in an IFNγ-independent manner (30). The RORγt transcription factor directs differentiation and identifies Th17 cells (30, 31).
Antigen-specific CD4+ and CD8+ T cells are often quantified by their intracellular cytokine production capacity (3233–34). Cytokine secretion is first inhibited and subsequently cells are permeabilized for cytoplasmic cytokine staining (3334–35) and flow cytometric analysis. Epitope mapping studies have used intracellular staining (ICS) as a measurement of reactivity and established the antigen scalability of this approach (32, 33, 36). This technique has very low background, in the absence of stimulation through the TCR (35, 37). Different antigen stimulation approaches can be combined with ICS and exact epitope knowledge is not required (36, 38). For discovery purposes, pools of over 100 peptides can be routinely used (33, 36, 39, 40).
Single-cell sequencing of neuronal cells selected based on an intracellular antigen has been described; however, that technology has not been performed with the droplet-based sequencing required to rapidly process reactive TCRs (24). More recently, methanol-based permeabilization has been used to select a population of cells based on an intracellular marker for droplet-based sequencing (41). In this work, we define a technology for droplet-based mRNA sequencing in cells fixed and permeabilized for ICS. This technology, CLInt-Seq (sequencing via cross-linker-regulated intracellular phenotype), performs similarly to multimer-based approaches but can be used to discover new peptide-TCR pairs. As proof of principle, we used CLInt-Seq to sequence TCRs in Epstein-Barr virus (EBV)-reactive CD8+ T cells selected for TNFα and IFNγ expression. For comparison, selection with multimers was performed in parallel and had comparable efficiency. We also demonstrate that the technology can be applied to sequence Treg cells by profiling the lineage-specific transcription factor, FOXP3. Finally, we adapt the method to be compatible with a single-cell sequencing platform that allows comprehensive profiling of the αβ TCR response.
To compare the specificity of surface activation markers and ICS for the identification of reactive T cells, we tested the ability of both techniques to identify true positive antigen-specific T cells in an activation assay. Tissue-restricted antigen NY-ESO-1, which is overexpressed in multiple tumors, and a cognate TCR (clone 1G4) colinked to NGFR were used to create a model system for estimating the specificity of the ICS approach compared to the CD137 method (12, 42, 43). False positives were defined by flow cytometry as events that expressed an activation marker but not the TCR construct. To produce a simulated population that is about 1% positive, a TCR-transduced population was added into an untransduced population of cells (Fig. 1A). Cells were then stimulated and flow cytometry was performed for CD137 and compared to ICS for TNFα or IFNγ (Fig. 1B). Both assays had comparable sensitivity. However, 3.09% of CD8+ T cells were in the NGFR−/CD137+ quadrant (Fig. 1B), illustrating a high background in this assay due to either constitutive low-level expression or bystander T cell activation. However, only 0.08% and 0.13% of CD8+ T cells were in the NGFR−/TNFα+ or NGFR−/IFNγ+ compartments, respectively (Fig. 1B). In this model system ICS provided greater specificity than CD137 staining.

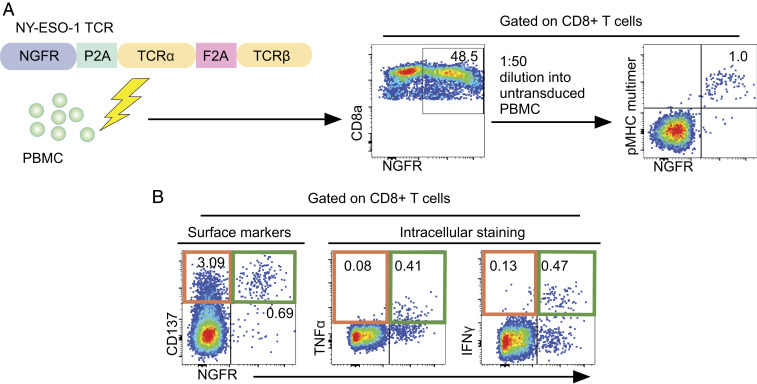
Intracellular staining identifies antigen-specific T cells with a lower rate of false positives than cell surface profiling by the activation marker CD137. (A) Schematic for experimental design to compare antigen-specific activation to bystander T cell activation. Donor PBMCs are transduced with a NY-ESO TCR (clone 1G4) construct. Resultant populations are diluted into an untransduced population of cells that was treated similarly. Dilution is confirmed by FACS analysis for tetramer staining and secondary transduction marker NGFR. (B) FACS analysis of CD137 up-regulation and intracellular staining for IFNγ and TNFα after peptide stimulation.
Anticipating that TCR mRNA sequencing would be less robust from fixed and permeabilized cells, we overexpressed melanoma antigen MART-1 TCR (clone F5) in peripheral blood mononuclear cells (PBMCs) to test if TCRs could be sequenced from IC-stained T cells with a high level of target mRNA (12, 44). Cells were then activated with MART-1 peptide and stained for intracellular TNFα and IFNγ by adapting a published method of single-cell mRNA sequencing in permeabilized cells that used paraformaldehyde (PFA) as a cross-linker (24). In parallel, a control arm was set up where cells were selected with MART-1 multimer. Reactive cells were then singly deposited by FACS for alpha/beta-paired TCR sequencing (SI Appendix, Fig. S1). TCR clones were isolated from single-cell RT-PCR reactions. Both techniques had equivalent efficiency, measured as a fraction of TCR alpha/beta pairs recovered (75%). This proof-of-concept experiment demonstrated single-cell TCR mRNA could be sequenced from cells that were stained for intracellular antigens.
Having shown ability to sequence TCRs in the setting of overexpression, we sought to measure antigen-specific TCR recovery in a population of normal human PBMCs. As a proof of concept, virus-specific T cell responses from two different donors were profiled. Cytomegalovirus (CMV) and EBV are common herpes viruses that infect over 50% of people and generate large memory T cell responses (45). Virus-specific CD8+ T cells were singly deposited based on TNFα and IFNγ expression into RT-PCR wells and TCRs were subsequently sequenced (Fig. 2B). As a control, we also sorted and sequenced cells based on CD137 production and multimer staining (Fig. 2B).
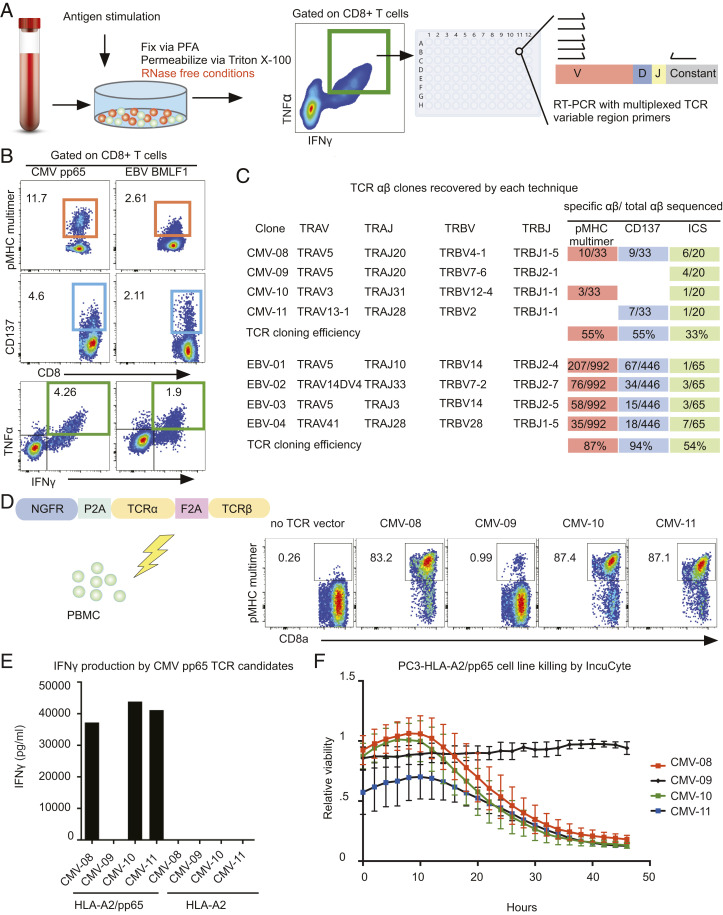
TCR alpha/beta pairs can be recovered from primary T cells after intracellular staining with efficiency equivalent to multimer-based selection. (A) Schematic for TCR mRNA sequencing postintracellular staining of primary human T cells. Human PBMCs were cultured for 9 d, allowed to rest for 12 h, and then intracellular staining was performed. Cytokine-producing cells were selected by FACS and single-cell deposited into 96-well plates for TCR mRNA alpha and beta chain sequencing. (B) FACS analysis of antigen-specific T cells identified by pMHC multimer staining, CD137 staining, or intracellular staining. PBMCs were either stimulated with peptide or stained with tetramer carrying the cognate peptide: CMV pp65 HLA-A2 (NLVPMVATV), EBV BMLF1 (GLCTLVAML). Cells that were responsive (colored box) were isolated by FACS. (C) Summary table of TCR clones recovered by each technique and frequency of recovery within each technique. CD137 and tetramer selected cells of the EBV+ subject were analyzed by 10× Genomics. Cloning efficiency was compared between the three techniques, defined by frequency of successful recovery of paired TCR alpha and beta chains. (D) Schematic for TCR functional testing in healthy donor PBMCs. CMV-reactive TCRs were overexpressed in healthy PBMCs and expression was measured by FACS analysis for multimer binding: CMV pp65 (NLVPMVATV). (E) TCR-transduced PBMCs were stimulated with PC3 cells engineered to express HLA-A2 with or without CMV pp65. Cell supernatants were collected 48 h after coculture and secreted IFNγ quantified by ELISA. (F) Cytotoxicity of CMV-specific TCRs was evaluated by coculturing TCR-transduced T cells with GFP+ PC3 cells expressing HLA-A2 and CMV pp65. Relative viability was measured by GFP fluorescence using the Incucyte system. Test tube image credit: Adobe Stock/happyvector071. Plate image credit: Adobe Stock/greenvector.
All three techniques (ICS, multimer staining, and CD137 staining) recovered clonal TCRs (Fig. 2C). Although the CMV response was oligoclonal, some clones were clearly dominant. In fact, the same dominant clone appeared in all three techniques. In contrast, the EBV-responding TCRs were polyclonal, which is typical of EBV responses. The dominant EBV clone identified by tetramer and CD137 staining appeared only once in ICS; however, the subdominant clones appeared 3/55 and 7/55 times as measured by ICS. Cumulatively, these data showed that ICS could enable the isolation and sequencing of TCRs in single cells. This experiment also showed that ICS can be used for TCR cloning with reasonable efficiency, 33 to 54% compared to 55 to 94% with live cells (Fig. 2C).
The true test for TCR antigen specificity is clonal sequence isolation and transplantation into allogeneic human T cells. This tests if an assay will identify high-affinity TCRs, rather than simply cross-reactive clones. Four CMV TCR clones were cloned into retroviral vectors and overexpressed in human PBMCs (Fig. 2D) (Dataset S1). Functional capability of these clones was evaluated by cytokine production in a cytotoxicity assay. T cells transduced with the CMV TCRs were cocultured with a PC3 epithelial prostate cancer cell line that expressed HLA-A*02:01 with or without the CMV pp65 protein. All three CMV TCRs that appeared in both tetramer and ICS-based selection led to the production of IFNγ when T cells were cocultured with target cells that express CMV pp65 protein (Fig. 2E). Additionally, these same T cells were able to specifically kill target cells that expressed the protein (Fig. 2F).
To explore the ability of ICS-based TCR sequencing to characterize immune responses beyond those mediated by cytotoxic CD8+ T cells, we performed single-cell sequencing of T cells that expressed the classic Treg markers: CD3, CD4, CD25, and FOXP3 (Fig. 3A) (46). Knowledge of Treg epitopes has been limited to indirect analyses due to the need to phenotype Tregs exclusively by nuclear transcription factor FOXP3 (47). Our ICS-based cloning efficiently isolated TCRs in this population, as 33 out of 40 single cells deposited returned productive alpha/beta pairs (83%) (Fig. 3A). A specific peptide was not queried, thus the TCRs identified did not show any clonality, unlike the viral antigen-specific CD8+ T cells analyzed previously (Fig. 3B). Thus, ICS-based selection can identify TCRs across T cell phenotypes and functionalities.
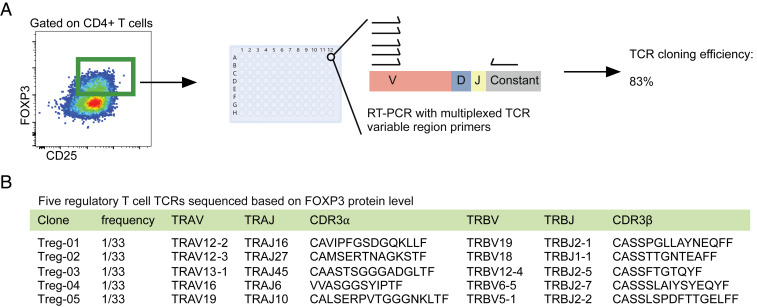
T regulatory cell TCR identification by intranuclear profiling of FOXP3. (A) FOXP3 intracellular staining and subsequent single-cell TCR sequencing in Treg cells. CD4+ PBMCs were expanded in vitro for 9 d and then stained for surface antigens (CD3, CD4, CD8, and CD25), fixed and permeabilized, and stained for FOXP3. Single Treg cells (CD3+, CD4+, CD8−, CD25+, and FOXP3+) were FACS deposited into 96-well plates and RT-PCR was performed for TCR sequencing. Cloning efficiency was reported as frequency of successful recovery of full-length TCR alpha and beta pairs. (B) Analysis was performed on 40 cells and 33 alpha/beta TCR pairs were generated. Five of the TCRs sequenced are shown. Plate image credit: Adobe Stock/greenvector.
Very large TCR diversity as well as clonal expansion necessitates sequencing of hundreds of cells to understand the scope of reactivity. Current techniques for parallel single-cell sequencing in thousands of cells are based on microfluidics technology, which encapsulates cells into fluid droplets (48). In our hands, PFA fixed cells performed poorly with a droplet-based sequencing approach (Fig. 4B). As an alternative, we optimized the protocol with a chemically reversible cross-linker, DSP [Lomant’s reagent, 3,3′-dithiodipropionic acid di(N-hydroxysuccinimide ester)] (SI Appendix, Fig. S2) (49). DSP reacts with primary amines, has a disulfide bond in the center, and can be cleaved via a reducing agent. This reagent has also been used to preserve cells prior to sequencing, as well as for sequencing of permeabilized cells selected by phosphoprotein, but neither example was adapted for droplet-based sequencing (50, 51).
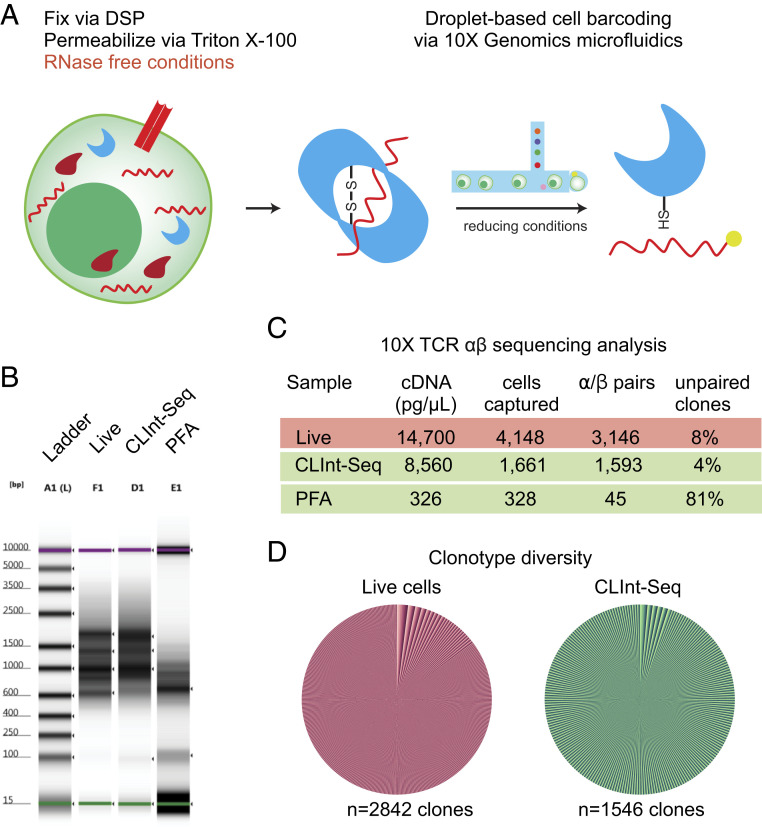
Single-cell sequencing of fixed and permeabilized cells in droplet-based format. (A) Schematic for capture of cellular mRNA in cellular protein mass via DSP. The reducing reagents present in the drop-seq fluidics allow the liberation of mRNA and subsequent RT-PCR. (B) Electrophoresis analysis of cDNA libraries. Activated human PBMCs and Jurkat cells were mixed at 5:1 ratio, subsequently fixed with DSP, and permeabilized with Triton X-100. Treated cells were then submitted for 10× Genomics TCR V(D)J sequencing. Separate samples of live and PFA permeabilized cells were processed in the same run as positive and negative controls. (C) TCR clone metadata analysis after next generation sequencing. (D) Pie chart analysis of TCR diversity of all paired clones reported in the Loupe VDJ browser (10× Genomics).
CLInt-Seq was used to sequence αβ TCRs in a bulk T cell population via the 10× Genomics V(D)J library construction protocol (Fig. 4A). Live cells and PFA-fixed cells were included for comparison. The cDNA profile of CLInt-Seq processed cells was comparable to live cells, but PFA-treated cells had a poor cDNA profile (Fig. 4B). Subsequently, these samples were sequenced and single-cell data analyzed (Fig. 4C). CLInt-Seq cells performed similarly to a live cell control in terms of library cDNA concentration and number of cells successfully sequenced. The proportion of clones with both alpha and beta chains is indicative of the sample quality. CLInt-Seq cells contained only 4% of unpaired clones, compared to 8% in live cells. The PFA cross-linking yielded 81% of unpaired clones. The diversity of live and CLInt-Seq T cells was similar (Fig. 4D). Thus, gene expression analysis via droplet-based sequencing can be performed in permeabilized cells, fixed via DSP cross-linking.
It is critical that mRNA remains fixed to cellular protein mass prior to single-cell droplet encapsulation. If the mRNA is released prior to a cell being encapsulated into a fluid droplet, then mRNA cellular origin will not be identified correctly and αβ pairing will be lost. This can be estimated by recovery of correctly paired TCR αβ clones. A population of CLInt-Seq processed, EBV-specific CD8+ T cells was selected by IFNγ and TNFα expression and sequenced with the 10× V(D)J single-cell protocol (Fig. 5A). The resulting clonotypes were compared to those derived from live, tetramer-selected cells. Both CLInt-Seq processed cells and live cells returned a similar number of cells captured (Fig. 5B). Live cells showed greater recovery of αβ pairs (992 pairs vs. 430 pairs), as well as a lower frequency of unpaired clones (21% compared to 37%, Fig. 5B). To determine if mRNA identity had been maintained, we compared clonotypes recovered by CLInt-Seq to tetramer-selected live cells. The two clonotype populations overlapped significantly, indicating that TCR mRNA can be faithfully recovered from single cells prepared in this manner (Fig. 5C). The shared TCRs also represented a diversity of clonotype frequencies (Fig. 5D). This indicated that mRNA cellular origin is maintained when cells are processed per the CLInt-Seq protocol.
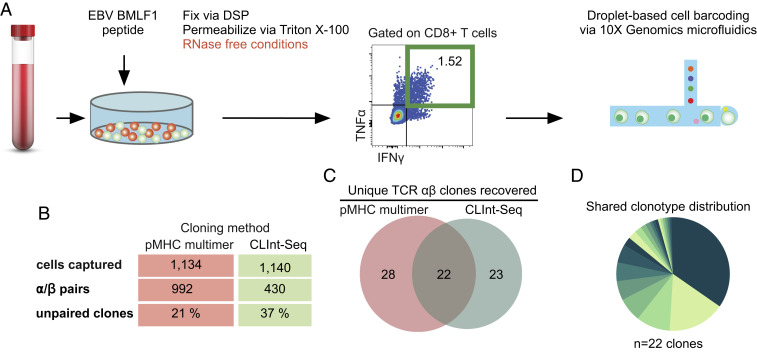
CLint-Seq coupled to droplet-based sequencing recovers EBV-specific TCRs. (A) Human PBMCs were cocultured with EBV 9mer epitope (GLCTLVAML), then restimulated in the presence of EBV peptide and Brefeldin A, and subsequently stained for TNFα and IFNγ cytokines. DSP was used as a cross-linker. Responding cells were FACS sorted into a 2-mL Eppendorf tube and submitted for 10× Genomics V(D)J analysis. (B) Metadata for the 10× Genomics TCR sequencing done using CLInt-Seq as well as a historical control generated with tetramer selection. (C) Venn diagram of EBV clonotypes generated by CLInt-Seq and multimer selection, filtered for clones with alpha/beta pair and frequency of two or more. (D) Pie chart showing frequency distribution of clonotypes that were found by both techniques. Test tube image credit: Adobe Stock/happyvector071.
We describe a technology for high-throughput mRNA sequencing at the single-cell level in cells that have been fixed and permeabilized to allow for intracellular staining. Primary amines of protein are cross-linked by DSP, a homobifunctional and cleavable cross-linker, which fixes the RNA inside the cell. Encapsulation of single cells into fluid droplets by the droplet-based cell barcoding, allows for DSP cleaving and release of mRNA for the reverse transcription reaction. This technology can be generalized for any cell type for profiling gene expression in minor populations of cells that cannot be selected by a set of surface markers. As an example, cells could be selected based on expression of one or more transcription factors, which function cooperatively to define cell fate and function. In the lymphocyte lineage, this technology could be used to clone B cell receptors for antibody development. B cells can be identified via activation assays and intracellular activation marker staining. Once the B cell receptor is engaged, the phosphorylated form of Bruton’s tyrosine kinase is generated and could possibly be used as a marker of antigen-specific B cells (52). Multiomics techniques for parallel measurement of gene expression and protein abundance have been described; however, thus far, they have been limited to the cell surface proteome (53, 54). These techniques use antibody-oligo complexes that allow oligo barcode sequencing in parallel with cellular mRNA, to quantify protein abundance. Staining for intracellular antigens would allow for such analysis without the cell surface proteome limitation.
In future work in T cells, CLInt-Seq could help improve our understanding of the T cell response to diverse antigens. Currently, only three viruses dominate the landscape of known TCR-epitope reactivities. Of the 193 unique, well-described TCR-epitope reactivities in the published literature, 100 of them are derived from CMV, EBV, or HIV (55). Insights gained are extrapolated to other self or viral antigens and systems, but no two TCR-epitope reactivities are identical (5657–58). The uniqueness of each TCR reactivity is illustrated in systems where a large effort has been made in defining and characterizing the T cell response, such as HIV. A rare subset of HIV-positive individuals, termed elite controllers, keep viral load low for decades presumably by the CD8+ T cell activity directed against a specific HLA allele, B*57 (57, 59, 60). Subdominant, low frequency HLA-B*57-restricted TCRs are particularly shown to have strong effector activity, by suppressing viral replication (57). Less is known about T cell responses to nonviral antigens; however, existing data suggest that specific TCR reactivities can determine physiological outcomes. Type 1 diabetes is characterized by progressive loss of insulin-producing beta cells of the pancreas (56). This loss is mediated by CD4+ and CD8+ T cells that recognize self-antigen with low affinity (56, 6162–63). CD4+ T cell reactivity against beta cells has been shown to be mediated by recognition of peptide fusions (61). Both HIV and diabetes, as an example of self-tissue destruction by T cells that somehow escaped deletion in the thymus, exemplify the need to study specific TCR-epitope pairs, to be able to answer specific questions in health and disease. CLInt-Seq allows stimulation of T cells with over 100 epitopes in parallel and recovers low-frequency, antigen-specific TCRs that could rapidly expand the systematic study of TCR-epitope interactions beyond these viral responses (32, 36).
Rather than focusing on specific antigen reactivities, CLInt-Seq can be used to characterize TCRs in T cell subpopulations with critical roles in immune response. For example, antigen-specific tumor infiltrating lymphocytes (TILs) are found inside the CD39/CD103 compartment (64). However, identifying strongly reactive, antitumor TILs remains a challenge. T cells are a dynamic lineage, where differentiation and activation events are directed by groups of transcription factors (65). Nur77 has been shown to be up-regulated upon TCR engagement and signaling, and in fact functions as a rheostat to indicate TCR signaling strength (66, 67). More recently, the Nur77 family of transcription factors has been implicated in T cell exhaustion, which further confirms its role in T cell receptor signaling (68). CLInt-Seq staining for nuclear transcription factor expression could help identify cancer-specific CD4+ and CD8+ T cells in the tumor microenvironment (66, 67).
We anticipate that CLInt-Seq will speed the identification of candidate therapeutic TCRs immediately suitable for preclinical development. As single-cell TCR sequencing maintains alpha/beta pairing of receptors, the reconstructed TCR sequences can be readily tested as potential adoptive T cell transfer-based therapeutics (42, 44, 69). Adoptive cell therapy involves the infusion of laboratory-modified T cells that can recognize tumor, viral, or self-antigens (42, 43). CLInt-Seq readily identified TCRs reactive to EBV and could be used to discover TCRs reactive to any antigen of interest, including cancer antigens like NY-ESO-1 (43). In our group, we are pursuing multiple projects to develop TCR reagents for treatment of prostate cancer. We have applied CLInt-Seq to identify TCRs reactive with peptide epitopes of prostatic acid phosphatase, which has been pursued by multiple groups as an immunotherapeutic target in prostate cancer (707172–73). Prior work on this target resulted in an FDA-approved cellular therapy for prostate cancer, Sipuleucel-T (73). Analogously, Treg TCR profiling using CLInt-Seq can query antigen-specific TCRs for possible use with Treg adoptive cell therapy to direct an immunosuppressive response (46).
Methods on cell culture, cell sorting, TCR cloning from 96-well plates, TCR vector construction, virus generation, and cytotoxicity testing were adapted from our prior publications and are available in SI Appendix.
PBMCs were washed two times with phosphate-buffered saline (PBS) (Fisher Scientific, cat. no. MT-46013CM) and once with TCRPMI (RPMI 1640 [Thermo Fisher, cat. no. 31800089 supplemented with 10% fetal bovine serum (Omega Scientific, cat. no. FB-11), 1× Glutamax (Thermo Fisher, cat. no. 35050061), 1× sodium pyruvate (Thermo Fisher, cat. no. 11360070), 10 mM Hepes (Thermo Fisher, cat. no. 15630130), 1× nonessential amino acids (Thermo Fisher, cat. no.11140050) and 50 μM β-mercaptoethanol (Sigma-Aldrich, cat. no. M3148]). Then cells were resuspended in TCRPMI at 500,000 cells/100 µL of media and aliquoted into 96-well plates (Corning, cat. no. 353077) for a 12-h rest prior to intracellular staining stimulation. Then, 100 µL of TCRPMI with 20 µg/mL of peptide and 2 µg/mL of CD28/49d antibodies (BD, cat. no. 347690) were added to each well. AIM V complete media (Thermo Fisher, cat. no. 12055083) was used for the TCR overexpression experiment. Cells were incubated for 1 h at 37 °C 5% CO2 and 20 µL of 10× Brefeldin A (Biolegend, cat. no. 420601) was added to each well. Cells were further incubated for 8 h. For TCR sequencing cells were stained immediately under RNase-free conditions with the FRISCR (fixed and recovered intact single cell RNA) protocol adapted from ref. 24. Briefly each well was washed twice with 200 µL of wash buffer, which contains nuclease-free water (Thermo Fisher, cat. no. 4387936), 10× molecular biology grade PBS, 1% nuclease-free bovine serum albumin (BSA) (Gemini, cat. no. 700-106P), and 1:400 RNAsin Plus (Promega, cat. no. N2615). For TCR overexpression and subsequent sequencing experiment we used RNAsin Plus at 1:40,000 dilution. The cells were stained with the following surface antibodies: CD3-APCCy7 (Thermo Fisher, cat. no. 47-0036-42), CD8a-PE (Thermo Fisher, cat. no. 12-0088-42), and CD4-PECy7 (Biolegend, cat. no. 300512). After staining for 15 min at 4 °C, cells were washed with wash buffer and fixed with 100 µL of 4% PFA (EMS, cat. no. 15710) for 10 min at 4 °C. Then cells are washed twice and resuspended in 1% BSA buffer with 0.1% Triton X-100 (Sigma-Aldrich, cat. no. T8787) for 10 min. Cells were then washed and subsequently stained with intracellular antibodies in wash buffer for IFNγ-APC (Biolegend, cat. no. 506510), TNFα-FITC (Biolegend, cat. no. 502906), FoxP3-A488 (Biolegend, cat. no. 320012), and msIgG1-A488 (Thermo Fisher, cat. no. MG120). Cells were then washed and resuspended in wash buffer for FACS analysis. Intracellular staining where we did not plan to do TCR sequencing was done in the absence of RNAsin Plus inhibitor.
All buffers except the cross-linker step contained 1:400 RNAsin and molecular biology grade PBS to inhibit RNA degradation. Staining was performed in a 96-well U-bottom plate. Cells were first washed twice in 200 µL of 1% BSA buffer with 1:400 RNAsin (wash buffer) and incubated for 15 min on ice with antibodies against surface antigens. DSP (Thermo Fisher, cat. no. 22585) was stored at −20 °C in a desiccant-filled container. Immediately prior to the experiment, DSP was left at room temperature for at least 30 min and then prepared to a concentration of 50 mg/mL in molecular biology grade dimethyl sulfoxide (Sigma, cat. no. D8418-50ML). Then, 1 mg/mL solution was prepared in molecular biology grade PBS, by vortexing 20 μL of DSP in a 15-mL conical tube and adding 1 mL of PBS with a P1000 pipette. DSP was filtered using a 40-μm Flowmi strainer (Sigma, cat. no. BAH136800040-50EA). Then 0.25 mg/mL solution was prepared. Cells were washed once with wash buffer and twice with PBS and resuspended in 200 µL of 0.25 mg/mL DSP (Thermo Fisher). Cells were incubated at room temperature for 30 min and quenched with 20 mM Tris (Thermo Fisher, cat. no. AM9850G). Cells were then washed twice and incubated for 10 min with 100 µL of 0.05% Triton X-100 (Thermo Fisher) in wash buffer. Subsequently, cells were washed and resuspended in wash buffer for 20 min with antibodies against intracellular antigens. Then, cells were washed again and resuspended in wash buffer for FACS sorting.
FACS-isolated cells were collected in a 2-mL Eppendorf tube that contained 400 μL of 0.04% BSA with 1:400 RNAsin. Cells were pelleted at 750 × g for 3 min. Supernatant was discarded leaving 30 to 60 µL, to reach a final concentration of more than 100 cells/µL. When we knew we could not get enough antigen-specific T cells, we added Jurkat E6.1 carrier cells. The 10× Genomics human V(D)J libraries were prepared by the UCLA Technology Center for Genomics and Bioinformatics following the standard protocol for 10× library construction. Single-cell TCR libraries were sequenced by Illumina MiSeq or NextSeq. Data were analyzed by using the 10× Genomics pipeline to generate Vloupe files.
PBMCs for TCR profiling were cultured in TCRPMI as described above and reported previously (12). For TCR overexpression experiments we used AIM V media. PBMCs were washed with PBS two times and once with media, subsequently resuspended at 5 × 10⁵ cells/100 µL and aliquoted in a 96-well plate for a 12-h rest. Then, cells were stimulated with 20 µg/mL of antigenic peptide and 2 µg/mL of CD28/49d in 100 µL of media for 24 h. PBMCs were then washed with wash buffer as described above, but RNAsin Plus inhibitor was excluded. PBMCs were then stained with CD3-APCCy7 (Thermo Fisher, cat. no. 47-0036-42), CD8a-PE (Thermo Fisher, cat. no. 12-0088-42), CD4-PECy7, and CD137-APC (Biolegend, cat. no. 309810) antibody for 20 min. Subsequently, cells were washed, resuspended in wash buffer and 7-aminoactinomycin D (7-AAD) (BD, cat. no. 559925) or DAPI was added immediately prior to FACS analysis or sorting. Multimer staining was performed with tetramers as previously described, and MART-1 (ELAGIGILTV) HLA-A2 tetramer was made in-house (12). Tetramers for NY-ESO-1 (MBL, cat. no. TB-M011-1), CMV pp65 (MBL, cat. no. TB-0010-2), and EBV BMLF1 (MBL, cat. no. TB-M011-2) were purchased.
We thank Lili Yang, Maureen Su, and Cristina Puig-Saus (UCLA) for providing advice throughout this project. PBMC samples used for analyzing T cell response to CMV were provided by Begonya Comin-Anduix and Theodore Nowicki both of the Antoni Ribas laboratory (UCLA). This project was supported by funds awarded to O.N.W. by the National Cancer Institute (Grant U01 CA233074), Parker Institute for Cancer Immunotherapy (Grant 20163828), and the UCLA Broad Stem Cell Research Center (BSCRC). P.A.N. is a predoctoral fellow supported by the UCLA Tumor Immunology Training Grant (US Department of Health and Human Services Ruth L. Kirschstein Institutional National Research Service Award T32 CA009056). Z.M. is supported by UCLA BSCRC predoctoral fellowship. Healthy donor PBMCs were provided by the UCLA Center for AIDS Research Virology core at UCLA supported by the NIH (5P30 AI028697).
The data discussed in this publication have been deposited in NCBI’s Gene Expression Omnibus (74) and are accessible through GEO series accession no. GSE159927.
1
2
4
5
6
7
8
9
10
11
12
13
14
15
16
17
18
19
20
22
23
24
25
26
27
28
29
30
31
32
33
34
35
36
37
38
39
40
41
42
43
44
45
46
47
48
49
50
51
52
53
54
55
56
57
58
59
60
61
62
63
64
65
66
67
68
69
70
71
72
73
 Droplet-based mRNA sequencing of fixed and permeabilized cells by CLInt-seq allows for antigen-specific TCR cloning
 Facebook
 Twitter
 Linkedin
 Whatsapp

