
Edited by Pasko Rakic, Yale University, New Haven, CT, and approved December 17, 2020 (received for review September 20, 2020)
Author contributions: G.U., G.P., E.A.C., B.D.G., R.C.K., J.H.G., and D.R.W. designed research; G.U., G.P., B.W.L., Q.C., E.A.C., B.D.G., M.A.S., R.C.K., J.H.G., and D.R.W. performed research; Q.C. and M.A.S. contributed new reagents/analytic tools; G.U., G.P., B.W.L., Q.C., K.X., and M.A.S. analyzed data; and G.U., G.P., and D.R.W. wrote the paper.
1G.U. and G.P. contributed equally to this work.
Environmental and genetic risk factors, and the early antecedents of schizophrenia, represent pieces of a puzzle still far from completion. We show that, in infants with a history of prenatal complications, a measure of genomic risk for schizophrenia linked with placental gene expression is associated with early neurodevelopmental trajectories of risk, particularly in male individuals. While the majority of individuals on this altered neurodevelopmental path likely “canalize” back toward normal development, some may not be rescued and instead “decanalize” toward illness. Specific strategies of prevention may benefit from understanding the unique placental effects of schizophrenia genomic risk and from defining which factors contribute to decanalize the neurodevelopmental trajectories of individuals with a history of risk factors who develop schizophrenia.
Tracing the early paths leading to developmental disorders is critical for prevention. In previous work, we detected an interaction between genomic risk scores for schizophrenia (GRSs) and early-life complications (ELCs), so that the liability of the disorder explained by genomic risk was higher in the presence of a history of ELCs, compared with its absence. This interaction was specifically driven by loci harboring genes highly expressed in placentae from normal and complicated pregnancies [G. Ursini et al., Nat. Med. 24, 792–801 (2018)]. Here, we analyze whether fractionated genomic risk scores for schizophrenia and other developmental disorders and traits, based on placental gene-expression loci (PlacGRSs), are linked with early neurodevelopmental outcomes in individuals with a history of ELCs. We found that schizophrenia’s PlacGRSs are negatively associated with neonatal brain volume in singletons and offspring of multiple pregnancies and, in singletons, with cognitive development at 1 y and, less strongly, at 2 y, when cognitive scores become more sensitive to other factors. These negative associations are stronger in males, found only with GRSs fractionated by placental gene expression, and not found in PlacGRSs for other developmental disorders and traits. The relationship of PlacGRSs with brain volume persists as an anlage of placenta biology in adults with schizophrenia, again selectively in males. Higher placental genomic risk for schizophrenia, in the presence of ELCs and particularly in males, alters early brain growth and function, defining a potentially reversible neurodevelopmental path of risk that may be unique to schizophrenia.
Understanding the deviations from normal trajectories of brain development may be crucial for predicting illness and for prevention. Epidemiological studies have consistently identified early antecedents, including complications during pregnancy (123–4) and delays in developmental milestones (567–8). The incidence of many developmental disorders tends to be higher in males (9), and risk is typically highly heritable (10). While rare and moderately penetrant genetic variations account for a minority of cases, genome-wide association studies (GWASs) show that most risk is attributable to common variants across the genome (11, 12). Genomic risk scores (GRSs) from GWASs allow a much greater prediction of liability of the disorder than single common variant genotypes, but GRSs per se are not useful in predicting individual risk (13).
We previously identified an environmental context in early life in which genomic risk for schizophrenia may enhance disease susceptibility (14). We found that the liability of schizophrenia explained by genomic risk (that is, schizophrenia GRS, also referred to as polygenic risk score; PRS) was more than five times higher in individuals with a history of obstetrical complications (here, early-life complications; ELCs; i.e., during pregnancy, at labor/delivery, and early in neonatal life) compared with its absence (14). Such interaction was exclusive of the GRSs constructed from the loci with the most significant associations with schizophrenia (GRS1: GWAS P < 5 × 10⁻⁸; GRS2: GWAS P < 1 × 10⁻⁶). Genes in the GRS1 and GRS2 loci were more highly expressed in placental tissue compared with genes in GWAS loci not interacting with ELCs (GRS3 to 10); they were up-regulated in placentae from complicated pregnancies and strongly correlated within placenta with expression of immune response genes (14), consistent with previous evidence linking placenta, inflammation, and brain development (15, 16).
To investigate the role of placenta biology in the interaction between schizophrenia GRSs and ELCs, we derived sets of GRSs based on single-nucleotide polymorphisms (SNPs) marking schizophrenia-GWAS loci containing genes highly expressed in placenta and differentially expressed in placentae from complicated compared with normal pregnancies (PlacGRSs; placental genomic risk scores) and also from the remaining GWAS loci (NonPlacGRSs; nonplacental genomic risk scores). We found that only PlacGRSs interacted with ELCs on schizophrenia-case control status, while NonPlacGRSs did not, implicating genes involved in placenta stress as driving the interaction between genomic risk and ELCs. These interactions were specifically related to placental gene expression, in that they were not detected when calculating GRSs based on SNPs marking loci highly expressed or epigenetically regulated in other tissues, including various adult and fetal tissues/embryonic cells, and fetal brain. Finally, we detected a much stronger enrichment of expression of the schizophrenia-risk genes in placentae from male compared with female offspring, suggesting a role of placenta in the higher incidence of schizophrenia in males (14).
We here investigate whether placental genomic risk for schizophrenia as well as several other developmental disorders and traits is linked with early neurodevelopmental outcomes in individuals with a history of ELCs associated with placenta pathophysiology. Abundant evidence shows that ELCs have implications for early developmental trajectories, including brain size, intellectual development, and neuromotor function as well as for schizophrenia later in life (3, 5, 1718–19). Based on these prior observations and our earlier findings (14), we hypothesized that schizophrenia PlacGRSs, in contrast to NonPlacGRSs, have a negative effect on early developmental outcomes, especially in males. Further consistent with our earlier findings, we hypothesized that this negative relationship is characteristic of the PlacGRSs constructed from the placental schizophrenia-GWAS loci with the strongest association with the disorder (PlacGRS1: GWAS P < 5 × 10⁻⁸; PlacGRS2: GWAS P < 1 × 10⁻⁶). We studied the relationship of PlacGRSs and NonPlacGRSs with brain volume in a unique sample of neonates who underwent MRI scanning shortly after birth, and analyzed the relationship with neurocognitive development at 1 and 2 y of age in the same subjects. Finally, we analyzed the relationship of PlacGRSs and NonPlacGRSs with brain volume in a sample of adult controls and patients with schizophrenia.
As expected, age at scanning, birthweight, and sex were significantly correlated with intracranial volume (ICV) in the whole sample of neonates and, separately, in singletons and offspring of multiple pregnancies (SI Appendix, Table S1); they were added as covariates to the analysis, together with genetic principal components and scanning platform. PlacGRS1 was, as predicted, negatively correlated with neonatal ICV (n = 242, t = −2.949, P = 0.0035; Fig. 1A): Having a higher placental genomic risk for schizophrenia corresponded to a smaller ICV at birth. Similarly, ICV was negatively associated with PlacGRS2 (n = 242, t = −3.142, P = 0.0019; Fig. 1B). The relationship between PlacGRSs and ICV was analogous in singletons and offspring of multiple pregnancies (Fig. 1).

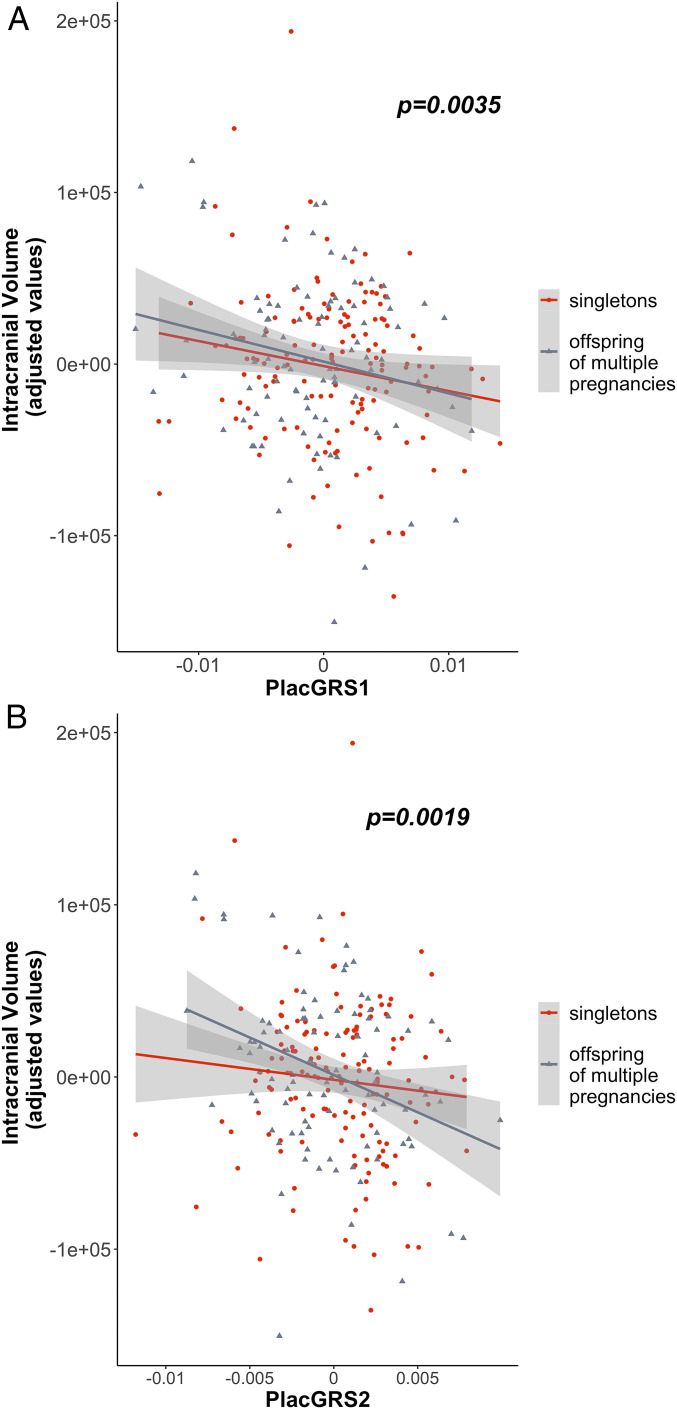
Placental genomic risk for schizophrenia and intracranial volume in neonates. Scatterplots of the relationship of neonatal ICV with placental genomic risk scores for schizophrenia, constructed from alleles showing significant association with schizophrenia, with GWAS P < 5 × 10⁻⁸ (PlacGRS1; A) and GWAS P < 1 × 10⁻⁶ (PlacGRS2; B) in loci containing genes highly expressed in placenta and differentially expressed in placentae from complicated compared with normal pregnancies. The figure shows the negative relationship between ICV and PlacGRSs in singletons (n = 147; red dots) and offspring of multiple pregnancies (n = 95; gray dots), with the P value in the whole sample.
We have previously shown that NonPlacGRSs do not interact with ELCs on risk for schizophrenia, and their loci do not contain genes differentially expressed in placentae from complicated pregnancies (14). Consistent with these prior negative associations, there was no association of ICV with NonPlacGRS1 and 2 (SI Appendix, Table S2).
Further consistent with our previous findings (14), the significance of association with ICV gradually decreased when considering different PlacGRSs constructed from variants showing association at the lesser thresholds of significance (PlacGRS3 to 10). No association was found for any NonPlacGRSs, even though these are thought to contain a higher number of likely true positive risk genes (SI Appendix, Table S2). These results suggest that ICV at this early age is impacted by the cumulative effect of schizophrenia-risk SNPs, but only by those contained in loci more relevant for placenta pathophysiology (see SI Appendix, Results, Relationship between PlacGRSs, NonPlacGRSs, and Other Brain Volumes…in Neonates and Tables S3–S5 for further details).
We next investigated the relationship of placental genomic risk for schizophrenia with infant cognitive development, assessed with the Mullen early learning composite standardized score (20) at 1 (MCS1) and 2 y of age (MCS2). MCS1 was not associated with parental education and socioeconomic status, while it was positively correlated with ICV in the whole sample (SI Appendix, Table S6). ICV was positively associated with MCS1 only in singletons (n = 122, t = 3.195, P = 0.0018; SI Appendix, Fig. S1). The relationship seemed nonlinear in the offspring of multiple pregnancies group (n = 72, t = −0.018, P = 0.9859; SI Appendix, Fig. S1), suggesting that, in the context of a shared uterus, additional factors (i.e., unequal sharing of placenta, ELCs unique to twins) likely affect the relationship of brain size at birth to early cognitive development.
We thus analyzed the relationship between PlacGRSs and MCS1 separately in singletons and offspring of multiple pregnancies. In singletons, PlacGRS1 and PlacGRS2 were negatively correlated with MCS1, either conditioning for ICV (PlacGRS1: n = 122, t = −2.013, P = 0.0465; Fig. 2A; PlacGRS2: n = 122, t = −2.648, P = 0.0093; Fig. 2B) or not conditioning for it (PlacGRS1: n = 122, t = −2.245, P = 0.0267; PlacGRS2: n = 122, t = −2.843, P = 0.0053): Thus, having higher placental genomic risk for schizophrenia corresponded to a lower score of cognitive and neuromotor development at 1 y, and this relationship was not simply mediated by ICV. As expected, such association gradually became less significant at PlacGRSs constructed from variants showing association with schizophrenia at the lesser thresholds of significance (SI Appendix, Table S7). Again, as predicted, no association was found for any NonPlacGRSs (SI Appendix, Table S7). We did not detect association of either PlacGRSs or NonPlacGRSs with MCS1 in the offspring of multiple pregnancies group (SI Appendix, Fig. S2 and Table S7), presumably because of a more complex, nonlinear relationship between early brain growth and cognitive development (SI Appendix, Fig. S1).
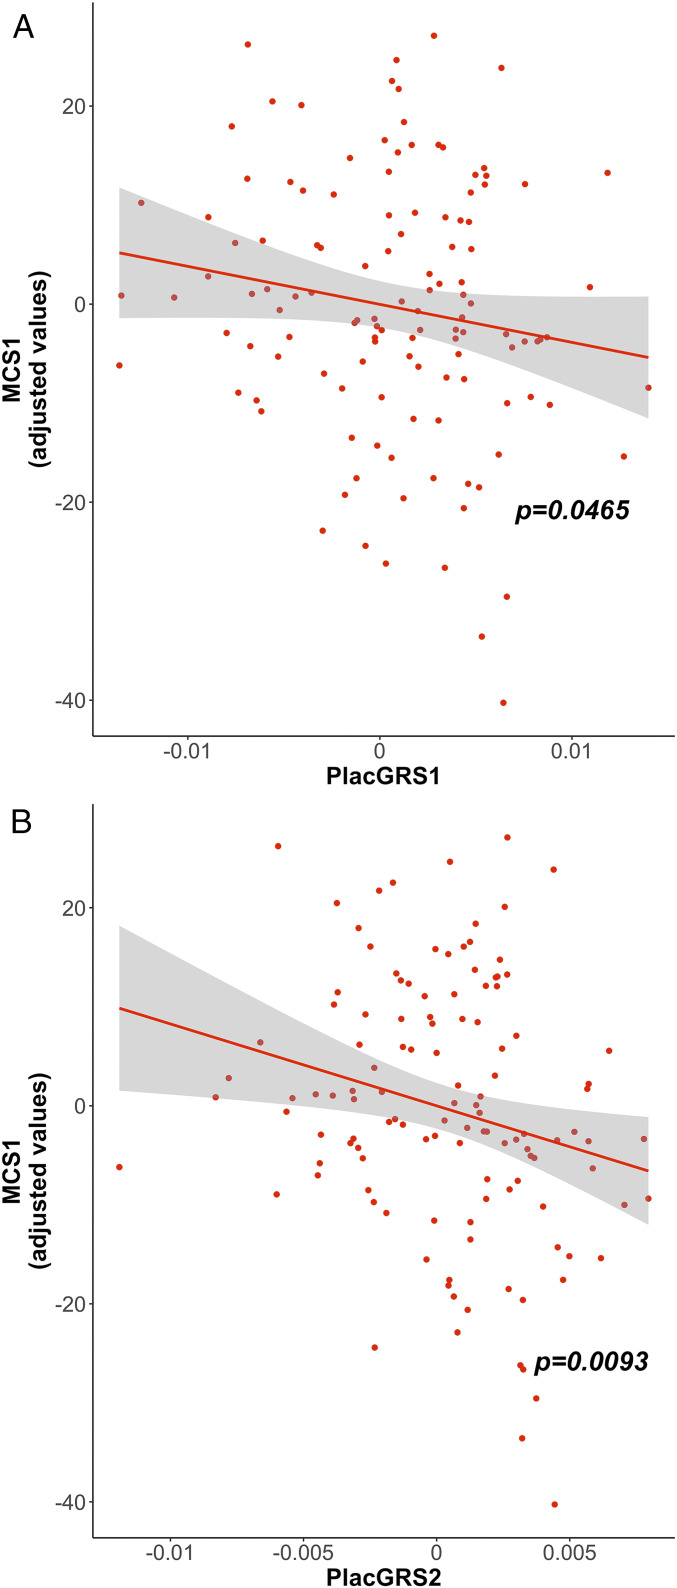
Placental genomic risk for schizophrenia and developmental scores at 1 y. Scatterplots of the relationship of MCS1 with placental genomic risk scores for schizophrenia (PlacGRS1, A; PlacGRS2, B). The figure shows the negative relationship between PlacGRSs and MCS1 in singletons, with the corresponding P value (n = 122; red dots). See SI Appendix, Fig. S2 for results in offspring of multiple pregnancies.
As expected, MCS2 was positively associated with MCS1 (SI Appendix, Table S8) and—again particularly in singletons—with ICV. MCS2, in contrast to MCS1, was now also positively associated with socioeconomic status and parental education, suggesting that related genetic/epigenetic factors do moderate cognitive development later in early life (SI Appendix, Table S8). In singletons, the negative relationship between PlacGRSs and cognitive development score was nominally preserved but attenuated on MCS2 for PlacGRS1 (n = 104, t = −1.726, Pone-sided = 0.0438; SI Appendix, Fig. S3A), and even weaker for PlacGRS2 (n = 104, t = −1.286, Pone-sided = 0.1007; SI Appendix, Fig. S3B). Again, these negative association trends did not emerge for NonPlacGRSs or for PlacGRSs derived from less significant GWAS loci. No negative relationship was found between PlacGRSs, NonPlacGRSs, and MCS2 in offspring of multiple pregnancies (SI Appendix, Results, Relationship between NonPlacGRSs and Early Cognitive Development and Table S9). Socioeconomic status was associated with MCS2, also conditioning for PlacGRS1 (n = 104, t = 2.926, P = 0.00431) and PlacGRS2 (n = 104, t = 2.986, P = 0.0036) (SI Appendix, Fig. S3C), suggesting that environmental factors can strongly contribute to cognitive scores later in development and that this effect is independent from placental genomic risk.
As predicted from our earlier data, PlacGRS1 and PlacGRS2 were significantly correlated with ICV in the male sample (PlacGRS1: n = 133, t = −2.362, P = 0.0197; PlacGRS2: n = 133, t = −3.259, P = 0.0014; Fig. 3 A and B) and less so in the female sample (PlacGRS1: n = 109, t = −1.382, P = 0.17; PlacGRS2: n = 109, t = −0.849, P = 0.398; Fig. 3 A and B). In singletons, PlacGRS1 and PlacGRS2 were negatively associated with MCS at 1 y of age (MCS1) in males (PlacGRS1: n = 68, t = −2.085, P = 0.0415; PlacGRS2: n = 68, t = −2.695, P = 0.0092; Fig. 3 C and D) but not females (PlacGRS1: n = 54, t = −0.403, P = 0.689; PlacGRS2: n = 54, t = −1.248, P = 0.2186; Fig. 3 C and D). In offspring of multiple pregnancies, the relationship was not significant in either sex. No differences in males or females were detected when analyzing the relationship between PlacGRSs and MCS2.
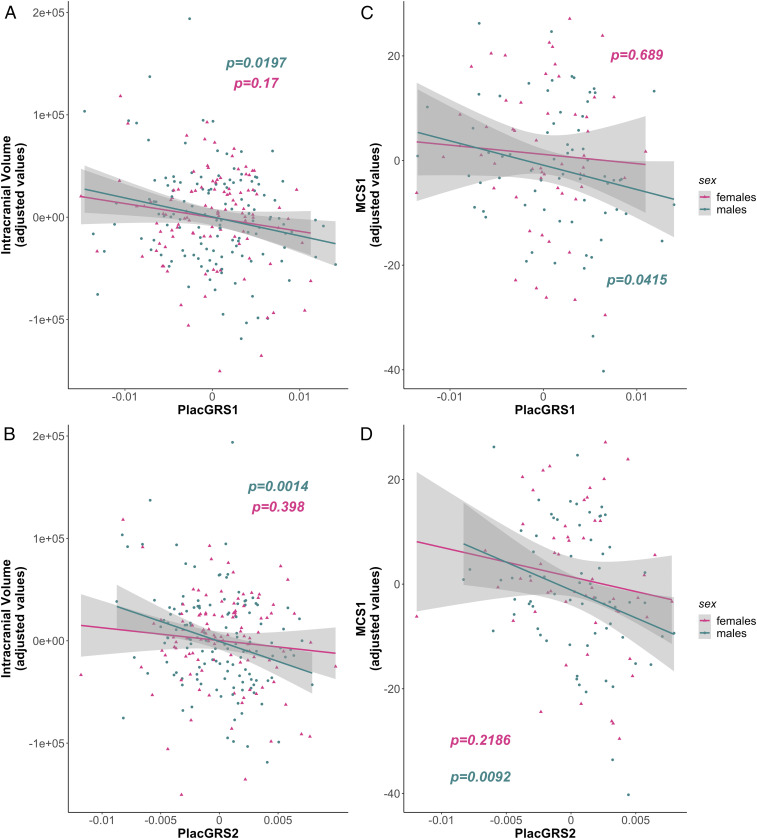
Sex-related differences in the relationship between placental genomic risk for schizophrenia and early neurodevelopmental outcomes. (A and B) Scatterplots of the relationship of neonatal ICV with placental genomic risk scores for schizophrenia (PlacGRS1, A; PlacGRS2, B) in males (n = 133; turquoise dots) and females (n = 109; violet dots). (C and D) Scatterplots of the relationship of MCS1 with placental genomic risk scores for schizophrenia (PlacGRS1, C; PlacGRS2, D) in male (n = 68; turquoise dots) and female singletons (n = 54; violet dots) (P values in the male sample are in turquoise; P values in the female sample are in violet).
We calculated PlacGRSs and NonPlacGRSs for other disorders and traits that have been associated with ELCs, including autism (21), attention deficit hyperactivity disorder (ADHD) (22, 23), intelligence quotient (IQ) (24), diabetes (25, 26), body mass index (BMI) (2526–27), height (28), depression (2930–31), and bipolar disorder (BD) (31, 32). Notably, no negative significant associations of the respective PlacGRS1 and PlacGRS2 for any of these disorders were found with ICV and either MCS; also, no positive significant associations were detected for PlacGRSs of the IQ, BMI, and height phenotypes. No significant associations of the remaining (NonPlacGRS1 to 10 and/or PlacGRS3 to 10) scores were found after correcting for multiple comparisons. While for autism and ADHD we cannot exclude that this lack of association is due at least in part to the much smaller number of gene discoveries compared with schizophrenia, in general these perhaps surprising results suggest that the link between placenta biology and genomic risk, at least as defined here, is not shared by any of these phenotypes, despite their association with a history of ELCs, and that the set of associations we have observed may be relatively specific for schizophrenia (SI Appendix, Tables S10–S12).
To further explore this possibility, we examined whether the genes in the loci with the most significant GWAS associations with these other disorders and traits were highly ranked among the genes differentially expressed in placentae from complicated pregnancies, similar to our previous work on placental genomic risk for schizophrenia (14). We did not detect a consistent placenta enrichment of the genes in the high-risk loci associated with most of these phenotypes (SI Appendix, Table S13) as we had detected for schizophrenia, and there is remarkably little overlap between the various PlacGRS1 and PlacGRS2 gene sets (Fig. 4A and SI Appendix, Fig. S4). Given the partial genetic overlap of schizophrenia with some of these disorders (12, 33), these results suggest that the genes that uniquely map to the schizophrenia-risk loci are selectively relevant for placenta biology. Indeed, the PlacGRS genes that uniquely map to the schizophrenia-risk loci are enriched for pathways and functions associated with cellular metabolic stress, including mitochondrial dysfunction, unfolded protein response, and endoplasmic reticulum stress response, which are highly relevant for trophoblast invasion, placenta development, and pathophysiology (3435–36) (Fig. 4B, SI Appendix, Results, Biological Insights about the Schizophrenia Specific Placental Risk Genes, and Datasets S1 and S2), in addition to brain function. Although we cannot exclude a direct effect in the brain of the PlacGRS genes on brain development and activity, these results suggest that the link of placenta biology with genomic risk and early outcomes is surprisingly specific to schizophrenia; the other phenotypes may be more sensitive to early risk factors acting primarily on the fetal brain and/or later in postnatal life.
![Overlap between placental gene sets for schizophrenia and other developmental disorders and traits. (A) UpSetR (93) plot representing the intersection/overlap of the schizophrenia placental gene sets (PlacGRS1) with placental gene sets of other disorders and traits (height, BMI, type 2 diabetes [T2D], IQ, BD, major depressive disorder [MDD], ADHD, and autism spectrum disorder [ASD]). The vertical red-orange bars (Top) represent the number of genes (numbers above the bars) at the intersections. The intersections are indicated, in the combination matrix (Bottom), by the red-orange dots and connecting lines: for example, the first bar indicates that 3 genes are common to the placental gene sets of BMI, T2D, BD, and schizophrenia (SZ), while the last bar indicates that 66 genes are unique to the placental schizophrenia gene set and are not contained in any other gene set. Only intersections with placental schizophrenia gene sets are shown, and only intersections with size greater than two genes are shown among the intersections of more than two gene sets (SI Appendix, Fig. S4 shows all the intersections with placental schizophrenia gene sets for PlacGRS1 and PlacGRS2). (B) Pathways and functions enriched for the PlacGRS1 genes (n = 66) that uniquely map to the schizophrenia-risk loci genes and are not contained in any other gene set (last bar of the UpSetR plot in A) (see also Datasets S1 and S2). Bars depict the negative logarithm of the P values of the enriched functions (orange bars) and pathways (blue bars).](/dataresources/secured/content-1765902941820-8474859d-273f-4fb1-9bba-01fa91230381/assets/pnas.2019789118fig04.jpg)
Overlap between placental gene sets for schizophrenia and other developmental disorders and traits. (A) UpSetR (93) plot representing the intersection/overlap of the schizophrenia placental gene sets (PlacGRS1) with placental gene sets of other disorders and traits (height, BMI, type 2 diabetes [T2D], IQ, BD, major depressive disorder [MDD], ADHD, and autism spectrum disorder [ASD]). The vertical red-orange bars (Top) represent the number of genes (numbers above the bars) at the intersections. The intersections are indicated, in the combination matrix (Bottom), by the red-orange dots and connecting lines: for example, the first bar indicates that 3 genes are common to the placental gene sets of BMI, T2D, BD, and schizophrenia (SZ), while the last bar indicates that 66 genes are unique to the placental schizophrenia gene set and are not contained in any other gene set. Only intersections with placental schizophrenia gene sets are shown, and only intersections with size greater than two genes are shown among the intersections of more than two gene sets (SI Appendix, Fig. S4 shows all the intersections with placental schizophrenia gene sets for PlacGRS1 and PlacGRS2). (B) Pathways and functions enriched for the PlacGRS1 genes (n = 66) that uniquely map to the schizophrenia-risk loci genes and are not contained in any other gene set (last bar of the UpSetR plot in A) (see also Datasets S1 and S2). Bars depict the negative logarithm of the P values of the enriched functions (orange bars) and pathways (blue bars).
The relationship between PlacGRSs and cognitive outcome present early in life, especially in males, is presumably diluted by other factors militating toward normal development, particularly in healthy individuals, which most of our sample will likely become. In contrast, the developmental trajectory of patients who will manifest schizophrenia in early adulthood may bear telltale remnants of these early risk effects. Consistent with this possibility, in adult healthy controls there was no association of ICV with PlacGRSs (Fig. 5 A and B and SI Appendix, Table S14), but a small but significant negative relationship of PlacGRS1 and PlacGRS2 with ICV was found in patients with schizophrenia (PlacGRS1: n = 154, β = −86.64, Pone-sided = 0.04; PlacGRS2: n = 154, β = −85.65, Pone-sided = 0.01; Fig. 5 A and B and SI Appendix, Results, Other Brain Volumes Analyses in Patients with Schizophrenia and Table S14).
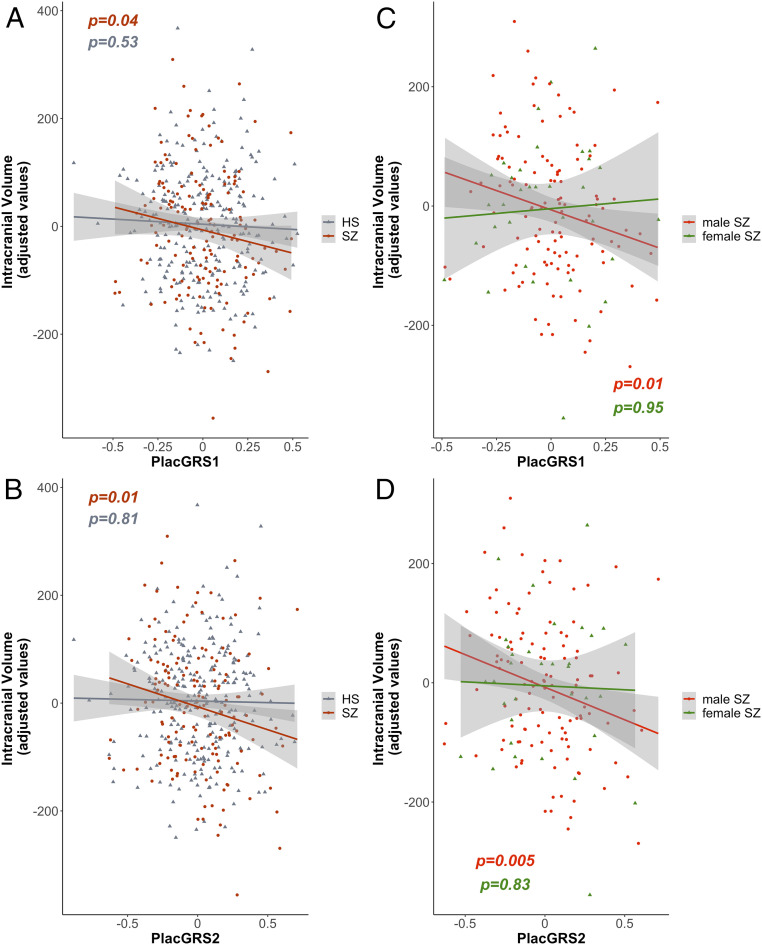
Placental genomic risk for schizophrenia and intracranial volume in adult controls and patients with schizophrenia. (A and B) Scatterplots of the relationship of ICV with placental genomic risk scores for schizophrenia (PlacGRS1, A; PlacGRS2, B) in adult healthy subjects (HS; n = 269; gray dots) and in patients with schizophrenia (n = 154; dark red dots) (P values for HS are in gray; P values for SZ are in dark red). (C and D) Scatterplots of the relationship of ICV with placental genomic risk scores for schizophrenia (PlacGRS1, C; PlacGRS2, D) in male (n = 120; red dots) and female (n = 54; green dots) patients with SZ (P values for the male sample are in red; P values for the female sample are in green).
We reran these analyses by sex and found that PlacGRS1 and PlacGRS2 were correlated with ICV only in male patients (PlacGRS1: n = 120, β = −129.62, Pone-sided = 0.01; PlacGRS2: n = 120, β = −110.61, Pone-sided = 0.005; Fig. 5 C and D and SI Appendix, Table S15), while the association was not significant in females (PlacGRS1: n = 34, β = −7.65, P = 0.95; PlacGRS2: n = 34, β = −19.97, P = 0.83; Fig. 5 C and D and SI Appendix, Table S15). Although the sample size in females was smaller than in males, the bigger effect sizes in males (β = −129.62 and −110.61) compared with the whole sample (β = −86.64 and −85.65) suggest that the relationship between PlacGRSs and brain volume in patients with schizophrenia is driven by the male patients (SI Appendix, Table S15). No sex-related differences were found in controls (all P > 0.69; SI Appendix, Table S16).
Understanding the trajectories leading to neurodevelopmental disorders is a big challenge but a necessary one to design strategies aimed at prevention. We previously defined a component of genomic risk for schizophrenia based on gene expression in placenta (PlacGRSs) that specifically interacts with ELCs in predicting risk of schizophrenia (14). In this work, we have analyzed whether, in the presence of a history of ELCs often associated with placenta pathophysiology, placental genomic risk for schizophrenia is associated with early neurodevelopmental outcomes, shortly after birth and at 1 and 2 y of age.
We found that placental genomic risk is negatively associated with neonatal ICV in a sample of singletons and offspring of multiple pregnancies (Fig. 1 and SI Appendix, Table S2) and, in singletons, correlates with worse cognitive development at 1 y (Fig. 2 and SI Appendix, Table S7) and shows a directionally similar but attenuated effect at 2 y (SI Appendix, Fig. S3 A and B and Table S9). This negative association is stronger in males (Fig. 3), unique to the PlacGRSs for schizophrenia (i.e., absent in the NonPlacGRSs), and unique to those derived from the loci with the strongest GWAS association with the illness (PlacGRS1 and 2). Each of these clinical associations is consistent with our earlier associations with gene expression in placenta (14) implicating a statistically orthogonal biology of a placental component of genomic risk for schizophrenia compared with a nonplacental component, especially in males.
Our results further suggest that, at least in the presence of ELCs, genetic variants relevant for the placental response to stress, but eventually associated with schizophrenia, may cumulatively affect brain growth (Fig. 1 and SI Appendix, Table S2), deviating the neurodevelopmental trajectory toward the eventual disease phenotype. This same trajectory, however, may branch out into different subtrajectories, in response to various genetic and environmental factors. In singletons, our results indicate that the developmental trajectory may channel into worse cognitive development at 1 and 2 y of age; in offspring of multiple pregnancies, however, despite a similar association with PlacGRSs and brain growth at birth, other events may intervene in the more complex context of a shared uterus, to translate into a different cognitive outcome early in life.
Even in the presence of relatively worse early cognitive development, other factors may soon dilute the impact of such environmental and genetic adversities, likely enabling what Conrad Waddington referred to as “canalization” (37, 38), or a trajectory leading toward “normal” neurodevelopment. Waddington expounded a metaphorical model for ontogeny as a contoured landscape with hills and valleys representing genetic and environmental interactions that bias or “canalize” toward a normal phenotype. Consistent with this abstraction, the negative relationship between PlacGRSs and cognitive development in singletons at 1 y (Fig. 2 and SI Appendix, Table S7) is statistically weakened at 2 y (SI Appendix, Fig. S3 A and B and Table S9), when cognitive scores are more sensitive to environmental factors such as parental education and socioeconomic status (SI Appendix, Fig. S3C and Table S8), and also are more likely influenced by inherited components of intellectual capacity. We assume that such “recanalization” takes place for most of our sample of infants, as they will likely become, as adults, healthy individuals. Consistently, when analyzing the relationship between PlacGRSs and ICV in adult healthy subjects, we do not detect any association (Fig. 5 A and B and SI Appendix, Table S14). Conversely, we might expect that, in some individuals, other factors, genetic and environmental, contribute to decanalize the neurodevelopmental trajectory toward the disorder, in a dynamic where the relationship between higher placental genomic risk and early neurodevelopmental phenotypes is preserved, rather than rescued. Indeed, in adult patients with schizophrenia, higher placental genomic risk for schizophrenia corresponds to a smaller MRI volume of the brain (Fig. 5 A and B and SI Appendix, Table S14). We speculate that, while this effect in adult patients is very small, it is remarkable that any remnant of placental risk is observed in these adult individuals, considering that the negative effect of PlacGRSs on brain volume may have been weakened in our sample by the presence of patients with no histories of complicated pregnancies, which our earlier clinical study (14) and the current data indicate is especially relevant for outcomes based on PlacGRSs.
Our data also indicate that the neurodevelopmental trajectory of risk associated with higher PlacGRSs may be more important in male individuals. Indeed, we found stronger negative associations in males, compared with females, of PlacGRSs, with 1) brain volume in neonates (Fig. 3 A and B), 2) cognitive development scores at 1 y of age (Fig. 3 C and D), and 3) brain volume in adult patients with schizophrenia (Fig. 5 C and D and SI Appendix, Table S15). These sex-biased findings suggest that factors acting in placenta may explain the higher incidence of schizophrenia in males, consistent with our previous evidence of a higher expression of risk genes for schizophrenia in male placentae (14) and with animal studies showing higher vulnerability of males to the effects of prenatal stress (39, 40).
We do not find similar associations with our construction of placental genomic risk for several other developmental disorders and traits (SI Appendix, Tables S10–S12), which was unexpected given that prenatal development and ELCs also affect risk for these phenotypes (2122232425262728293031–32, 41, 42). These negative results, however, echo that the GWAS-significant loci genes for most of these disorders and traits are not dynamically modulated in placenta (SI Appendix, Table S13), in contrast to a set of the top risk genes for schizophrenia (14), and that PlacGRS genes for these phenotypes show little overlap with PlacGRS genes for schizophrenia (Fig. 4A and SI Appendix, Fig. S4), which highlight basic cellular responses to stress (Fig. 4B and Datasets S1 and S2) as unique risk factors for this condition.
A limitation of this study is represented by the fact that, although PlacGRSs are genomic predictors derived by placental gene-expression data, the considerable overlap in cell biology between brain and placenta does not allow us to exclude that part of the effect of the PlacGRSs on early neurodevelopmental outcomes is related to a more direct effect in the brain of the PlacGRS genes on brain development. However, we believe that the absence of a significant relationship of NonPlacGRSs with brain volume and MCSs is consistent with the possibility that genomic predictors based on placental gene expression may have a more specific role in affecting early trajectories of brain development.
Our data suggest that specific strategies of prevention may benefit from understanding the unique placental effects of schizophrenia genomic risk and from defining which factors in combination contribute to decanalize the neurodevelopmental trajectories of individuals with a history of early-life complications who develop schizophrenia.
The main objective of this study is to analyze whether the use of placental genomic predictors may help to detect early trajectories of risk for neurodevelopmental disorders, potentially allowing an implementation of preventive strategies starting in early life. Our previous evidence (14) indicated an interaction between genomic risk for schizophrenia and ELCs driven by genes highly expressed in placenta and differentially expressed in placenta from complicated pregnancies in the loci with the strongest association with the disorder compared with other loci; we therefore hypothesized that genomic predictors of schizophrenia based on placental gene expression (PlacGRSs), and constructed from variants showing the strongest association with the disorder (PlacGRS1: GWAS P < 5 × 10⁻⁸; PlacGRS2: GWAS P < 1 × 10⁻⁶), have a negative effect on early developmental outcomes in infants with a history of ELCs, in contrast to genomic predictors not related to placenta biology (NonPlacGRSs). Because in our previous work we detected an up-regulation of schizophrenia-risk genes in placentae from male compared with female offspring, we also hypothesized a stronger relationship between schizophrenia’s PlacGRSs and early neurodevelopmental outcomes in male infants. We therefore calculated placental and nonplacental genomic risk scores of schizophrenia and, to address the potential specificity of our prior findings, we also calculated analogous genomic risk scores for other developmental disorders and traits, based on GWAS-associated loci harboring genes relevant for placenta biology (PlacGRSs) and loci not related to placenta biology (NonPlacGRSs). We first analyzed the relationship of these GRSs with neonatal brain volume, measured shortly after birth, in a sample of 242 singletons and infants with a history of ELCs; we then analyzed the relationship of the GRSs with infant cognitive development at 1 and 2 y of age in two subsets with available data from the same sample (see below and Table 1 for details). Because we detected a negative relationship between schizophrenia’s PlacGRSs and early brain growth, we further analyzed whether this relationship was preserved in a sample of 269 adult healthy subjects and 154 patients with schizophrenia, hypothesizing to replicate a negative relationship in male patients with schizophrenia.

| Sample | Analysis | N | Age at assessment, mean ± SD | Sex | Birthweight, g, mean ± SD | Maternal education, y, mean ± SD | Paternal education, y, mean ± SD | Total household income, $, mean ± SD | |
| UNC-DUMC | Brain volume | Singletons | 147 | 24.12 ± 14.3 d | 66 F, 81 M | 3,335 ± 576 | 15.77 ± 3 | 15.59 ± 3.3 | 75,857 ± 52,491 |
| Offspring of multiple pr. | 95 | 40.19 ± 20.9 d | 43 F, 52 M | 2,364 ± 490 | 16 ± 2.7 | 15.96 ± 3.1 | 93,616 ± 56,753 | ||
| MCS1 subsample | Singletons | 122 | 379.4 ± 21.8 d | 54 F, 68 M | 3,337 ± 598 | 15.77 ± 2.8 | 15.66 ± 3.3 | 76,466 ± 51,897 | |
| Offspring of multiple pr. | 72 | 404.2 ± 24.9 d | 33 F, 39 M | 2,393 ± 495 | 15.99 ± 2.6 | 15.50 ± 3.1 | 88,962 ± 58,123 | ||
| MCS2 subsample | Singletons | 104 | 745.9 ± 25.9 d | 48 F, 56 M | 3,376 ± 610 | 15.94 ± 2.7 | 15.79 ± 3.2 | 78,044 ± 51,596 | |
| Offspring of multiple pr. | 54 | 769.6 ± 24.3 d | 21 F, 33 M | 2,409 ± 497 | 16.02 ± 2.6 | 15.37 ± 2.9 | 91,537 ± 60,745 | ||
| CBDB | Brain volume | HS | 269 | 31.95 ± 9.5 y | 154 F, 115 M | ||||
| SZ | 154 | 34.82 ± 9.9 y | 34 F, 120 M | ||||||
Column 4 reports the number (N) of singletons (rows 1, 3, and 5) and offspring of multiple pregnancies (rows 2, 4, and 6) in the UNC-DUMC sample used for the neonatal brain volume analysis (rows 1 and 2), in the subsamples used for the analysis of MCS1 (rows 3 and 4) and MCS2 (rows 5 and 6), and in the CBDB sample of adult HS (row 7) and patients with SZ (row 8). Column 5 reports the age at assessment in the same sample, expressed in days in the UNC-DUMC sample and in years in the CBDB sample. Column 6 reports the number of females (F) and males (M) in each sample. Columns 7, 8, 9, and 10 report, respectively, birthweight (g), maternal education (y), paternal education (y), and socioeconomic status, estimated by total household income ($), in the UNC-DUMC sample. No significant (P < 0.05) association was detected between PlacGRSs and any of these variables.
GRSs and brain volume were analyzed in 242 infants from the University of North Carolina (UNC) Early Brain Development Study, a longitudinal study (principal investigator [PI]: J.H.G.) of infants at high risk for psychiatric disorders, and typically developing infants, approved by the institutional review boards of UNC and Duke University Medical Center (DUMC). Pregnant women were recruited from the prenatal diagnostic clinics at UNC, DUMC, and other local clinics. Informed consent was obtained from a parent at enrollment and at each follow-up visit. Because, consistent with our previous findings (14), we hypothesized an effect of PlacGRSs on brain development in the presence of ELCs, we included in our analysis only neonates with qualifying ELCs (severity score ≥ 4; see below for details on ELC scoring). Our sample included 147 singletons (66 females, 81 males) and 95 unrelated offspring of multiple pregnancies (43 females, 52 males), selecting the twin with the highest ELC severity score of each pair (see below for details). We included only Caucasian individuals, because GRSs are derived from summary statistics of GWASs performed on Caucasians. We analyzed the relationship of GRSs with infant cognitive development at 1 y of age in a subsample of 194 individuals with available data, which included 122 singletons (54 females, 68 males) and 72 unrelated offspring of multiple pregnancies (33 females, 39 males). The relationship between GRSs and infant cognitive development at 2 y of age was investigated in a subset of 158 infants with available data from the same sample (104 singletons: 48 females, 56 males; 54 offspring of multiple pregnancies: 21 females, 33 males).
We also analyzed the relationship of PlacGRSs and NonPlacGRSs with brain volume measurements in adult controls (n = 269, 154 females, 115 males) and patients with schizophrenia (n = 154, 34 females, 120 males). All participating subjects in this analysis were recruited as part of the Clinical Brain Disorders Branch Sibling Study (CBDB) of schizophrenia at the National Institute of Mental Health (PI: D.R.W.). The institutional review board of the Intramural Program of the National Institute of Mental Health approved the study, and written informed consent was obtained after a complete description of the study was provided to the participants. Exclusion and inclusion criteria have been previously reported (43). Only Caucasians of European ancestry were included to reduce population stratification artifacts.
Demographic characteristics of the samples are reported in Table 1.
DNA was extracted from buccal samples using standard methods described in the Puregene DNA Purification Kit (Gentra Systems). Genotyping was performed using Affymetrix Axiom Genome-Wide LAT arrays. Quality control was performed using PLINK (version 1.07) (44) as reported elsewhere (11). Additionally, SNPs were excluded if they failed the Hardy–Weinberg equilibrium test (P < 10−8) and if they had minor allele frequency less than 1%. Imputation was performed using MaCH-admix (45) with 1000 Genomes phase 3 as the reference panel (4647–48).
DNA was extracted from blood samples using standard procedures, and genotyping was done using Illumina BeadChips (510K/610K/660K/2.5M). Because different platforms were used for genotyping, the analyses in this sample were adjusted for genotyping batch indicator.
GRSs (also called PRSs) for schizophrenia were calculated as previously described (14, 49, 50). Briefly, GRSs are a measure of genomic risk (49) calculated as the sum of risk alleles of index SNPs from GWASs on schizophrenia (11, 50), weighted for the strength of association, that is, the odds ratio (11). As previously described (11, 14, 49, 50), we performed linkage disequilibrium pruning and “clumping” of the SNPs, discarding variants within 500 kb of, and in r2 ≥0.1 with, another (more significant) marker. We multiplied the natural log of the odds ratios of each index SNP by the imputation probability for the corresponding effective allele for the odds ratio at each variant, and summed the products over all variants, so that each subject had whole-genome GRSs. Ten GRSs (GRS1 to 10) were calculated using subsets of SNPs selected according to the GWAS P-value thresholds of association with schizophrenia: 5e-08 (GRS1), 1e-06 (GRS2), 1e-04 (GRS3), 0.001 (GRS4), 0.01 (GRS5), 0.05 (GRS6), 0.1 (GRS7), 0.2 (GRS8), 0.5 (GRS9), and 1 (GRS10). SNPs in sets with lower P values are also in sets with higher P values (for example, SNPs in GRS1 are included in GRS2, SNPs in GRS2 are included in GRS3, and so on), so that the analyses with a different level of GRSs, like PlacGRS1 and PlacGRS2, are not independent. We calculated PlacGRSs for schizophrenia, based on the GWAS SNPs marking loci containing genes highly expressed in placenta and differentially expressed in placenta from complicated, compared with normal, pregnancies, as in our previous work (14), and we compared their relationship with brain volume and infant cognitive development with GRSs derived from the SNPs marking the remaining GWAS-significant and nonsignificant loci (NonPlacGRSs). Therefore, the set of SNPs used for the calculation of PlacGRSs and NonPlacGRSs is the same as used in our previous work (14) (Dataset S3). For this calculation, we selected as “placental” the loci containing genes differentially expressed (P < 0.05) in at least four of the eight datasets of placentae from pregnancies complicated with ELCs and the loci containing genes with expression in the upper decile both in trophoblast and in villi (14); we selected as “nonplacental” the remaining loci. This is the same approach used in our previous work (14), where we have provided details of the publicly available datasets used to identify genes highly expressed in placenta and differentially expressed in placentae from pregnancies complicated with preeclampsia and intrauterine growth restriction (IUGR). This choice may be a limitation, because the ELCs detected in our sample represent heterogeneous conditions, not limited to preeclampsia and IUGR. However, we used gene-expression data from placentae with preeclampsia and IUGR because they represent two paradigmatic placental diseases, characterized by ischemic processes, with impaired migration of extravillous trophoblasts and impaired spiral artery remodeling (5152–53), and often associated with an altered inflammatory response of the placenta (5455–56). Indeed, ischemic disease processes—with impaired trophoblast invasion and deficient remodeling of the maternal spiral arteries—as well as an altered inflammatory response may represent common denominators in the mechanisms underlying many ELCs detected in our sample (52, 55, 57). Preeclampsia and IUGR are in fact frequently linked with many other ELCs detected in our samples (585960–61), and they are themselves classic severe ELCs (severity level ≥4 on the McNeil–Sjöström scale) that have been associated with increased risk for schizophrenia, and also where the primary affected cells have been isolated and studied ex vivo (3, 62, 63). Since both preeclampsia and IUGR are ELCs attributed to a shallow invasion of the uterine interstitial compartment from cytotrophoblasts (3, 6263–64), we also analyzed a dataset of cytotrophoblasts cultured ex vivo under conditions of different invasiveness.
Odds ratios and index SNPs for GRS calculation were derived from a meta-analysis of Psychiatric Genomics Consortium GWAS datasets excluding the CBDB (scz_lie_eur) sample. Index SNPs selected for the calculation of standard schizophrenia GRSs, PlacGRSs, and NonPlacGRSs were the same in the UNC-DUMC and CBDB samples, and they are reported in Dataset S3. Of note, the PlacGRS loci have similar average effect sizes in the case-control GWAS datasets, compared with the NonPlacGRS loci. In an analogous way and to address the possible specificity to schizophrenia of the PlacGRS relation with brain volume and infant cognitive development, we calculated PlacGRSs and NonPlacGRSs using summary statistics of the latest GWASs for several other complex disorders and traits, and we analyzed their relationship with the same phenotypes. Specifically, we calculated PlacGRSs for autism (65), ADHD (66), IQ (67), type 2 diabetes (68), BMI (69), height (69), major depression (70), and BD (71).
Because in our previous work (14) we found that placental genomic risk for schizophrenia predicts liability to the disorder especially in the presence of ELCs, we hypothesized its association with deviations manifesting early in life in infants with a history of ELCs. We therefore selected our sample by including only individuals with a history of potentially serious ELCs. ELCs are here referred to as “somatic complications and conditions occurring during pregnancy, labor-delivery, and the immediate neonatal period” potentially harmful for the offspring, with special focus on the central nervous system (CNS) (72). These events are also referred to elsewhere as “obstetric complications” (72, 73). We assessed ELCs through medical records and scored them using the McNeil–Sjöström scale for obstetric complications (72). Each ELC is assigned a severity score of 1 to 6, based on the degree of inferred potential harm to the offspring CNS. ELCs with severity weight ≥4 are considered potentially harmful or relevant factors in fetal stress. As in other reports (727374–75), we defined ELC exposure based on the presence of at least one serious ELC (severity score ≥ 4), and identified the severity score of each individual as the highest severity score of all the ELCs occurring in that individual. Individuals were excluded if the information was incomplete or inconsistent, or if the presence of a complication was certain but a severity weight could not be safely determined. As a consequence, only subjects with certain information about the presence of serious ELCs were included in our analyses. All the infants included in our analyses had at least one ELC potentially associated with placenta pathophysiology, that is, none had complications occurring only during neonatal life (details of the ELCs detected in our sample are reported in Dataset S4).
Scans were acquired on either a Siemens Allegra head-only 3T scanner (n = 218) or a Siemens TIM Trio (n = 24; Siemens Medical Solutions). Infants were swaddled, fed, and fitted with ear protection.
For the Allegra, structural T1-weighted images were initially acquired with a fast-low angular shot sequence (FLASH; repetition time (TR) 15 ms, echo time (TE) 7 ms, flip angle 25°, spatial resolution 1 × 0.5 × 0.5 mm3) (n = 9). For the remaining subjects (n = 209), a three-dimensional magnetization-prepared rapid gradient-echo sequence (3D MP-RAGE; TR 1,820 ms, TE 4.38 ms, flip angle 7°) was employed with spatial resolution of 1 × 0.9 × 0.9 mm3 for the first 5 subjects and 1 × 1 × 1 mm3 for the next 204 subjects. For Trio, T1-weighted images were acquired with a 3D MP-RAGE sequence (TR 1,820 ms, TE 3.75 ms, flip angle 7°, spatial resolution 1 × 1 × 1 mm3) (n = 24).
T2-weighted and proton density images were acquired on the Allegra using turbo-spin echo (TSE) sequences. For the first subject the parameters were TR 7,000 ms, TE1 18 ms, TE2 108 ms, flip angle 150°, spatial resolution 1 × 1 × 3.9 mm3. The remaining subject (n = 217) parameters were TR range 5,270 to 6,200 ms, TE1 range 20 to 21 ms, TE2 range 119 to 124 ms, flip angle 150°, spatial resolution 1.25 × 1.25 × 1.95 mm3. The first two subjects scanned on the Trio also used a TSE sequence (TR 6,200 ms, TE1 17 ms, TE2 116 ms, flip angle 150°, spatial resolution 1.25 × 1.25 × 1.95 mm3). We then upgraded to a 3D T2 SPACE protocol (TR 3,200 ms, TE 406 ms, flip angle 120°, spatial resolution 1 × 1 × 1 mm3) (n = 22). We previously found the platform (Allegra or TIM Trio) had a significant impact on gray matter volume and a marginal effect on ICV, though acquisition parameters within each platform did not significantly affect brain volumes (48). Platform was therefore included as a covariate in all the analyses.
Brain tissue was automatically segmented into gray matter (GM), white matter (WM), and cerebrospinal fluid (CSF) using an infant MRI-specific atlas-based expectation–maximization segmentation algorithm utilizing both T1- and T2-weighted images as previously described (7677–78). This processing further performs automatic brain masking, as well as correction of intensity inhomogeneities. ICV was quantified as the sum of total CSF, WM, and GM volumes. All segmentations were visually quality-assessed for anatomical accuracy by an expert rater, who was blind to any information about PlacGRSs. Segmentations of insufficient quality were rejected and not included in the analysis, and they corresponded to ∼20% of the whole UNC-DUMC sample.
Cognitive ability was assessed at ages 1 and 2 using the Mullen Scales of Early Learning (20, 79). Measures of gross motor, fine motor, visual reception, and expressive and receptive language were collected by experienced testers. The age-standardized t scores of the last four scales were combined into a Mullen early learning composite standardized score (range 49 to 155, mean 100, SD 15).
All statistical analyses were performed in the R environment (80), version 4.0.2. We used multiple linear regression to test the relationship of GRSs with 1) neonatal brain volume measurements and 2) early learning composite scores derived from the Mullen Scales of Early Learning (20). In each analysis, we used ancestry-based principal components as covariates (11). Additional covariates were based on potential confounders associated with the phenotypes examined, as explained below.
1) Brain volume analysis: Because age of scanning, birthweight, and sex were significantly correlated with intracranial volume in the whole sample and, separately, in singletons and offspring of multiple pregnancies (SI Appendix, Table S1), they were therefore added as covariates to the analysis, together with genetic principal components and scanning platform (see also SI Appendix, Results, Sensitivity Analyses for further analysis on the potential effect of scanning platform). We analyzed the relationship between GRSs and WM, GM, and CSF volumes with the same covariates, and also adjusting for ICV.
2) MCS analysis: MCS at 1 y was associated with ICV in singletons (SI Appendix, Table S6), which was therefore added as a covariate to the analysis, together with age of evaluation and genetic principal components. Analyses without adjusting for ICV were also performed with consistent results. MCS at 2 y was associated with intracranial volume and socioeconomic status in singletons and with paternal education in offspring of multiple pregnancies (SI Appendix, Table S8); these variables were therefore added as covariates to the analysis, together with age of evaluation and genetic principal components.
In all these analyses, we report two-sided P values, except in the analysis on the relationship of PlacGRS1 and 2 with MCS2, based on our specific hypotheses and the directionality of findings on, respectively, the analogous scores at 1 y (MCS1) and neonatal brain volume. Sensitivity analyses were performed after excluding one potential outlier for brain volumes, with consistent results (see SI Appendix, Results, Sensitivity Analyses and Tables S17–S20 for details). We retained this individual in our main analyses, because he is not an outlier in the whole sample of the UNC-DUMC Early Brain Development Study, which represents the population from which our sample is obtained. We also performed sensitivity analyses on the relationship between GRSs and early neurodevelopmental outcomes adding “presence of a maternal psychiatric disorder” as a covariate, and excluding the 26 individuals with this condition, with consistent results, reported in SI Appendix, Tables S21–S23 (see also SI Appendix, Results, Sensitivity Analyses for details).
Finally, to further compare the relationship of PlacGRSs and NonPlacGRSs with brain volume, we created a Lasso model, using the R package glmnet (https://CRAN.R-project.org/package=glmnet) (see SI Appendix, Results, Analyses with LASSO Model… for details).
Global and regional gray matter volumes were examined with VBM (81), using the VBM toolbox (http://dbm.neuro.uni-jena.de/vbm8/VBM8-Manual.pdf) implemented in Statistical Parametric Mapping software (SPM12; https://www.fil.ion.ucl.ac.uk/spm/). T1 images were normalized to a tissue probability map provided by the VBM8 toolbox and segmented into GM, WM, and CSF. Default options were used in the estimation. After preprocessing, data quality and segment accuracy were checked by using two functions in the VBM toolbox: “displaying one slice for all images” and “checking sample homogeneity using covariance.” Total GM, WM, and CSF volumes were generated by VBM8. ICV was calculated by adding GM, WM, and CSF (ICV = GM + WM + CSF). Further details on the employed MRI scanners, sequences, and processing strategies have been provided elsewhere (82). Associations of GRSs with VBM were examined blindly in the R environment (80), version 4.0.2. Sex and age were included as covariates of no interest to adjust for potential effects of these variables on brain volume. Before the association analysis, 10 principal components of whole-genome data and genotyping batch indicator for genotyping chip types were projected out from the original GRSs using linear regression in R. Additional analyses were performed stratifying by sex. In all analyses, we report two-sided P values, except in the analysis on the relationship of PlacGRS1 and 2 with intracranial volume in patients with schizophrenia, based on the directionality of the findings in neonates (Figs. 1 and 3 and SI Appendix, Table S2).
We tested whether the genes mapping to the loci showing the strongest association with autism, ADHD, IQ, type 2 diabetes, BMI, height, major depression, and BD are enriched among the genes differentially expressed in placental samples from complicated pregnancies compared with controls, as we did in our previous work on schizophrenia (14). The placental gene expression datasets used for these analyses have been previously described (14), and they include eight datasets, with a comparison of control versus diseased (preeclampsia and IUGR) placenta cells (83848586878889–90), and one dataset on normal cultured cytotrophoblasts induced into different states of invasiveness (91). In each dataset, we dropped probes that map to multiple genes and, when more than one probe per gene was present, we selected the one with the highest mean expression. We used the function eBayes in the R package limma (92) to attribute a moderated t statistic to each gene related to differential expression (using the covariates provided by each reporting group); then, we applied the geneSetTest function on the moderated t statistics (results are reported in SI Appendix, Table S13) testing whether the selected sets of genes (that is, the genes in the GWAS loci with the most significant association with the disorders or traits) tend to be more highly ranked in differential expression compared with randomly selected genes of the same set size from the other GWAS loci. To have comparable gene sets, the genes mapping to the first 238 loci showing the strongest association with the disorders and traits were included in each gene set, as we did for schizophrenia (14) (where the first 238 loci correspond to the loci with an association with the disorder with GWAS P < 1e-06).
We investigated whether the placenta-enriched genes that uniquely map to the schizophrenia-risk loci, and are not contained in the placental gene sets of other disorders and traits, are enriched for particular biological features. These specific placental gene sets correspond to the 66 PlacGRS1 genes and 108 PlacGRS2 genes, also represented in the last bars of the UpSetR plots of Fig. 4A and SI Appendix, Fig. S4. Data were analyzed through QIAGEN’s Ingenuity Pathway Analysis (https://www.qiagen.com/ingenuity). The software determines the pathways and biological processes enriched for a given set of genes by considering the number of focus genes that participate in each process and the total number of genes that are known to be associated with that process in the selected reference set. We performed the Ingenuity Pathway Analysis “core” analysis, using default parameters (reference set: Ingenuity Knowledge Base; relationships: direct and indirect; node types: all; data sources: all; confidence: experimentally observed and high; species: human, mouse, and rat; tissues and cell lines: all; mutations: all). We chose a P-value calculation based on the Benjamini–Hochberg method of accounting for multiple testing in the canonical pathway and functional analyses.
We are grateful to the Lieber and Maltz families for their visionary support that funded the analytic work of this project. We thank all of the participants in the study and their families. We thank the Psychiatric Genomics Consortium for providing the statistics for GRS calculation, and Thomas F. McNeil for providing the scale for ELC scoring. We also thank all the authors of the publicly available placental datasets that have been used in this study; Richard Straub for his thoughtful review of the data and manuscript; and Giampiero Arciero and Marco Quartulli for helpful discussions. The collection of the genetic and MRI data for the sample of adult controls and patients with schizophrenia was supported by direct funding from the Intramural Research Program of the National Institute of Mental Health to the Clinical Brain Disorders Branch (PI: D.R.W.; Protocol 95-M-0150, NCT00001486, Annual Report ZIA MH002942-05). G.U. received partial support from P50MH094268. K.X. was supported by the Foundation of Hope for Research & Treatment of Mental Illness, a National Alliance for Research on Schizophrenia & Depression (NARSAD) Young Investigator Grant from the Brain & Behavior Research Foundation, and The John and Polly Sparks Foundation, Bank of America, Trustee.
To ensure reproducibility of our results, we report in Dataset S3 the set of SNPs used for the calculation of PlacGRSs and NonPlacGRSs, and in Dataset S4 the list of ELCs detected in our sample. The publicly available datasets used for gene set tests are accessible in the Gene Expression Omnibus (GEO) repository under the following accession numbers: GSE24129, GSE35574, GSE10588, GSE25906, GSE12216, GSE40182, GSE12767, GSE25861, and GSE65271. To protect the privacy of the study participants, the individual genetic, ELC and neurodevelopmental data generated and analyzed during this study are available from the corresponding authors on reasonable request.
1
2
3
4
5
6
7
8
9
11
12
13
14
15
16
17
18
19
20
21
22
23
24
25
26
27
28
29
30
31
32
33
34
35
36
37
38
39
40
41
42
43
44
45
46
47
48
49
50
51
52
53
54
55
56
57
58
60
61
62
63
64
65
66
67
68
69
70
71
72
73
74
75
76
77
78
79
80
82
83
84
85
86
87
88
89
90
91
92
 Placental genomic risk scores and early neurodevelopmental outcomes
 Facebook
 Twitter
 Linkedin
 Whatsapp

