
Contributed by Eric Rignot, November 2, 2020 (sent for review July 22, 2020; reviewed by Richard R. Forster and Janin Schaffer)
Author contributions: E.R. designed research; L.A. and J.M. performed research; L.A., M.W., J.M., and S.A.K. analyzed data; and L.A., J.K.W., and J.M. wrote the paper.
Reviewers: R.R.F., University of Utah; and J.S., Alfred Wegener Institute for Polar and Marine Research.
1L.A. and E.R. contributed equally to this work.
Oceanography and gravity data of northeastern Greenland reveal ocean temperature and bathymetry in front of Zachariae Isstrøm (ZI) and Nioghalvfjerdsfjorden (79N), which hold a 1.1-m sea level rise ice volume equivalent but underwent different evolutions. Subsurface, warm, salty water of Atlantic origin has easier access to ZI than to 79N because of bathymetric barriers. We reconstruct ice removal by the ocean at the grounding line and flotation retreat from thinning to explain the observed grounding line retreat since 1979. The agreement between observed and calculated retreat demonstrates that ocean thermal forcing is a major control on the glacier evolution, and undercutting of grounded ice must be included in numerical ice sheet models to reproduce the high rates of retreat.
Zachariae Isstrøm (ZI) and Nioghalvfjerdsfjorden (79N) are marine-terminating glaciers in northeast Greenland that hold an ice volume equivalent to a 1.1-m global sea level rise. ZI lost its floating ice shelf, sped up, retreated at 650 m/y, and experienced a 5-gigaton/y mass loss. Glacier 79N has been more stable despite its exposure to the same climate forcing. We analyze the impact of ocean thermal forcing on the glaciers. A three-dimensional inversion of airborne gravity data reveals an 800-m-deep, broad channel that allows subsurface, warm, Atlantic Intermediate Water (AIW) (+1.25○
Zachariae Isstrøm (ZI) and Nioghalvfjerdsfjorden (or 79 North Glacier, 79N) drain 12% of the Greenland Ice Sheet and contain enough ice to raise global sea level by 0.54 m and 0.57 m, respectively, for a combined 1.1 m (see Materials and Methods). They represent one of the three major submarine drainage basins in Greenland with the largest potential for sea level rise. The other two major marine basins are Jakobshavn Isbræ in central west Greenland (0.47 m sea level equivalent) and the Petermann and Humboldt glacier system in northwest Greenland (0.36 and 0.19 m sea level equivalent for a combined 0.55 m). In 2004, the floating extension—or ice shelf—of ZI started to disintegrate, following years of regional warming and decay, but the glacier did not speed up until the ice shelf collapsed in late 2012 early 2013 (1, 2). Meanwhile, 79N has remained relatively stable despite its exposure to the same climate forcing, which calls for an explanation.
The cause of the ZI ice shelf breakup has not been fully elucidated, but its timing coincides with the disappearance of the permanent sea ice cover that glued pieces of detached ice shelf together, previously known as the Norske Øer ice barrier (3). The ice barrier protected the ice shelf from thermomechanical breakup (4, 5) and explained why icebergs could get stranded in the fjords for decades before being flushed out on warmer-than-usual summers (6). The Norske Øer ice barrier disintegrated for the first time in the summer of 1997 (3), and then in the summers of 2001–2005, 2008, and 2010–2014 (7). Air temperature in this region warmed by 3.0 C from 1979 to 2017, or 0.08 C/y (8). Warmer air temperatures slowed sea ice growth and accelerated summer melt, which, in combination with wind action, destroyed the ice barrier (7).
The ZI ice shelf used to flow southbound into Jøkelbugten Fjord, with a slower-moving branch heading north toward Norske Trough (NT) along Schnauders Ø Island (Fig. 1). The northbound shelf severed from the rest of the shelf and is now stagnant. The southbound ZI shelf was a heterogenous ensemble of ice blocks glued by an ice mélange (9). In contrast, the 79N ice shelf has been homogeneous and anchored by a set of islands at its ice front (10).

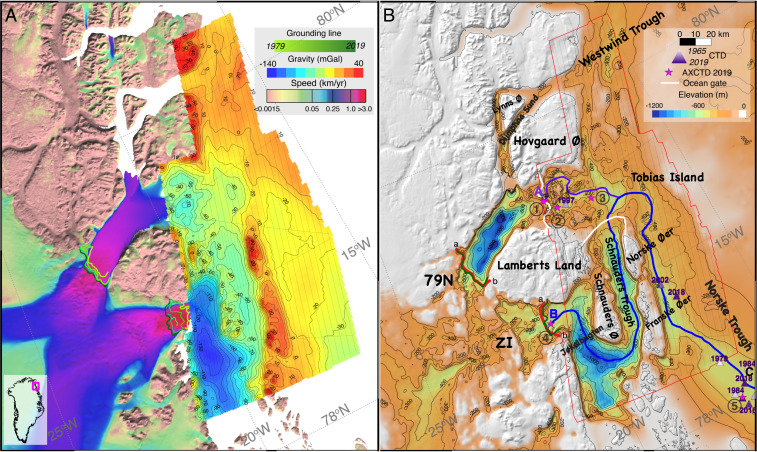
ZI and 79N glaciers, northeast Greenland with (A) OMG airborne gravity data (milligal) color coded from blue (−140 mGal) to red (+40 mGal) with 10-mGal contour levels, ice speed on the ice sheet color coded from brown (low speed) to blue and red (fast speed) (46), and grounding line positions color coded from year 1979 to 2019 and (B) bathymetry inferred from gravity inversion at sea and BMv3 on land with 200-m contour levels. AXCTD 1 through 5 are magenta stars labeled 1 through 5 (black circle). CTDs used to reconstruct thermal forcing in NT are colored triangles labeled with years. The ice thickness control lines are in red. Ocean flux gates are white. Longitudinal profiles used in Fig. 3 are purple (profile A-C) for 79N and blue (profile B-C) for ZI.
The source of ocean heat to the glaciers is North Atlantic Water, carried by the East Greenland Current, entering this sector from the south via the NT and circulating in a clockwise fashion from the southeast to the northwest (1112–13). NT carries Atlantic Intermediate Water (AIW) (14, 15) with a temperature greater than +C. Measurements conducted in a rift zone on the 79N ice shelf show that AIW is present in the cavity of 79N ice shelf (12). AIW resides below 250 m depth, overlaid by cold, fresh polar waters in the top 150 m. Shallow sills limit the access of AIW while deep troughs facilitate the access of AIW to the glaciers. Bathymetry controls the circulation of ocean heat.
AIW melts the ice shelves at rates that are orders of magnitude larger than surface melt rates: 5 m/y to 6 m/y on average for the entire ice shelf, 25 m/y within 10 km of the grounding line (16), and 50 m/y to 60 m/y near the grounding line of 79N (17, 18) versus less than 1 m/y at the surface. As more ocean heat reaches the cavity, ice shelf melt increases. As air temperature warms up, the ice mélange that glues together ice shelf pieces melts away, and the ice shelf breaks up (4). The breakup reduces resistance to flow, the glacier speeds up, it thins as a result, and ice reaches flotation sooner; that is, the grounding line retreats. Once a glacier loses its ice shelf, it terminates with a vertical calving cliff. Ocean models and multibeam echo sounding observations show that, in that configuration, ocean waters undercut the glacier, as melt rates are largest near the ice cliff base (19, 20). When an ice shelf is present, we do not know how fast ice melts at the grounding line or what the shape of the cavity looks like. Here, we hypothesize that ice is removed at the grounding line of an ice shelf at nearly the same rate as in the case of a vertical wall (Fig. 2).
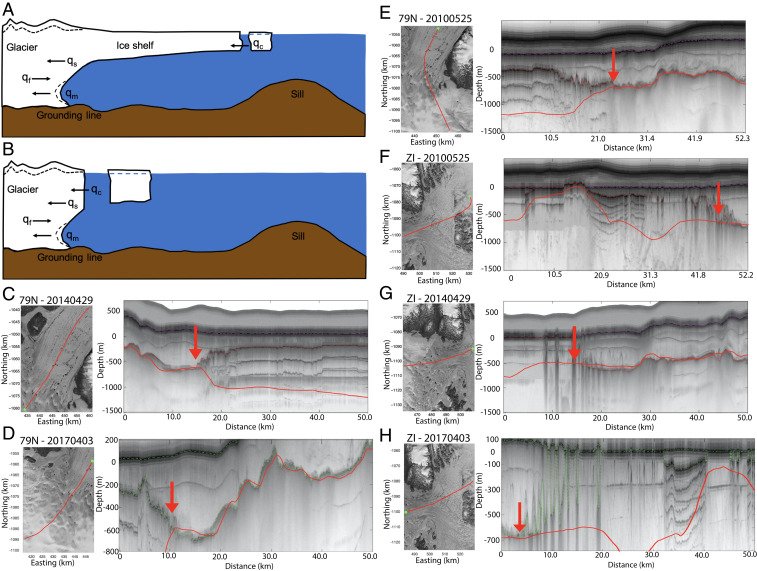
Schematic of ice shelf and glacier melt into the ocean with incoming ice flux, , iceberg calving rate, , grounded ice removal by the ocean or undercutting, , and thinning-induced retreat rate, . (A) For a glacier with an ice shelf, does not remove grounding ice. (B) For a glacier with no ice shelf, may remove grounded ice blocks. (C–H) Radar sounder echograms collected by NASA OIB (47) with surface and bed picks (red dots) on top of the new bed topography (red line) in C–E for 79N and in F–H for ZI with location of the radar tracks on the left (green dot indicates data start), and grounding line location (red arrow). Note the steep slope of the ice draft at the grounding line. Dashed line in A and B indicates the impact of qs and qm on the surface elevation and ice draft, respectively.
To quantify ice–ocean interactions and their impact on glacier evolution, we need information about ocean temperature and bathymetric controls on the delivery of ocean heat to the glaciers. In this part of Greenland, glacial fjords have not been mapped completely. Here, we employ airborne gravity data collected in 2016 by the NASA mission Oceans Melting Greenland (OMG) to infer the bathymetry in front of ZI between Jøkelbugten and NT on the eastern flank of Schnauders Ø Island. We use the results in combination with a time series of ocean temperature data to reconstruct ocean thermal forcing over the last 41 y. We then use an ocean model to estimate the rate of grounded ice removal by the ocean and combine the results with the rate of grounding line retreat caused by ice thinning to determine whether we can match the rates of grounding line retreat observed independently with satellite data. We conclude on the recent and future evolution of this major sector of Greenland.
ZI is 20 km wide. Satellite imagery shows that the ice shelf area decreased from 706 in 1985 to 616 in 2002, and, subsequently, to 37 in 2014; 377 of the detached ice shelf remains in the fjord to the north of the glacier (Fig. 1). Between 2014 and 2019, we find that the ice front retreated 1.6 km to lose another 32 , leaving virtually no floating section. In ref. 21, we reported that the glacier speed increased from 1.2 km/y in 1979–1992 to 2.1 km/y in 2019, or 81% (22); the grounding line flux increased from 9.71 Gt/y in 1979 to 16.22 Gt/y in 2019, or 81%, versus a balance flux of 8.9 Gt/y; the mass loss averaged 5 Gt/y in 2009–2019 (SI Appendix, Table S1).
Glacier 79N is 20 km wide, with a speed that increased from 1.3 km/y in 1979 to 1.5 km/y in 2019, or 12%, and a grounding line flux that increased from 11.7 km/y to 13.1 Gt/y versus a balance flux of 9.6 Gt/y (21). The mass loss of 79N averaged 2 Gt/y in 1979–1990 and 4 Gt/y in 2009–2019.
ZI lost mass from enhanced flow but also from increased surface melt, which produces runoff. Runoff production reconstructed by the Regional Atmospheric Climate Model (RACMO)2.3p2 regional atmospheric climate model (23) increased from 1.50.3 Gt/y in the 1980s to 3.30.7 Gt/y in the 2010s, or 126%. A time series of surface elevation updated from ref. 21 indicates that ZI thinned at 0.8 m/y in the 1980s and 1990s and peaked at 3 m/y in 2012–2013, before turning into slight thickening in the last couple of years (SI Appendix, Table S1). For 79N, runoff production increased from 1.4 Gt/y to 4.8 Gt/y from 1979–1989 to 2009–2019, or 240%. The glacier thinned at 0.1 m/y in the 1970s, peaking at 1.0 m/y in 2010, with lower thinning in 2011–2017 and slight thickening in 2018–2019.
The glacier bed topography reconstructed from BedMachine Greenland (24) reveals a grounding line depth of 600 m in 1996 at the center of ZI and 79N and lower values toward the margin. Operation IceBridge (OIB) airborne gravity in front of the glacier revealed that Jøkelbugten Fjord is overdeepened, with 900 m depth about 75 km south of the grounding line. From 28 May to 30 June 2016, the OMG mission collected higher-resolution, airborne gravity data over the ocean between ZI and NT using the Sander Geophysics Ltd. AIRGrav deployed on a Cessna Grand Caravans 208B from the airports of Kulusuk and Station Nord (25). The survey was conducted at 110 knots, with a ground clearance of 150 m, 2-km spacing inshore, and 4-km spacing offshore (Fig. 1). Onboard receivers were NovAtel OEMV-3, while the reference station used a NovAtel OEM4 GPS receiver. Outer lines were gridded at 1-km grid cell size versus 500 m for inner lines. The data were filtered with a 1-km half-wavelength filter with an rms error of 1.5 mGal.
We employ the Geosoft GM-SYS 3-D with Parker’s method (26) to minimize the misfit between calculated and observed gravity. The model domain has three horizontal layers: 1) a solid ice layer with a density of 0.917 g/, 2) an ocean water layer with a density of 1.028 g/, and 3) a rock layer with a density of 2.67 g/. A forward model of the gravity is calculated using the bed elevation from BedMachine v3 (BMv3) (24) and new bathymetry measurement in front of 79N (10, 27) (SI Appendix, Fig. S2). We calculate the direct current (DC) shift, or offset between modeled and observed gravity in areas where bed elevation is known from conductivity, temperature, and depth (CTD), BMv3, or multibeam soundings. We interpolate the DC shift onto a regular grid using a minimum curvature algorithm, correct the observed gravity with the interpolated DC shift, fill the data gaps with the model results, and invert the resulting gravity field where bed elevation is not known (28). The interpolation of the DC shift accounts for natural variations in underlying geology across the model domain caused by variations in crustal thickness, sedimentary basins, or intrusions. The inversion stops when the misfit between observed and modeled gravity is less than 0.1 mGal (SI Appendix, Fig. S3).
The results reveal an 800-m-deep trough between Schnauders Ø Island and Norske ØER. Jøkelbugten Trough shallows to the south near a set of islands. The new trough, named here Schnauders Ø Trough (ST), connects with NT and the channels leading to 79N. ST has a maximum depth of 800 m versus 1,100 m for Jøkelbugten Fjord and a minimum depth of 350 m at two sills (Fig. 3B).
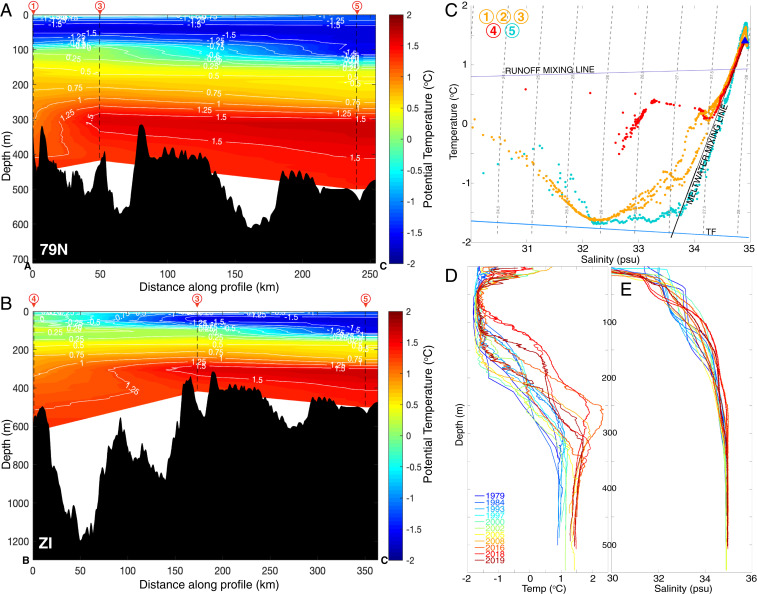
Longitudinal profiles of ocean temperature color coded from blue (–C) to red (+C) with 0.C contour level for (A) 79N (profile A-C, purple in Fig. 1) and (B) ZI (profile B-C, blue in Fig. 1) with sea floor in black, and areas with no water temperature data in white. AXCTD 1 to 5 locations are indicated with a triangle and number (red). Temperature data (C) from AXCTD 1 to 5 with Gades melt water line and runoff line, and (D) from historical CTD data (SI Appendix, Fig. S1) in NT for years 1965–2019 with (E) salinity in practical salinity units (psu).
In the summer of 2019, NASA’s OMG mission deployed Airborne Expendable CTD (AXCTD) ocean probes in front of ZI (29). Additional AXCTD data were collected on a NASA Gulfstream III aircraft in September to October 2016, C-130 Hercules in October 2017, a Basler DC-3 Turbo Prop in September 2018, and a Basler BT-67 in September 2019. AXCTD accuracy is C for temperature and 2% for depth. The probe in front of ZI reached 627 m depth, with a bottom temperature of 1.C (Fig. 3). The probe in the deepest part of 79N reached 453 m depth, with a bottom temperature of 1.C.
At AXCTD 1 to 5, the temperature/salinity relationship indicates a mixture of warm AIW at 1.C and 35 psu with ice shelf melt water along the Gades meltwater mixing line. At AXCTD 4 at the front of ZI, we detect a strong runoff signal consistent with the presence of a plume of subglacial water (Fig. 3). We complement the CTD data with Estimating the Climate and Circulation of the Ocean (ECCO) model annual averages between 1992 and 2011 (see Materials and Methods) (30, 31). The rms error between CTD and ocean model is 0.55 C.
To visualize the influence of bathymetry on ocean temperature, we use the line of lowest elevation through the trough systems starting from the grounding line to the middle of NT (Fig. 3). Bed elevation rises to 350 m depth about 170 km from ZI at the junction between ST and NT, followed by a second sill at the same depth common to ZI and 79N at the junction with NT. For 79N, the bed elevation is deepest at the center of the calving front (480 m) but is limited by an upstream sill with a depth of 325 m (10). In contrast, ST offers a broader, 25-m-deeper pathway for AIW to reach ZI. Water temperature of 1.C in NT below 300 m depth is blocked by the first sill at AXCTD 3. Water at 1.C reaches only the second sill in front of 79N but reaches the ZI grounding line. The temperature of AIW changes little from AXCTD 1 to 5; that is, subsurface ocean waters are transferred with relatively low heat loss toward the glacier fronts.
Historical CTD data spanning 1965 to 2019 collected in the inner shelf of NT where AIW circulates (13) document the evolution of ocean temperature below the surface and above the main sills (Fig. 3 and SI Appendix, Table S2). We calculate ocean thermal forcing, , as the depth-integrated difference between the in situ temperature of the ocean and the pressure-dependent and salinity-dependent freezing point of seawater. We integrate at two ocean flux gates, one located at the mouth of 79N ice shelf and one located at the northern entrance of ST (Fig. 1). We estimate thermal forcing in the lower 40% of the water column to have increased by 1.30.5 C for both glaciers in 1965–2019, with significant interannual variability in between. The thermocline rose 10050 m from 1965–1979 to 2016–2019.
From , water depth, and subglacial discharge, we calculate a rate of grounded ice undercutting, , using a parameterization derived from high-resolution (1 m) modeling of ice melt along a vertical wall by the Massachusetts Institute of Technology General Circulation Model (MITgcm) ocean model in three dimensions (32) (see Materials and Methods). Subglacial water discharged is imposed at the grounding line as a source of freshwater. Boundary conditions for the ocean model include temperature and salinity versus depth several kilometers away from the grounding line. Ice melt is predicted by the model to be uneven, with peak rates 30 m to 50 m above the sea floor and lower rates toward the surface (Fig. 2). The uneven distribution of melt yields glacier undercutting which has been confirmed in situ with multibeam echo sounder data in west Greenland (20, 33) and Alaska (34). Undercutting has not been observed at ice shelf grounding lines, but we note that radar echograms reveal sharp transitions in ice thickness at that location, on multiple years, and at multiple locations (Fig. 2). Radar echograms cannot reveal cavity shapes, however, because radar signals do not penetrate seawater.
Undercutting of grounded ice by the ocean directly affects the glacier force balance. Ice above the area of removal will not be supported by basal friction, hence will offer no resistance to flow. Ice below the area of removal will be too thin to provide basal resistance. Undercutting of grounded ice therefore directly reduces basal resistance to flow. To illustrate its importance, let us assume a basal drag of 100 kPa or 100 kN/ at the grounding line and, similarly, a lateral drag of 100 kPa along the sides of an ice shelf. A 1-km retreat of a 20-km-wide glacier will reduce the buttressing force by 2,000 GN. For comparison, a 20-m thinning of a 50-km-long ice shelf will reduce the buttressing force by only 200 MN. The total removal of a 50-km-long, 300-m-thick ice shelf will be necessary to reduce the buttressing force by 3,000 GN. In terms of force balance, a 1-km retreat of the grounding line is therefore equivalent to the complete loss of a long ice shelf.
Using our ocean model, we calculate that increased from 10828 m/y in 1979–1989 to 185 m/y in 2009–2019 for ZI. For 79N, increased from 52 m/y in 1979–1989 to 10026 m/y in 2009–2019. These values, which are averages across the glacier width, are comparable to that reported near the grounding zone of 79N (17).
To quantify the impact of undercutting on the glacier retreat, we use a reference state, , when the glacier was in steady state. For 79N, thinning was small in 1979 (0.1 m/y), and the glacier was not speeding up, so we use year 1979 as a reference. We calculate a cumulative of 1.7 km in 1979–2019. For ZI, ice thinning was 0.6 m/y in 1979, which is significant. The water temperature was 0.C cooler in 1965 compared to 1979, which could be due to seasonal differences, since the CTD was collected in winter, or express colder ocean conditions prior to 1979 (13). Using the 1965 reference for ZI, we calculate of 59 m/y (vs. 80 m/y in 1979–1980) and a cumulative of 3.5 km in 1979–2019.
Thinning-induced retreat, , is deduced from the observed glacier thinning and calculated, time-dependent bed and surface slopes from BMv3 (SI Appendix, Fig. S4). The increased from 10427 m/y in 1979–1989 to 21756 m/y in 2009–2019 for ZI, yielding a of 7.6 km for 1979–2019 ( = 0). For 79N, increased from 277 m/y in 1979–1989 to 5215 m/y in 2009–2019, yielding a of only 2.1 km for 1979–2019, because the glacier retreated along prograde slopes (bed elevation rises in the inland direction) instead of retrograde slopes for ZI.
Ice thinning includes enhanced surface melt from warmer air temperature and dynamic thinning from flow acceleration. In 41 y, ZI thinned by 497 m at the thickness line used for ice fluxes (Fig. 1). At that location, changes in surface mass balance relative to the reference period 1961–1990 resulted in a cumulative surface lowering of 51 m, or 10 times lower than observed (SI Appendix, Fig. S4). Most of the thinning is therefore of dynamic origin. For 79N, total thinning averaged 122 m versus 81 m from surface mass balance; that is, surface mass balance dominates, consistent with its more steady flow.
Grounding line retreat, , has been observed using differential radar interferometry (InSAR) since 1992 on 79N, 1996 on ZI (35), and 2000, 2011, and 2014 on both glaciers to reveal a rapid retreat for ZI versus a slow retreat for 79N (21). To complement this record, we use a digital elevation model (DEM) from year 2001 (36) to calculate where ice first reached hydrostatic equilibrium, which is a proxy for the grounding line position. We select a firn depth correction (7 m) to transform ice surface elevation into solid-ice equivalent thickness that best fits the DEM-derived grounding line and the InSAR-derived grounding line in 2001. We verify the reliability of the 7-m firn correction by comparing the results of a DEM from 2015 with the SAR-derived grounding line from 2014. We then apply the same firn correction to a DEM from 1978 (37) and to ICESat-2 data from 2019 to derive the grounding line locations in 1978 and 2019, respectively. The grounded ice loss estimated from these data totals 217 for ZI and 130 for 79N from 1979 to 2019, which translates into a linear grounding line retreat of 13 km for ZI and 4.4 km for 79N, with an uncertainty of 500 m (Fig. 4).
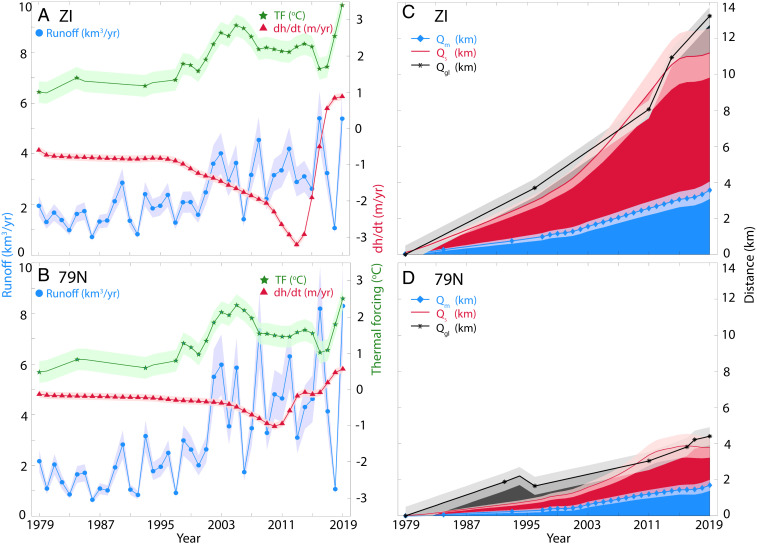
Evaluation of the components of the grounding line retreat of (A and C) ZI and (B and D) 79N, Greenland. (A and B) Time series of runoff production, , (cubic kilometers per year, blue, left scale), thermal forcing, (degrees Celsius, green, right scale) and change in surface elevation, , (meters per year, red, right scale) for (A) ZI and (B) 79N. (C and D) Cumulative anomaly in glacier undercutting, , (kilometers, blue), cumulative thinning-induced retreat, , (kilometers, red) versus the observed grounding line retreat, , (kilometers, black) with SE in light color for (C) ZI and (D) 79N for the years 1979–2019. If the components are correct, + should balance .
Mass conservation at the grounding line dictates that the observed grounding line retreat, , results from three physical processes: 1) grounded ice undercutting, , above equilibrium conditions; 2) thinning-induced retreat, , caused by surface melt and increases in flow speed; and 3) calving of grounded ice blocks, , if applicable (Fig. 2). The cumulative grounding line retreat, , balances the cumulative anomaly in undercutting, , cumulative thinning-induced retreat, , and—if applicable—the cumulative calving of grounded blocks, . and are in meters and meters per day, respectively, and are positive when forcing a grounding line retreat.
On ZI, we observe a grounding line retreat of 200 m/y in 1979–1989 and 550 m/y in 2009–2019, for a of 13.2 km. Compared with the estimates of undercutting and thinning, 30% of the retreat is caused by , 58% by , and 12% is an error or after 2014. For 79N, the grounding line retreated at 131 m/y in 1979–1989 and 149 m/y in 2009–2019 for a total of 4.4 km. Compared with our calculations, 39% of the retreat is due to , 47% to , and 14% to errors. The agreement between calculations and observations is therefore excellent for both glaciers. If undercutting by the ocean were ignored, the effect of ice thinning would only explain half of the observed retreat on 79N and ZI. In the absence of grounded ice removal by the ocean, the grounding line retreat would be significantly underestimated.
The impact of AIW in Greenland has been documented on other glaciers, for example, Jakobshavn Isbræ (38), mostly qualitatively and not including undercutting of grounded ice as a forcing mechanism. At Jakobshavn, a 250-m-deep sill at the fjord entrance limits the access of AIW to the cavity. A similar bathymetric barrier protects the full access to AIW into the 79N cavity. In addition, the grounding line of 79N stands on prograde bed slopes (2), which decreases the sensitivity to ice thinning. In the next decade, the grounding line of 79N will start retreating along retrograde bed slopes, which will accelerate the retreat. The grounding line of ZI already retreats along retrograde bed slopes, which extend another 10 km to 20 km, so ZI will continue retreating for several decades.
For 79N, the agreement (14%) between observed and calculated and provides confidence in the component approach despite uncertainties in observed thinning, bed and surface slopes, ocean temperature, modeled undercutting, and reference state . For ZI, the 12% error is small and attributed due to uncertainties. It is unlikely that contributed to the retreat, due to the nature of calving mechanisms on ZI. Most detached blocks are tabular icebergs, recognizable as much wider and longer than thick. Tabular icebergs detach from an ice front when already afloat. As such, they should not remove grounded ice. Icebergs calving farther south in warmer parts of Greenland are narrower and shorter, and tend to roll over when they detach from the ice front and remove some grounded ice.
We have no direct evidence for undercutting at the grounded line of an ice shelf. Radar echograms reveal steep ice draft slopes at the grounding line (Fig. 2), but imaging cavities requires multibeam acoustic echo sounding techniques. If the ice shelf draft is almost horizontal, water circulation will be impaired, and the entrainment speed of the melt water plume will be lower than along a vertical wall (39). Here, we assume that the process is as efficient as for a vertical wall. While we are able to match the glaciers’ retreat, this could be viewed as a coincidence. Yet, if we do not include grounded ice removal by the ocean, glacier thinning only explains half of the observed retreat.
The buttressing force exerted by the ice shelf on ZI was probably small prior to 2014, because the ice shelf was located at the mouth of a bay with diverging walls. Indeed, the ice shelf started to disintegrate around 2004, but, for many years, the glacier accelerated only slowly (2). We conclude that undercutting has been the main driver of the grounding line retreat, with a modulation from bathymetric barriers between ZI and 79N. The difference in bathymetric barriers between ZI and 79N explains, in part, their different evolution.
At present, most ice sheet numerical models used to project sea level rise from Greenland do not include undercutting of grounded ice for glaciers (40). Realistic ocean thermal forcing requires a precise bathymetry combined with higher-resolution (1 km) ocean modeling than currently available from global ocean models (41). Ice sheet models have difficulties matching the observed rates of retreat. We recommend including processes of grounded ice removal in order to replicate the observed high retreat rates. To achieve this goal, it is necessary to complete bathymetry mapping around Greenland and better quantify trends in ocean water temperature and salinity. The same observations apply to Antarctica, where the role of the ocean is even more critical than in Greenland.
Using BMv3, the volume of ice, , in the drainage basins of each glacier above flotation is converted into a sea level equivalent after a change of density from = 917 kg/ (ice density) to = 1,028 kg/ (seawater density) (i.e., × ) divided by the mass of ocean water equivalent to 1 mm of sea level rise (362 Gt), minus the volume of ice below flotation diluted from ice to seawater ( × ()/)), divided by 362 Gt, a smaller number. We find 0.54 m for ZI (−0.002 m for dilution) and 0.57 m for 79N (−0.004 for dilution). Flotation is from the freeboard height, , where is bed elevation (42).
Runoff, , is reconstructed with the RACMO2.3p2 downscaled to 1 km (43) from 1958 to 2019. We integrate runoff production over the drainage basin of each glacier to obtain a flux in cubic meters per day and annual production in gigatons per year. We divide the annual flux by the cross-section of the ocean flux gate (8,986,662 for ZI and 6,081,095 for 79N) to yield an area average speed of subglacial discharge, , in meters per day. The varies from 0.60 m/d to 1.64 m/d for ZI during 1979–2019 and from 0.98 m/d to 3.74 m/d for 79N (SI Appendix, Table S1).
Ocean thermal forcing, , is from 19 CTDs from 1965 to 2019 in NT (SI Appendix, Fig. S1 and Table S2). In 2019, we estimate the fraction of ocean temperature below 300 m transmitted from NT to the ice fronts to be 91.6% for 79N and 90% for ZI. We use this transfer coefficient to scale the NT temperature to a temperature equivalent at the ice fronts. The ocean gate is located at the mouth of the ice shelf front for 79N (10) and at the northern entrance of ST for ZI. TF and are calculated across the ocean flux gates over the lower 40% of the water column, because high-resolution modeling of ice–ocean interactions indicates that it is the lower 40% of the water column that controls thermal forcing. To complement the CTD data, we use two ECCO project model outputs: 1) a high-resolution (4 km) forward model of the Arctic from an initial state for the period 1992–2011 (30) and 2) a medium-resolution (13.5 km) global domain solution for 2001–2017 (LLC270) (31). The two solutions are calibrated using CTD data to remove an absolute bias and a linear trend in temperature.
Grounded ice undercutting, , is calculated based on high-resolution (1 m), three-dimensional simulations of a melt plume using the MITgcm ocean model with varying water depth, b, subglacial discharge, , and thermal forcing, , as = (0.0003 b + 0.15) (19). We integrate across the ocean flux gates using the same temperature data. The uncertainty in is 20%, is 5%, is 0.55 C, and the uncertainty associated with the spatial distribution of subglacial discharge across the ice face is 15% (19), yielding a nominal uncertainty in width-averaged of 26%. Error in progresses as the square root of the number of years. We derive a time series of cumulative undercutting, , which adds up to 3.5 km for ZI and 1.7 km for 79N.
Thinning-induced retreat, , is deduced from a time series of elevation based on DEMs from 1978 (37), 2001 and 2006 (36), and 2015–2016 (44), combined with airborne altimetry from NASA’s OIB spanning 1993 to 2019 and a time series of ice velocity (21) (SI Appendix, Fig. S4). We calculate ice thinning averaged across the glacier width, bed slope, , and surface slope, , at the glacier center over several ice thicknesses to convert the rate of ice thinning, , into a rate of flotation retreat, = / ([1 – /] – ) (45) in meters per year. The cumulative thinning-induced retreat, , totals 7.6 km for ZI and 2.1 km for 79N from 1979 to 2019. DEM have a 1- to 2-m noise level over 80-m peak thinning, or 2%. Average thinning is 10 m/y, hence 15%. The noise in bed and surface slopes is 10%, yielding an error in Qs of 18% for ZI and 25% for 79N.
This work was performed in the Department of Earth System Science, University of California, Irvine, and at California Institute of Technology’s Jet Propulsion Laboratory under a contract with NASA.
All study data are included in the article and SI Appendix. The airborne gravity data and AXCTD used for this study are publicly available at California Institute of Technology’s Jet Propulsion Laboratory (omg.jpl.nasa.gov). Radar profiles are available at the Center for Remote Sensing of Ice Sheets, the University of Kansas (data.cresis.ku.edu). Ice velocity data from the MEaSUREs are available at the National Snow and Ice Data Center (NSIDC) in Boulder, CO. BedMachine Greenland is available at NSIDC. Other data (ice front, ocean gate, CTD) are available in Dryad at https://doi.org/10.7280/D19987.
1
2
3
4
5
6
7
8
9
10
11
12
13
14
15
16
17
18
19
20
21
22
23
24
25
26
27
28
29
30
31
32
33
34
35
36
37
38
39
40
41
42
43
44
45
46
47
 Ocean melting of the Zachariae Isstrøm and Nioghalvfjerdsfjorden glaciers, northeast Greenland
 Facebook
 Twitter
 Linkedin
 Whatsapp

