
 ,
Mo Baikoghli,
Juha A. E. Määttä,
R. Holland Cheng,
Bernhard Wehrle-Haller,
Vesa P. Hytönen,
Jinhua Wu
,
Mo Baikoghli,
Juha A. E. Määttä,
R. Holland Cheng,
Bernhard Wehrle-Haller,
Vesa P. Hytönen,
Jinhua Wu
Edited by Janet L. Smith, University of Michigan–Ann Arbor, Ann Arbor, MI, and approved October 28, 2020 (received for review July 10, 2020)
Author contributions: B.W.-H., V.P.H., and J.W. designed research; P.Z., L.A., S.K., T.G., M.B., M.-C.J., Y.S., J.A.E.M., R.H.C., B.W.-H., V.P.H., and J.W. performed research; J.W. contributed new reagents/analytic tools; P.Z., L.A., S.K., T.G., M.B., M.-C.J., J.A.E.M., R.H.C., B.W.-H., V.P.H., and J.W. analyzed data; and P.Z., S.K., T.G., J.A.E.M., R.H.C., B.W.-H., V.P.H., and J.W. wrote the paper.
1Present address: Cancer Center at Renmin Hospital of Wuhan University, Wuhan 430062, China.
2S.K., T.G., M.B., and M.-C.J. contributed equally to this work.
Although efforts have been made to determine the structure of talin and the way it interacts with integrins through the “head” domain, our work shows now that many of the previous mechanistic models based on the talin adapter are likely to be misleading as they are constructed on a crystal structure representing an improperly folded talin head domain. In this work, we identified the problem with the current talin head model and proposed a FERM-folded talin head. By analyzing these structural features of the FERM-folded talin head in a cellular context, involving also the kindlin adapter, we are making a critical and unprecedented contribution to the understanding and regulation of cell-matrix adhesions.
Binding of the intracellular adapter proteins talin and its cofactor, kindlin, to the integrin receptors induces integrin activation and clustering. These processes are essential for cell adhesion, migration, and organ development. Although the talin head, the integrin-binding segment in talin, possesses a typical FERM-domain sequence, a truncated form has been crystallized in an unexpected, elongated form. This form, however, lacks a C-terminal fragment and possesses reduced β3-integrin binding. Here, we present a crystal structure of a full-length talin head in complex with the β3-integrin tail. The structure reveals a compact FERM-like conformation and a tightly associated N-P-L-Y motif of β3-integrin. A critical C-terminal poly-lysine motif mediates FERM interdomain contacts and assures the tight association with the β3-integrin cytoplasmic segment. Removal of the poly-lysine motif or disrupting the FERM-folded configuration of the talin head significantly impairs integrin activation and clustering. Therefore, structural characterization of the FERM-folded active talin head provides fundamental understanding of the regulatory mechanism of integrin function.
Integrins are heterodimeric adhesion receptors that mediate cell adhesion and migration (1, 2). Abnormal expression and hyperactivity of integrins lead to severe pathological phenotypes, including cardiovascular diseases (CVDs), impaired inflammatory responses, T cell proliferation defects, and enhanced tumor metastasis (3, 4). Activation of integrins is driven by the intracellular association of the activator talin and its coactivator kindlin through a so-called inside-out integrin activation pathway. This pathway is induced by the activation and talin head interaction of RAP1 GTPase and, in lymphocytes, requires RAP1 effector molecule RAP1-interacting adaptor molecule (RIAM) to mediate the translocation of talin to the plasma membrane (56–7).
Talin is a multidomain, homo-dimeric protein. This 270-kDa molecule can be divided in a four-subdomain head segment and a rod region containing 13 domains consisting of four or five helical bundles with a C-terminal dimerization helix (8910–11) (Fig. 1A). The talin N-terminal head domain (residues 1 to 433, defined by calpain II cleavage) contains two ubiquitin-like subdomains (F0 and F1), an acyl-CoA–binding protein-like subdomain (F2), and a phosphotyrosine binding-like, integrin-binding subdomain (F3), followed by a linker that is cleaved by calpain II processing (10).

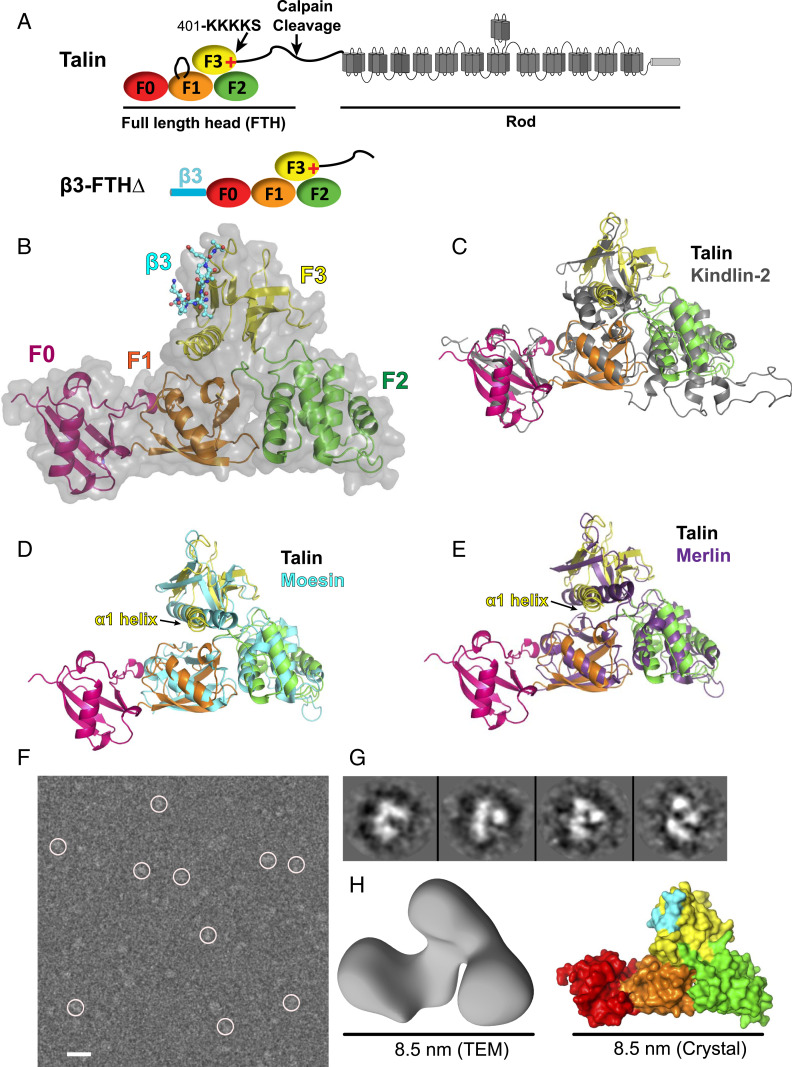
Crystal structure of talin head in a FERM-folded configuration. (A, Upper) Schematic domain structure of talin. The poly-lysine motif at the end of the F3 subdomain is indicated by a red “+” mark. (A, Lower) Schematic structure of the β3-FTHΔ fusion protein. (B) Overall structure of β3-FTHΔ. The talin head is shown in schematic and surface. The F0 domain is red. The F1, F2, and F3 subdomains of the FERM domain are in orange, green, and yellow, respectively. Bound β3 is shown in stick representation. (C–E) Superposition of the talin head, in the same color scheme as in B, and various FERM proteins. (C) The talin head with kindlin-2 (gray). (D) The talin head with moesin (cyan). (E) The talin head with merlin (purple). (F) Field view of negatively stained talin head t1-405 captured by TEM. (Scale bar: 10 nm.) (G) Shown are 2D class average images. (H, Left) A 3D TEM volume of t1-405. Resolution, 15.2 Å. (H, Right) Surface representation of the talin head in the crystal structure.
Sequence analysis indicates that the talin head possesses a FERM domain (residues 84 to 405). FERM domain proteins are often found in proteins that link different functionalities to the plasma membrane, such as the binding to the actin cytoskeleton (myosin-VII and -X, moesin, ezrin...), or kinases (FAK), and bind to transmembrane receptors as adaptor molecules (ICAM, CD44, etc.) (12, 13). FERM domain proteins share a conserved and compact cloverleaf-like fold of three subdomains (F1, F2, and F3) that have been shown by X-ray crystallography for several members of the family, including kindlin-2, a coactivator of integrin and most homologous to talin (14). Interestingly, unlike a typical FERM domain, a functionally impaired 1 to 400 talin fragment, missing the loop in the F1 subdomain (del139–168), as well as the C-terminal poly-lysine motif in the F3 domain, has been crystallized in an elongated conformation (15, 16). However, small-angle X-ray scattering experiments with this truncated construct have indicated that the talin head exists in an equilibrium of open and partially closed conformations in solution (15), proposing a flexible head domain. Moreover, recent electron microscopy (EM)-based studies of full-length talin-1 have revealed either a compact, autoinhibited talin-dimer (17) or, alternatively, a more open conformation of the talin monomer, in which however the F0-F1 head domains could not be localized or identified (18). Therefore, the structure of the biologically active talin head domain is still not known.
In addition to talin, knockout studies of kindlin-1, -2, and -3, as well as patients with kindlin-3 deficiencies, have shown that kindlins are also required for integrin activation and clustering (1920–21). However, in most experimental settings, a sufficient amount of endogenous kindlin is present in cells, and, hence, integrins have been shown to be activated by talin head overexpression (22). In addition to integrin activation, the expression of the talin head induces integrin clustering (23), which required the membrane proximal interactions of a hydrophobic (24) and acidic (D723/E726) motif in β3-integrins to interact with basic residues (K316/K324) in the talin F3 subdomain (25). In addition, other basic residues of the F2 and F3 subdomains interact with acidic membrane lipids, such as phosphatidylinositol 4,5-bisphosphate (PIP2), to stabilize the integrin/talin complex at the plasma membrane (25, 26). Hence, due to their integrin and lipid interactions, the talin head subdomains F2-F3 are sufficient for activation of αIIbβ3 integrin, when recorded with the PAC-1 antibody in detached cells (22). Interestingly, however, the F2-F3 segment of the talin head failed to activate α5β1 integrin, when probed with a soluble fibronectin fragment (27), proposing that, at least in the latter case, soluble ligand binding requires the entire talin head domain, potentially involving an additional lipid-binding domain in the F1 subdomain (28). In addition, RAP1 binding to the F0 and/or F1 subdomains of the talin head has been proposed to recruit talin to the plasma membrane, contributing to integrin activation and Rap1-mediated cell-matrix adhesion (25, 26, 29). Thus, talin, RAP1, and kindlin play important roles in the integrin activation step while kindlin also induces clustering of activated integrins (303132–33).
Talin is so far the only FERM family protein that has not been shown to fold into a conserved cloverleaf-like shape. Here, we present a crystal structure of the full-length talin head with an F1-loop deletion in complex with the β3-integrin cytoplasmic tail. The structure reveals that the F1-F2-F3 subdomains of the talin head indeed adopt a canonical FERM-like fold. The complete C-terminal helix in F3, including the poly-lysine motif, stabilizes the compact FERM conformation by interaction with the F1 subdomain and simultaneously contributing to a hydrophobic cavity suitable to accommodate the Leu746 of the N-P-L-Y motif of the β3-integrin. Removal of the C-terminal poly-lysine motif of the F3 subdomain leads to reduced affinity with β3-integrin, decreased thermal stability of the talin head, and impaired integrin activation and clustering. The FERM fold of the entire talin head is further confirmed by transmission electron microscopy (TEM) and charge-complementation mutagenesis at the interface between the F1 and F2 subdomains. Together, our results reveal a physiologically functional and structurally stable talin head in a FERM-folded configuration, which ensures a tight association with integrin β tail for integrin activation and clustering.
In order to better understand the physiological roles of the F0-F1 domains and C-terminal basic residues for talin-mediated integrin activation and clustering, we initiated a structural approach to determine the crystal structure of the talin segment representing the full-length talin head (FTH), when generated by natural cleavage of talin by calpain (residues 1 to 433) (34). To facilitate crystallization, we removed the calpain binding site (residues 431 to 433) and the F1-loop (residues 139 to 168, subsequently indicated as del30). The resulting talin head construct, FTHΔ, which failed to yield crystals, was then fused with a peptide derived from the cytoplasmic segment of integrin β3, known to contain the membrane proximal talin-binding N-P-L-Y747 motif (residues 720 to 750) (Fig. 1A). The resulting β3-FTHΔ fusion protein was expected to induce trans interaction of the β3 fusion peptide and the talin head to facilitate crystal packing, as well as to ensure an equal stoichiometry of the two segments. Crystals of the fusion protein were obtained by the hanging drop vapor diffusion method. The crystals belong to the space group of P212121 with one β3-FTHΔ molecule in each asymmetric unit. The structure of β3-FTHΔ was determined by molecular replacement to 2.8-Å resolution (Table 1). The N-terminal (residues 720 to 740 of β3) and C-terminal segments (residues 407 of 430 of talin) of the fusion polypeptide were disordered in the crystal. As expected, the F3 subdomain of one β3-FTHΔ molecule binds to the β3 segment from the neighboring molecule.

| Data collection | |
| Light Source | NSLS-II AMX |
| Wavelength, Å | 0.92010 |
| Space group | P212121 |
| Cell dimensions | |
| a, b, c, Å | 66.07, 66.82, 114.47 |
| α, β, γ, ° | 90, 90, 90 |
| Resolution, Å | 29.62∼2.78 (2.85–2.78) |
| Rmerge, % | 8.2 (65.5) |
| I/σ | 12.1 (1.9) |
| CC(1/2), % | 99.8 (69.9) |
| Completeness, % | 92.4 (92.5) |
| No. of reflections | 58,557 (4,244) |
| Multiplicity | 2.4 (2.7) |
| Refinement | |
| Resolution, Å | 29.62∼2.78 |
| Rwork/Rfree, % | 21.2/26.5 |
| No. of atoms | 3,070 |
| Protein | 3,056 |
| Water | 14 |
| Wilson B factor, Å2 | 63.9 |
| RMSD | |
| Bond lengths, Å | 0.003 |
| Bond angles, ° | 0.60 |
| Ramachandran plot, % | |
| Favored | 95 |
| Allowed | 100 |
Parentheses denote highest resolution bin 2.85 to 2.78 Å.
The structures of the four individual subdomains, F0, F1, F2, and F3, are similar to the previously reported structures (15, 28). Nevertheless, unlike the elongated domain organization observed in the structure of the talin head construct TH′ (residues 1 to 400 del139-168/del30), the F1-F2-F3 domains of the β3-FTHΔ construct adopt a canonical FERM-folded configuration (Fig. 1B). The interface of the F0 and the F1 subdomains in the β3-FTHΔ structure is virtually identical to that observed in the TH′ structure. The FERM-folded conformation of F1-F2-F3 is mainly attributed to the conformational rearrangement of the F1-F2 linker, resulting in a three-leaf clover architecture, with the F3 subdomain residing on the top of the F1 and F2 subdomains. The overall domain organization of β3-FTHΔ is highly homologous to that of monomeric kindlin-2 (PDB ID code 5XPY) (Fig. 1C) (14). Compared to kindlin-2, however, which shows a short helical extension at the C terminus, amino acids beyond the α1-helix in F3 of the talin head (406 to 430), although predicted to be partially α-helical, were disordered in the structure. The FERM domain of β3-FTHΔ is also similar to the classic FERM proteins merlin and moesin. Interestingly, the α1-helix at the C terminus of the talin F3 subdomain undergoes a significant rotation with respect to merlin (PDB ID code 4ZRJ) and moesin (PDB ID code 1EF1), resulting in a much wider cleft for integrin binding to the F3 subdomain, and a different connectivity with the F1 domain or F1-F2 linker (Fig. 1 D and E). Overall, the structure of β3-FTHΔ reveals a full-length talin head, with an F1-loop deletion, in a canonical FERM-folded conformation, in complex with the cytoplasmic segment of the β3-integrin.
Nevertheless, to further confirm that the intact talin head possesses the FERM fold, we purified talin t1-405 with the intact F1 loop and analyzed its structure in solution by negative-stain TEM. Monodispersed talin proteins were selected through a semiautomated particle selection approach. Reference-free two-dimensional (2D) classification was carried out with a total of 65 classes. The 2D classes clearly showing the four domains of talin were selected for figure preparation. The three-dimensional (3D) map was calculated using the top 50 classes in an iterative manner. The iterative approach to the single-particle reconstruction is aimed to progressively reduce heterogeneity in the data. The 3D map shown in Fig. 1H is a representation of the most stable conformation of the talin head (Fig. 1F). None of the initial models and preliminary structures showed an elongated structure for t1-405, suggesting that t1-405 does not exist in the elongated conformation as shown in the t1-400(del30) crystal structure (15) (Fig. 1G). A 3D reconstruction of t1-405 reveals a TEM volume with an average length of 8.5 nm, which is consistent with the FERM-folded talin head observed in the crystal structure (Fig. 1H). Together these data confirm that the full-length talin head adopts a FERM fold for its function in inducing integrin activation and clustering.
The FERM configuration of the talin head is stabilized by an extensive intersubdomain interaction network (Fig. 2A). In particular, the C-terminal Lys401 and Lys402 of the F3 subdomain form salt bridges with two negatively charged residues, Asp125 and Glu126 of the F1 subdomain, respectively. The F1:F2 interface is fortified by an Arg194:Asp222 salt bridge and an Arg195:Gln218 hydrogen bond. In addition, the F1 subdomain residue Arg195 also forms salt bridges with Glu126 of F1 and Asp201 in the F1-F2 linker. This network of salt bridges and hydrogen bonds connected all three subdomains (F1, F2, and F3) and is likely to be relevant for the structure and function of the talin head. A structure-based alignment of the α1-helix in F3 (residues 394 to 405 in talin) revealed conserved basic residues in kindlin-2, SNX17, and the ERM-family proteins (ezrin, radixin, moesin, and merlin) (Fig. 2B). Despite the homology analysis that indicates Lys401 and Lys402 to be part of the F3 subdomain, previous crystallographic studies of the talin-1 head used a truncated F3 subdomain (up to residue 400) (15, 35), which was based on a stable talin head fragment obtained from limited proteolysis analyses (35). Although the truncated F3 subdomain retains the phosphotyrosine-binding (PTB) domain fold, the resulting talin head molecule appeared to be highly flexible in solution and was crystallized in an elongated configuration. This change in structural stability is likely due to the lack of K401:D125 and K402:E126 salt bridges that hold the F1 and F3 subdomains together. Similar intersubdomain interactions were also seen in kindlin and other classic FERM proteins, such as moesin (PDB ID code 1EF1), to maintain their FERM domain stability (Fig. 2C). In particular, Arg294 and Arg295 of moesin form salt bridges with Glu92 and Glu87 in the F1-F2 linker, respectively; Arg659 of kindlin-2 (PDB ID code 5XPY) interacts with Glu137 in the F1 subdomain. That these interactions contribute to the overall stability of the compact FERM fold was further supported by differential scanning calorimetry (DSC) of different forms of the talin head, reflecting a consistent downward shift in melting temperature (Tm) upon deletion of the poly-lysine motif (Table 2). Differential scanning fluorimetry cross-validated this finding (SI Appendix, Fig. S1). Thus, our structure of the full-size talin head in complex with integrin β3 suggests that the poly-lysine motif at the C terminus of the F3 subdomain is essential for the stability of the FERM-folded conformation of the talin head.
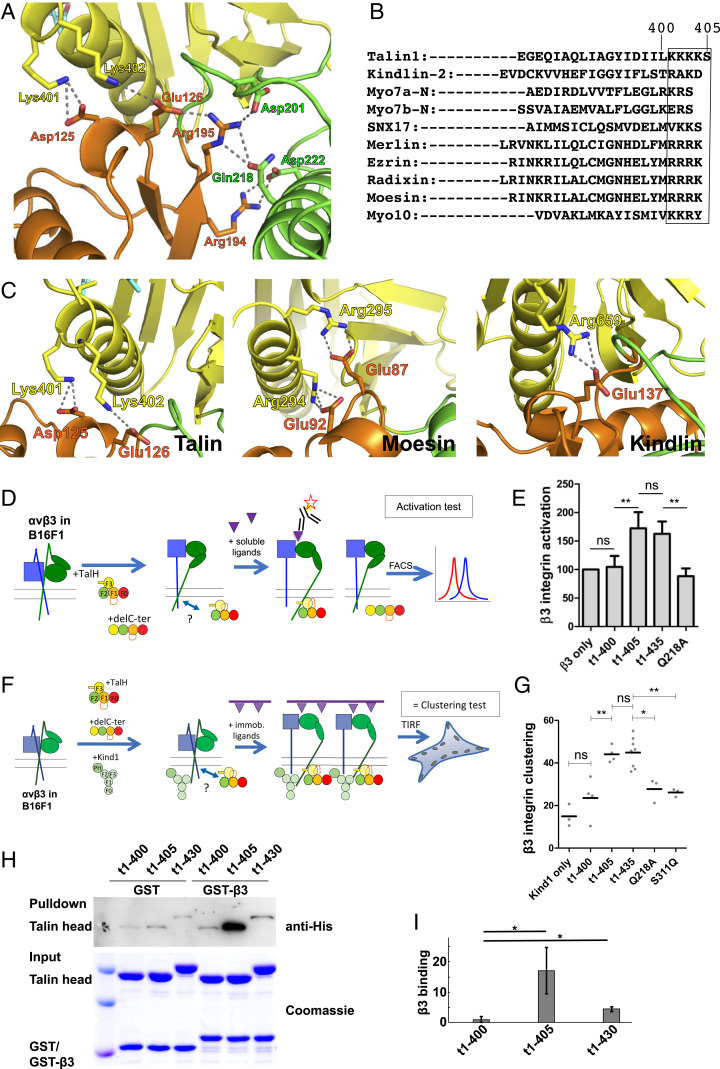
FERM-folded talin head is required for integrin functions. (A) Intersubdomain interaction network in the talin FERM domain. Hydrogen bond interactions are shown by dotted lines. (B) Structure-based alignments of the α1-helix of the F3 domain, indicating a conserved patch of basic amino acids (boxed) that are missing in the nonfunctional (1-400) talin head construct. (C) Salt bridge interaction mediated by the C-terminal positively charged residues in the F3 subdomain and negatively charged residues in the F1 subdomain (Left, talin; Right, kindlin) or the F1-F2 linker (Middle, moesin). Dashed lines represent hydrogen bonds. (D) Integrin αvβ3 activation in B16F1 melanoma cells by the talin head is shown in a schematic representation. Red star represents the fluorescent antibody. Purple triangles indicate integrin ligands, in either soluble (triangle) or substrate-bound (triangle on bars, in F) forms. Question mark at bidirectional arrow indicates integrin/adapter interaction sites to be studied. (E) Activity indices of integrin αvβ3 in B16F1 cells transfected with full-length talin head (t1-435, residues 1 to 435, n = 8), C-terminally truncated talin head (t1-400, n = 4; t1-405, n = 9), or the FERM-interface mutations (Q218A, residues 1 to 435, n = 4). (F) Integrin αvβ3 clustering in B16F1 melanoma cells by the talin head and kindlin-1 is shown in a schematic representation. (G) Clustering indices of integrin αvβ3 in B16F1 cells transfected with t1-400, t1-405, t1-435, Q218A, and S311Q. (H) GST-tagged integrin β3 cytoplasmic tail was used as a bait to pull down purified His6-tagged talin head proteins t1-400, t1-405, and t1-430. (I) The blots from H were quantified and normalized to the control. Data shown are mean ± SD, n = 4 (*P < 0.02; **P < 0.01; ***P < 0.001). ns: not significant.
| Talin | HPLC | DSC | Integrin binding | |||||||
| WT- β3 | VE- β3 | |||||||||
| MWtheor. | Vr | MWSLS | R(h) in DLS | Tm | ΔTm | ΔGapp | ΔΔGapp | ΔGapp | ΔΔGapp | |
| t1-405 | 51.4 | 1.80 | 66.9 | 4.62 ± 0.35 | 54.2 ± 0.1 | 0 | −27.1 | 0.0 | −37.1 | 0.0 |
| t1-400 | 50.8 | 1.81 | 64.3 | 4.57 ± 0.32 | 52.3 ± 0.3 | −2.0 | −22.3 | +4.8 | −35.0 | +2.1 |
| t1-435 | 54.5 | 1.77 | 72.4 | 4.77 ± 0.37 | 53.9 ± 0.1 | −0.4 | −24.3 | +2.8 | −36.6 | +0.5 |
Characterization of various talin head forms by SEC equipped with in-line SLS and DLS, and analysis of Tm in DSC. Theoretical molecular weight (MWtheor.) and molecular weight determined by SEC-SLS (MWSLS) are given in kDa. Retention volume (Vr) is given in mL. Hydrodynamic radius R(h) is given in nm. Tm and the difference from Tm (t1-405) (ΔTm) are given in °C. Binding of wild-type (WT-β3) and high-affinity (VE-β3) β3-integrin was analyzed using the Fortebio Octet RED384 optical biosensor. The approximated Gibbs free energy of binding (ΔGapp) and the difference in ΔGapp compared to t1-405 (ΔΔGapp), are shown in kJ⋅mol−1. HPLC, high-pressure liquid chromatography.
Transfection of the full-length talin head (1 to 435) can induce integrin activation and integrin clustering in various cell types (22, 23, 28). However, talin F2-F3 is reportedly not sufficient to induce α5β1-integrin activation, when measured by soluble fibronectin binding (27), whereas it activates integrin αIIbβ3 when probed with the multivalent PAC-1 IgM antibody (22, 27, 36). To identify also potentially relevant amino acids in the C-terminal part of the talin head, especially those linked to the salt bridges and hydrogen bonds formed between F1, F2, and F3 subdomains, we transfected melanoma B16F1 cells with talin head constructs and examined the αvβ3-integrin activity (Fig. 2D). While the sequences between residues 406 and 435 could be removed without affecting integrin activation, the further removal of the poly-lysine motif of residues 401 to 405 caused a loss of integrin activation (Fig. 2E). Furthermore, mutation of the conserved Q218, hydrogen bonded to R195, and part of the extensive interdomain interaction network, resulted in a loss of integrin activation (Fig. 2E). To assess the kindlin-1–assisted integrin clustering, we developed a more physiological integrin-clustering assay that takes into account the equally critical role of kindlin for integrin activation and clustering (3738–39). We analyzed the clustering of GFP-tagged β3-integrin in the presence of the cotransfected talin head and kindlin-1 in B16F1 melanoma cells that were spread on serum-coated glass coverslips (25). The degree of clustering of integrin receptors was calculated from total internal reflection fluorescence (TIRF) microscopy images, by determining the percentage of the cell area covered with integrin clusters (Fig. 2F) (25). Similar to the reduced integrin activation by the mutation of Q218 as part of the H-bond network (Q218A), the introduction of a large hydrophilic Gln residue at an F3:F1-F2 interface residue Ser311, which is conserved with kindlins (Ser in kindlin-3, Thr in kindlin-1, -2) and pointing to the core of the FERM domain (SI Appendix, Fig. S2), as well as the removal of the poly-lysine motif, led to a loss of integrin clustering, despite the presence of kindlin (Fig. 2G). Moreover, removal of the C-terminal end beyond residue 400, particularly the poly-lysine motif (residues 401 to 405), of the full-length talin head significantly diminished the association of the talin head with the cytoplasmic tail of integrin β3 (Fig. 2 H and I) and caused a significant drop (ΔΔGapp 4.8 kJ/mol) in integrin peptide binding measured using biosensor (Table 2). In contrast, the presence of the following linker region to the rod domains (residues 406 to 435) reduced the binding affinity of the talin head and integrin β3 (Fig. 2 H and I). This observation is consistent with the binding analysis by the Octet optical biosensor (Table 2). Interestingly, the C-terminal poly-lysine motif (residues 401 to 405) was removed from the previously described elongated crystal structures of the talin head (15, 16) and was absent from the crystallized chimeric β3–F2–F3 talin complex (35), suggesting that these structures may not represent physiologically relevant conformations of talin, nor its associated integrin, respectively.
The structure of β3-FTHΔ fusion protein reveals a trans F3:β3 interaction in a typical NPxY:PTB domain binding mode. Interestingly, this interaction is distinctly different from the F3:β3 interaction observed in the structure of the β3-F2-F3 chimeras obtained with a truncated C-terminal helix in F3 (PDB ID code 1MK7) (35) (Fig. 3A). Due to the abovementioned rotation and contraction of F2 and F3 domains in the truncated F2-F3 structure and the respective movement of the α1-helix on the surface of the F3 subdomain, the F3 subdomain in the β3-FTHΔ structure possesses a much more extended cleft between the β5 strand and α1-helix than that of the β3-F2-F3 chimera (Fig. 3B). The interaction between the C-terminal Lys401/Lys402 and the F1 subdomain residues leads to the α1-helix movement toward the F1 subdomain, resulting in a more “open” β5-α1 cleft (Fig. 3B). Moreover, we identified an important interface that involves extensive interactions between multiple talin residues and β3 residues Asn744 and Leu746 (SI Appendix, Table S1). In the β3-F2-F3 chimera structure, only a weak interaction of F3 residues with Asn744 and Leu746 of the N-P-L-Y motif was observed. However, in our structure, the N-P-L-Y motif of the bound β3 fragment contacts the F3 subdomain extensively through the residues surrounding the cleft. Asn744 makes direct side-chain interactions with Trp359 and Ile396, and Pro745 contacts with Leu400. In addition, Leu746 is buried in a hydrophobic pocket comprising Leu353, Ile396, Ile399, and Leu400 (Fig. 3C). Indeed, the L746A mutation in integrin β3 has been shown to significantly reduce talin association and diminish integrin activity (22, 40), and the N744A mutation also led to a loss of β3-mediated cell adhesion (41). Our structure thus provides a molecular basis for the essential role of the N-P-L-Y motif in talin:β3 association and confirms its role in integrin activation and clustering. Furthermore, we found that t1-405, a talin head construct including the C-terminal lysines, exhibits higher affinity with integrin β3 than t1-400, which lacks the C-terminal poly-lysine motif (Table 2). Our results thus indicate that the C-terminal poly-lysine motif in the talin FERM domain is required for the proper folding of the FERM domain and proper β3-integrin binding.
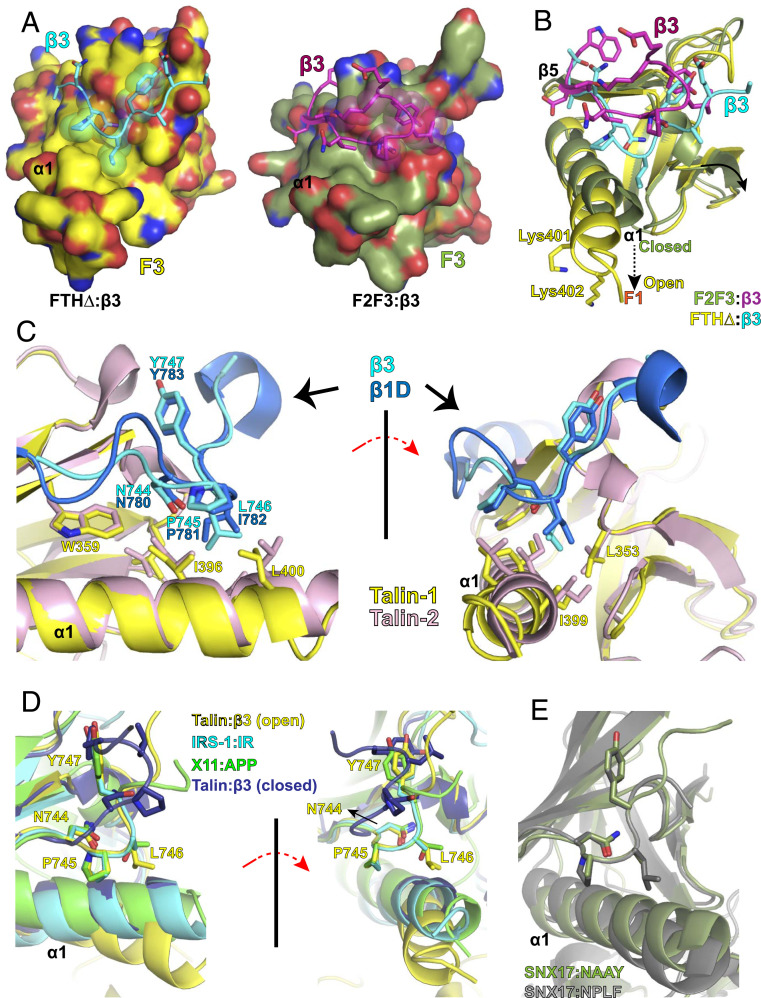
Interaction of the N-P-L-Y motif with the F3 subdomain of the talin head. (A) Comparison of the β3:F3 interactions in β3-FTHΔ (Left) and in β3-F2-F3 (Right). β3 fragments are shown in stick with the N-P-L-Y motif highlighted in spheres. F3 subdomains are shown in surface representation. β3 and the F3 subdomain (residues 306 to 406) from β3-FTHΔ are colored in cyan and yellow, respectively. β3 and the F3 subdomain (residues 306 to 400) from β3-F2-F3 are colored in purple and olive, respectively. (B) Superposition of the N-P-L-Y motifs and their binding sites from the β3-FTHΔ and β3-F2-F3 structures. All fragments adopt the same color scheme as in A. Interactions of Lys401/Lys402 and the F1 subdomain lead to the rotation of the α1-helix in the F3 subdomain and an open β5-α1 cleft. (C) Superposition of the β3:F3(talin-1) from β3-FTHΔ and β1D:F3(talin-2) structures. β3:F3(talin-1) adopts the same color scheme as A. β1D and F3 of talin-2 are colored in sapphire and light pink, respectively. Side chains of the NPxY motifs and their contacting residues in the F3 subdomains are shown in stick representation. (D) Superposition of the β3:F3(talin-1) in the open (yellow) and closed (purple) configurations and other NPxY:PTB domain complexes. The PTB domain of IRS-1 in complex with the insulin receptor peptide is colored in cyan, and the PTB domain of X11 in complex with the amyloid peptide is colored in green. (E) Superposition of SNX17 in complex with an N-A-A-Y peptide (olive) and SNX17 in complex with an N-P-L-F peptide (gray).
An F2-F3 segment of talin-2 in complex with integrin β1D (PDB ID code 3G9W) was reported previously by Anthis et al. (26). The bound β1D fragment reveals both the N-P-I-Y motif and the juxtamembrane helix. Both the N-P-I-Y motif of β1D and the N-P-L-Y motif seen in the β3-FTHΔ structure adopt the same canonical PTB-domain–binding configuration, and the side chain conformations for the cleft-surrounding residues in their F3 subdomains are also highly conserved (Fig. 3 C, Left). In contrast to the β3-F2-F3 structure, in which the F3 subdomain ends at residue 400, the talin-2 F2-F3 construct includes the C-terminal lysines. The talin-2 F3 subdomain adopts an “open” configuration as well, allowing the N-P-I-Y motif of integrin β1D to embed into the β5-α1 cleft. Nonetheless, the openness of the β5-α1 cleft in the talin-2 structure is slightly less compared with that of the FERM-folded talin-1, likely due to the lack of interaction with the F1 subdomain (Fig. 3 C, Right). Interestingly, in the structures of the X11 PTB domain in complex with the amyloid peptide (X11:APP, PDB ID code 1AQC) and IRS-1 PTB domain in complex with an insulin receptor peptide (IRS-1:IR, PDB ID code 5U1M) (42, 43), both PTB domains adopt a nearly “closed” configuration, similar to the talin F3 structures without the C-terminal lysines (Fig. 3D). It appears that the rather bulky and rigid Leu746 in integrin β3 (Ile in β1) is unable to fit in the “closed” cleft of F3 but requires an open cleft for a classic PTB:NPxY interaction. Evidently, this conjecture is supported by the structures of the FERM domain of sorting nexin 17 (SNX17) bound to two different N-P-x-Y fragments. The structure of SNX17 bound to an N-A-A-Y fragment of P-selectin (PDB ID code 4GXB), with an alanine residue at the “x” position, reveals an F3 subdomain in a closed configuration (44). In contrast, the F3 subdomain in the structure SNX17 bound to an N-P-L-F fragment of Krit-1 (PDB ID code 4TKN), with a leucine residue at the “x” position, exhibits a rather open configuration (Fig. 3E) (45). In the case of talin, however, substitution of Leu746 by an alanine residue in integrin β3 results in significant loss of talin binding (40), suggesting that the talin F3 subdomain is unable to switch between the open and closed configurations.
We compared the structures of the FERM-folded talin head and the elongated talin head (PDB ID code 3IVF). The four subdomains are essentially identical, with root-mean-square deviation (RMSD) of 0.41 Å for the F0 subdomains (residues 1 to 83), 0.70 Å for the F1 subdomains (residues 85 to 196), 0.34 Å for the F2 subdomains (residues 206 to 305), and 0.61 Å for the F3 subdomains (residues 311 to 405) (SI Appendix, Fig. S3A). Moreover, the F0-F1 and F2-F3 interfaces are also similar, with the exception of the E269/K345 salt bridge that is only seen in the elongated talin head structure (PDB ID code 3IVF) (SI Appendix, Fig. S3B). The RMSD of the F0-F1 double domains in the two structures is 0.65 Å, and 2.1 Å for that of the F2-F3 double domains. In contrast, superposition of the F2 subdomains reveals that the F1-F2 interface in the FERM-folded structure is drastically different from that of the elongated structure (PDB ID code 3IVF), resulting in a completely rearranged quaternary structure (Fig. 4A). The F1-F2 interface in the FERM-folded structure is stabilized by a salt bridge formed by a basic residue Arg194 in the F1 subdomain and an acidic residue Asp222 in the F2 subdomain. The two residues are highly conserved among the FERM-containing proteins (Fig. 4B). Nevertheless, the two residues are far apart in the elongated crystal structure of the talin head (Fig. 4A). In moesin (PDB ID code 1EF1), the corresponding R81:E108 salt bridge also contributes to the F1-F2 interface (Fig. 4C). This conserved interaction is potentially critical in other FERM domain proteins, such as SNX31, where the equivalent of Arg194 was identified as a melanoma driver mutation (46). In the case of the talin head, the charge inversion of Arg194 to Glu (R194E) completely abrogated the talin head (1-435)-induced clustering in the presence of cotransfected kindlin-1 (Fig. 4D), and this loss of integrin clustering was rescued by a complementary mutation D222K. The double R194E/D222K mutant of the talin head was capable of inducing integrin clustering comparable to that of wild type (WT) likely by reestablishing the salt bridge in the F1-F2 interface (Fig. 4D). In addition, Gln218 in the F2 subdomain that contributes to the F1-F2 interface is also conserved among FERM proteins (Fig. 4B). In the case of moesin, the Gln218-equivalent Gln105 interacts with the F1-F2 linker residue Tyr85 and Ala82 of the F1 subdomain (Fig. 4C). As shown above, substitution of Gln218 by a nonpolar alanine in the talin head significantly diminished integrin activation and clustering (Fig. 2 E and G). These results suggest that the compact FERM fold and biological activity are preserved via this F1-F2 interface in cells.
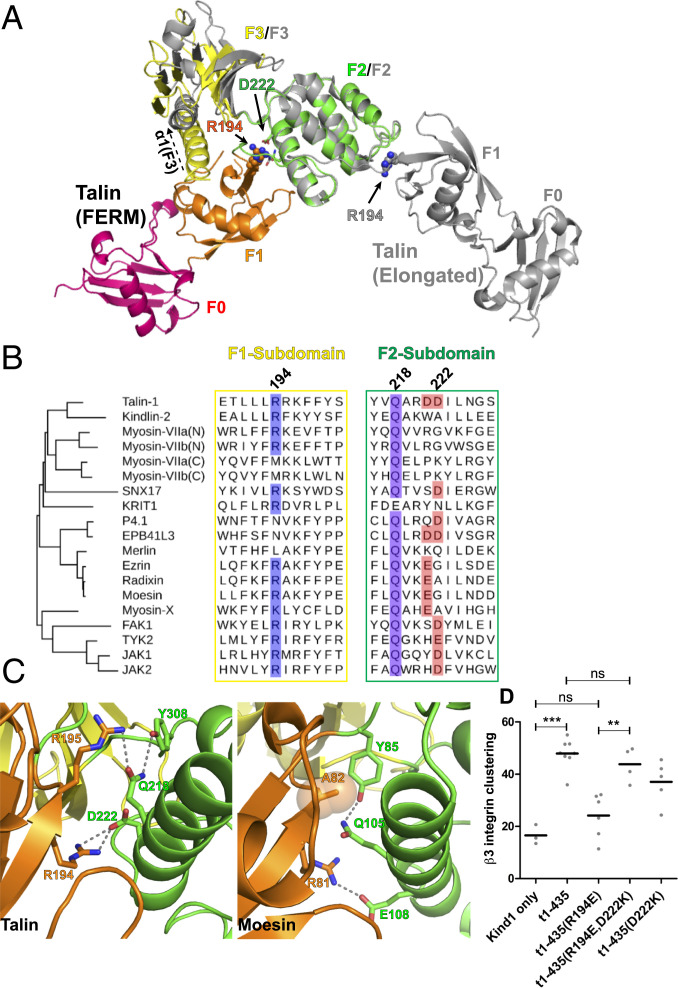
Full-length talin head has FERM-like subdomain interfaces. (A) Superposition of the F2 subdomains from the FERM-fold talin head and elongated talin head conformation. Side chains of R194 and D222 in the FERM-folded talin head are shown in sphere representation (solid arrows). Note the change in orientation of the F0 and F1 subdomains and the position of R194 (sphere, solid arrow) in the elongated talin head structure, as well as the upward rotation of the α1-F3 helix (dashed arrow) in the absence of a centrally positioned F1 domain. (B) Structure-based alignments of F1 and F2 domain sequence motifs involved in intersubdomain recognition. The equivalents of R194 and D222 are found in several known FERM domains, and Q218 is highly conserved and interacts with F1 subdomain backbone and residues. (C) Conserved F1-F2 interface in talin (Left) and moesin (Right). In moesin, the side chain of the Q218-equivalent Q105 forms hydrogen bonds with A82 backbone carbonyl and amide groups. (D) While R194E had a severe negative effect on β3-GFP-integrin clustering, it can be rescued by a complementary mutation (R194E,D222K). ***P < 0.001; **P < 0.01.
Talin plays a key role in integrin-mediated cell-matrix interactions, contributing to integrin activation and physical linking of integrins to the cytoskeleton. We determined the structure of the talin head domain containing the C-terminal poly-lysine motif, which stabilizes the FERM-like cloverleaf conformation (Fig. 2). The cloverleaf conformation is common to all FERM-like proteins determined so far, except for the previous talin structures based on C-terminally truncated versions (15, 16). Another key factor enabling the crystallization of talin was the terminal fusion of the β3-integrin sequence, which bound an adjacent talin monomer in trans. Importantly, the talin-integrin interface revealed that C-terminal residues of the talin F3 α1-helix interact with the F1 subdomain, thus opening the binding groove to accommodate the N-P-L-Y motif of the integrin β3 peptide (Fig. 3). Analysis of SNX17, another FERM-like protein in complex with different ligands, showed that the N-P-x-Y binding site opening and helix movement correlated with the size of the residue at the x-position. Whether α1-helix movements in the F3 domain are relevant for talin/integrin regulation in vivo is not clear. However, in contrast to a FERM folded talin head, where the position of the F3 α1-helix is stabilized by contacts with the F1 subdomain, the position of the F3 α1-helix appears to switch in F2-F3 or F3-only constructs. This would potentially affect the ligand binding pocket and thus the affinity to the integrin cytoplasmic tail. On the other hand, a consistent reduction in integrin tail binding affinity was noted in the presence of the linker region to the rod domains (residues 406 to 435), suggesting that the linker partially obstructs the integrin binding site in the talin head. Interestingly, the corresponding linker region in kindlin-2 forms another short α-helix (α2), which makes direct contact with the F3-α1-helix and the bound integrin-β (14). Whether the α2-helix in kindlin F3 negatively impacts kindlin:integrin-β interaction remains to be investigated. In the case of talin, phosphorylation of the linker activates integrin and leads to extensive focal adhesion turnover and inhibited cell migration by preventing ubiquitylation and subsequent degradation (47, 48). One can speculate that phosphorylation enables the linker to interact with the lysine residues that are otherwise ubiquitylated, thus stabilizing the linker and resulting in enhanced integrin activity.
While we were preparing this manuscript, a structure of the talin2 head domain was published (49). This structure (PDB ID code 6U4K) reveals an unusual semicloverleaf arrangement of F0-F1-F2 subdomains, as compared with a canonical F1-F2-F3 FERM-like cloverleaf fold. This head domain of talin2 (residues 1 to 403) was constructed based on the linear-form of talin1 head domain structure with residues 1 to 400, therefore missing the critical C-terminal residues that are crucial for the FERM-like cloverleaf fold. The F0-F1 tandem domains in the FERM-like talin1 head domain structure are virtually identical to that of the talin2 head domain structure, and the F2-F3 tandem domains are slightly twisted in the talin2 structure (SI Appendix, Fig. S4 A and B). The major difference is in the F1-F2 interface. In the FTHΔ structure, this F1-F2 interface is stabilized by Arg195-Asp201 and Arg194-Asp222/Asn225 interactions. Although these residues are conserved in talin2 (Arg197-Asp203, Arg196-Asp224/Asn227), the orientation of the F2 subdomain in regard to other subdomains is completely different and these salt bridges are disrupted as a result. Our data indicate that disruption of the Arg194-Asp222 salt bridge led to loss of integrin clustering, suggesting that the semicloverleaf configuration of the talin2 head is also functionally impaired. Interestingly, despite the flexibility of the F1-loop resolved in the talin2 head domain structure, the structural configuration of the remaining F1-loop residues in the FTHΔ structure (residues 130 to 133, 172 to 176) are highly consistent with that of the talin2 F1 domain structure, however projecting the F1 loop toward the membrane proximal integrin binding site in the F3 domain (50) (SI Appendix, Fig. S4C). Thus, the resolved F1-loop is also compatible with our FERM-folded structure, including the bound β3 peptide. Therefore, the crystal structure of the talin head, even lacking the F1-loop, is consistent with the compact talin head that includes the F1-loop as revealed by the EM structure. The configuration of the F1-loop is also consistent with our analyses of F1-loop function in regulating integrin activity (50). Shape analyses of the talin head domain by EM revealed that the majority of the full-length talin head adopts the FERM-folded configuration, and no linear configuration is observed. Therefore, it is unlikely that talin may transition between the extended linear and FERM folds, with the semicloverleaf fold as an intermediary. Our FERM-folded talin head structure is also compatible with the recently published full-length talin cryo-EM structure (18). Although the F0-F1 segment of the talin head is missing in the cryo-EM model (PDB ID code 6R9T), the F2-F3 segment of our structure superimposes with the corresponding region in the cryo-EM model perfectly. The superposition also reveals that the F0-F1 segment can be well accommodated in the cryo-EM model without any structural conflict (SI Appendix, Fig. S4D). We also evaluated how FERM-folded talin head would interact with membrane lipids. The previously identified clusters of PIP2 binding residues are spread out in three subdomains (SI Appendix, Fig. S4E). The PIP2-binding clusters, organized into a triangular pattern, orient talin on the cell membrane such that it can bind integrin in a stable manner.
As an additional consequence of the extensive interaction network formed between the C-terminal basic domain of the F3 subdomain with the F1 and F2 subdomain is the widening of the gap between the F2 and F3 domains on the opposite side of the F1-F3 interface, in respect to the elongated talin head (PDB ID code 3IVF), or the F2-F3 talin-head fragments (PDB ID code 1MK7) (35). In fact, the formation of a salt bridge between K345 and E269 in the elongated and F2-F3 structures causes a contraction of the F2-F3 spacing, resulting in the respective opening of the F2-F3 distance at the site of the F1-F2 linker insertion, potentially preventing the proper spacing required for the wedging of F2-F3 by the F1 domain, normally seen in all FERM folds. Because the talin head adopts the FERM fold, its F3 subdomain sits on the F1-F2 linker insertion, the K401-D125/K402-E126 salt bridges and the K345-E269 salt bridge may compete for contact like two sides of a seesaw (SI Appendix, Fig. S5). Formation of the K401-D125/K402-E126 salt bridges tilts the seesaw, thus disrupting the K345-E269 side and stabilizing the FERM configuration. In the elongated structure, the K345-E269 salt bridge causes an upward movement of the F3-helix, thereby potentially preventing the correct positioning of the F0-F1 module on top of the F2-F3 module. The K345-E269 salt bridge is lost in the presence of the poly-lysine motif in the F3 subdomain, and the FERM-folded configuration is stabilized as a result.
Folding of talin into a canonical FERM configuration provides a scaffold in which talin binds to β-integrins, while stabilizing their activated state in a kindlin-dependent manner, in order to control inside-out and outside-in signaling of integrins. It is noteworthy that the talin-binding site and the kindlin-binding site in integrin β3 are only eight residues apart. The tight association between the full-length talin head and the N-P-L-Y motif in integrin β3 restricts the flexibility of the proceeding kindlin-binding motif. Thus, when integrin binds to talin and kindlin simultaneously, extensive contacts between talin and kindlin seem inevitable. It may therefore be more relevant to probe the formation of the integrin-β:talin:kindlin trimeric complex rather than that of the dimeric integrin-adaptor complexes separately when assessing changes in signaling upon modification to these proteins. In particular, posttranslational modification on either integrin β or talin/kindlin may impact integrin signaling by affecting the formation of the trimeric complex. Moreover, we demonstrated that conserved FERM domain motifs at the F1-F2 interface (R194-D222, Q218) and C-terminal poly-lysine motif in the F3 subdomain are important for the efficient activation and clustering of integrins. These contact interfaces might be promising targets for drug development. Overall, our results reveal the importance of FERM-like conformation of the talin head for the coactivation and clustering of integrins in collaboration with kindlin.
A human integrin β3 fragment including residues 720 to 750 was fused to the amino terminus of the talin head domain containing residues 1 to 430, with the loop in the F1 subdomain (residues 139 to 168) deleted. The fusion polypeptide was cloned into a modified pET-28 vector with a tobacco etch virus (TEV) cleavable histidine tag at the N terminus. The plasmid was transformed into Escherichia coli BL21(DE3) for protein production. Cells were lysed in 50 mM Tris, pH 7.5, 500 mM NaCl. Protein was extracted from the supernatant with a HisTrap HP column (GE Healthcare) and eluted with an imidazole gradient. The His-tag was removed by TEV protease. Untagged protein was further purified using a Resource S column. The fusion protein was concentrated to 8 mg/mL, in 20 mM 4-(2-hydroxyethyl)-1-piperazineethanesulfonic acid, pH 7.0, 2 mM dithiothreitol (DTT), and 200 mM NaCl. Crystallization was performed by the hanging-drop vapor diffusion method. Crystals were observed with a well solution containing 100 mM 2-(N-morpholino)ethanesulfonic acid (MES), pH 6.5, 100 mM NaCl, and 10% polyethylene glycol (PEG) 4000 at room temperature for approximately 3 to 5 d. X-ray diffraction data were collected at the NSLS-II AMX beamline. Data were indexed, integrated, and scaled with FastDP. Data collection and refinement statistics are listed in Table 1. The crystal structure was determined by molecular replacement by Phaser. The atomic coordinates and structure factors have been deposited in the Protein Data Bank with accession number 6VGU. A stereoview of a representative electron density map is shown in SI Appendix, Fig. S6.
Talin head domain proteins (Table 2) used for size-exclusion chromatography (SEC), static light scattering (SLS), dynamic light scattering (DLS), and analysis of Tm in DSC were expressed using the pTrcHis C vector (Thermo Fisher Scientific) with an N-terminal His6-tag MGGSHHHHHHGMASMTGGQQMGRDLYDDDDKDRWIRPRA. The sequence-confirmed plasmids were introduced into E. coli BL21-Star cells (Thermo Fisher Scientific). Bacteria were cultured in Luria broth (LB) medium containing 100 µg/mL ampicillin at 37 °C. Isopropyl β-d-1-thiogalactopyranoside (IPTG) (1 mM) was used to induce protein expression at an optical density of 0.4 and were harvested after 5 h of incubation. E. coli extracts were prepared by homogenization (Emulsiflex C3) in 20 mM NaPO4, 1 M NaCl, and 20 mM imidazole, pH 7.4. Clarified lysates were applied on a HisTrap FF 5-mL affinity column (GE healthcare) using ÄKTA Purifier (GE Healthcare). Talin head domains were eluted from columns using 20 mM sodium phosphate buffer (1 M NaCl, pH 7.4) with gradually increasing imidazole concentration (20–700 mM). Eluted fractions were analyzed by sodium dodecyl sulfate polyacrylamide gel electrophoresis (SDS/PAGE) and Coomassie staining and pooled when appropriate. Furthermore, talin head domains were purified with a HiTrap SP FF 1-mL column (GE Healthcare) after dilution (1:10) to 20 mM NaPO4, pH 7.4 buffer. Elution was performed by preparing the linear NaCl gradient with 20 mM NaPO4, 1 M NaCl, pH 7.4 buffer.
GST-integrin tail fusion constructs (WT-β3, GST-GSKLLITIHDRKEFAKFEEERARAKWDTANNPLYKEATSTFTNITYRGT; VE-β3, GST-GSKLLITIHDRKEFAKFEEERARAKWVENPLYKEATSTFTNITYRGT) were expressed with a similar approach in E. coli BL21-Star (51). Cells were lysed by homogenization (Emulsiflex C3) in phosphate-buffered saline (PBS), pH 7.4 buffer, and proteins were purified with Glutathione SepharoseTM (GE Healthcare 4 Fast Flow) using 50 mM Tris⋅HCl, 20 mM reduced glutathione, pH 8 buffer as eluent. Eluted fractions were analyzed with SDS/PAGE, Coomassie staining, and Western blot using mouse anti-GST B-14 (Santa Cruz) and goat anti-mouse antibodies. Fractions containing desired proteins were dialyzed into 50 mM sodium phosphate buffer (150 mM NaCl, pH 7.2) and stored at −20 °C.
The homogeneity of the purified proteins was evaluated using DLS (Zetasizer nano ZS). The purified talin proteins were also subjected to high-resolution mass spectrometric analysis. The mass spectra indicated that the protein samples were pure and homogeneous and the determined accurate masses were in a full agreement to those calculated from the sequences.
Purified GST-tagged β3 or GST (final concentration at 15 μM) was incubated with purified His-tagged talin head proteins (t1-400/t1-405/t1-430, final concentration at 10 μM) in the binding buffer (50 mM Tris, pH 7.5, 100 mM NaCl, 2 mM DTT) to a final volume of 200 μL on ice for 5 min. Protein mixtures were then incubated with glutathione agarose beads on a rotator for 1 h at 4 °C. After washing with binding buffer three times, bound proteins were eluted with 50 μL of elution buffer (50 mM Tris, pH 7.5, 100 mM NaCl, 2 mM DTT, 20 mM reduced glutathione). Eluted samples were applied to SDS/PAGE and Western blotting for further analysis. Data were collected from four independent experiments. Western blots were developed using a FluorChem E System (Proteinsimple) with a charge-coupled device (CCD) camera. The CCD detector possesses a dynamic range of 65,536 gray scales and automatically records the 16-bit gray scale within the maximal dynamic range to ensure best linearity. After Western blotting, band density was acquired by software FIJI (Image J), subtracted by the GST negative control, and normalized to the band density level of t1-400 and GST-β3. Significance was calculated between t1-400 and t1-405/t1-430 (t test) (*P < 0.02).
Proteins were analyzed using a liquid chromatography instrument (CBM-20A; Shimadzu Corporation, Kyoto, Japan) equipped with an autosampler (SIL-20A), ultraviolet-visible (UV-VIS) (SPD-20A), and a fluorescence detector (RF-20Axs). Molecular weight was determined using SEC with a Malvern Zetasizer µV instrument (Malvern Instruments Ltd.) measuring inline SLS and DLS. Data were processed using Lab Solution Version 5.51 (Shimadzu Corporation) and OmniSec 4.7 (Malvern Instruments Ltd.) software. Samples (50 µg) were injected into the column (Superdex 200 Increase 5/150; GE Healthcare, Uppsala, Sweden) using the autosampler. The column was equilibrated with 50 mM Na3PO4, 150 mM NaCl, pH 7.2 running buffer. The measurements were run with a flow rate of 0.1 mL/min at 20 °C. The monomeric peak of bovine serum albumin (BSA) was used for calibrating the system to calculate molecular weight from the measured SLS intensity.
Talin samples were analyzed using the VP-DSC instrument (MicroCal; Malvern Instruments Ltd.) with protein concentrations of ∼0.2 mg/mL in 50 mM NaH2PO4, 150 mM NaCl, pH 7.2 containing 1 mM ethylenediaminetetraacetic acid (EDTA) and 1 mM DTT. Concentrations were measured before the analysis by NanoDrop using the theoretical molar extinction coefficient calculated using ProtParam software. Samples were stored at +4 °C prior to analysis. Solutions were degassed prior to measurements. Samples were heated from 20 °C to 130 °C at a scanning rate of 2 °C/min. Feedback mode was set to low, and filter period was 5 s. Tm and calorimetric heat change (ΔH) were obtained by subtracting the baseline and using the Levenberg–Marquardt nonlinear least-squares method to the data using MicroCal Origin 7.0 software (MicroCal; Malvern Instrument Ltd.).
For talin t1-400 and t1-405 differential scanning fluorimetry analysis, protein quality was checked using batch DLS (Zetasizer nano ZS) prior to analysis. Protein samples (2 µM) were prepared in a clear 96-well plate (Multiplate PCR plates, MLL9601; Bio-Rad) in phosphate-buffer containing 150 mM NaCl, pH 7.2. The thermal scanning was conducted on a Bio-Rad CFX96 real-time PCR instrument. To monitor thermal-induced unfolding, SYPRO Orange protein gel stain (ex470/em570 nm; Thermo Fisher Scientific) was used by preparing first a 1:100 dilution in dH2O, and then 3 µL was added per well containing 22 µL of protein solution (6x Sypro Orange final concentration). As a control, a buffer sample without protein was prepared. The plate was covered with a qPCR sealing sheet (Biotop) to prevent evaporation and gently centrifuged to remove air bubbles. The thermal screening experiment was performed from 25 °C to 85 °C with temperature increase 2 °C/min. Data were normalized in Excel, and the Tm values were calculated by fitting the Boltzmann sigmoidal function using the GraphPad Prism nonlinear regression method.
Biosensor analysis was carried out on a ForteBio Octet RED384 instrument (Pall Life Sciences) using nickel-nitrilotriacetic acid (Ni-NTA) sensors following a strategy similar to the one described in ref. 51. Samples or buffers were prepared into 96- or 384-well plates at a volume of 200 µL or 80 µL per well, respectively. Sensors were prewetted with buffer (50 mM Na3PO4, 150 mM NaCl, pH 7.2) in order to get baseline measurements prior to protein immobilization. An operating temperature of 27 °C and a stirring speed of 1,000 rpm were used throughout the experiment. Sensors were chemically activated by immersion in 0.05 M 1-ethyl-3-(3-dimethylaminopropyl)carbodiimide (EDC) and 0.1 M N-hydroxysuccinimide (NHS) in water for 100 s. Different talin head mutant samples (50 µg/mL) were immobilized on the sensor’s surface for 300 s. The excess sulfo-NHS esters were quenched by 1 M ethanolamine, pH 8.5 for 100 s. Serially diluted GST-β3-integrin-tail fusion proteins were applied on the talin-coated sensors in concentrations of 20, 80, 320, 1,250, and 5,000 nM to obtain the relative affinity of talin to GST-β3. Each concentration of GST-β3 binding to the sensor was measured for 300 s before moving to a higher concentration.
Talin-WT-β3 and talin-VE-β3 binding data from the Octet biosensor (20, 80, 320, 1,250, and 5,000 nM) were treated as follows: Background (GST control) was subtracted, and all of the data were normalized to t1-405 at concentration 1,250 nM to allow comparison between experiments. The normalized data were analyzed with linear regression analysis in GraphPad Prism 5.02 (GraphPad Software, La Jolla, CA) assuming one-site specific binding. Bmax was set to 8.6 for WT β3-integrin binding data, and to 1.265 for VE-β3.
Mouse melanoma B16F1 cells were cultured in Dulbecco’s modified Eagle’s medium (DMEM), 10% fetal calf serum (FCS), and antibiotics and passaged by trypsin treatment as described (25). Expression levels of the transiently transfected proteins and representative cell images for integrin clustering assays are shown in SI Appendix, Fig. S7 A and B, respectively.
WT and mutant human talin1-head domain constructs used for mammalian cell transfection were cloned in pcDNA3 as N-terminal cyan fluorescent protein-fusion proteins, according to standard molecular biology protocols, and confirmed by automated DNA sequencing (25). His-tagged human talin1 head domain constructs were cloned into the pTrcHis C vector. N-terminal TagRFP-labeled human kindlin-1 (kindly provided by Hongquan Zhang and Staffan Strömblad, Karolinska Institutet, Stockholm, Sweden) was cloned into pcDNA3. The GST-β3-cytoplasmic tail integrin construct has been described earlier (51). C-terminal GFP-tagged mouse β3-integrin constructs were cloned in pcDNA3, and the linker region was modified by two additional amino acids (DG) as described in ref. 50.
B16F1 cells were transfected in 6-well culture dishes with the JET PEi transfection reagent (polyplus-transfection) according to the manufacturer’s recommendation. For coexpression of multiple proteins, different DNA plasmids were mixed at equimolar concentrations. The transfection mixture was removed and replaced with fresh medium after 6 h. For Western blot analysis of cyan fluorescent protein-talin-head transfected cells, 48 h after transfection, cells were lysed in 300 µL of Tris-buffered saline containing 2% Triton X-100, 0.1% Nonidet P-40, 5 mM N-ethylmaleimide, 1 mM phenylmethylsulfonyl fluoride (PMSF), and protease inhibitors at 1 µg/mL (chymotrypsin, leupeptine, aprotinin, and pepstatin; Sigma) for 10 min at 4 °C. Then, 40 µL of the lysate was subsequently run under reducing conditions on an SDS/PAGE (10%), transferred to nitrocellulose, and revealed with a mouse monoclonal anti-GFP antibody (clone B34, MMS-118P; Covance) according to standard protocols.
After 6 h in transfection mixture, melanoma B16F1 cells were detached with trypsin/EDTA and plated on ethanol sterilized glass-bottom dishes in FCS-containing culture medium. After 48 h on the FCS-coated glass surface, cells were fixed with 4% PFA (paraformaldehyde in PBS) for 10 min. Cells were subsequently immerged in PBS for total internal fluorescence microscopy. Integrin clustering analysis was then performed from total internal reflection fluorescence (TIRF) images according to ref. 25; in brief, after background removal, an arbitrary threshold that allowed one to distinguish clustered from membrane-inserted integrins was used to quantify the amount of area exhibiting integrin clusters in respect to the total cell surface.
Forty-eight hours after transfection, mouse melanoma B16F1 were detached with nonenzymatic cell-dissociation solution (C5788; Sigma), washed twice in PBS containing 0.5 mg/mL BSA, and split into two equal populations. Antibody staining or soluble ligand incubation was performed in PBS containing 0.5 mg/mL BSA on ice. For one cell population, the total amount of cell-surface integrin was revealed by staining with a hamster anti–β3-integrin (anti-mouse CD61; Pharmingen, BD). The other cell population was incubated with an arginylglycylaspartic acid-containing fusion protein of the snake venom disintegrin (Kistrin) and the first Ig-domain of CD31 (SKI-7), followed by the incubation with a rat anti-CD31 monoclonal antibody (GC51) as described (25). Subsequent detection of the anti–β3-integrin and the bound β3-integrin ligand (SKI-7)/GC51 complex was achieved with phycoerythrin-labeled affinity purified anti-hamster (127.115.161; The Jackson Laboratory) or F(ab')2 fragments of goat anti-rat antibodies, respectively, and analyzed in an Accuri flow cytometer. Integrin activation was determined by the ratio of the signal between the activation-specific and total integrin-binding antibodies as described in ref. 25.
TEM was utilized to image monodispersed talin t1-405 proteins. The sample at optimized concentration was incubated for 30 s on continuous carbon grids, washed with distilled H2O, and stained with 5% ammonium molybdate and 0.1% trehalose. The grids were dried at room temperature for 2 h and imaged with a 2130f JEOL electron microscope. A total of 15 CCD images were captured by 2130f JEOL TEM and processed for single particle analysis. The particles were low-pass filtered to 10 Å and high-pass filtered to 300 Å to reduce background noise interference. A total of 1,300 particles were selected via semiautomated particle selection. Reference-free 2D classification was carried out with a total of 65 classes. The 3D map was calculated using the top 50 classes in an iterative manner. The iterative approach to the single-particle reconstruction is aimed to progressively reduce heterogeneity in the data. The reference-free averages were then used to generate a low-resolution initial model (low-pass filtered to 20 Å). Parameter centering and Euler orientation determination were refined over 10 cycles of refinement. The final map was rendered via UCSF Chimera (52), with a final resolution of 15.2 Å by 0.143 Fourier shell correlation criteria.
Statistical analyses were carried out in GraphPad Prism 5.02 for Windows (GraphPad Software, La Jolla, CA). All clustering and activation data were analyzed with one-way ANOVA and a Tukey’s multiple comparison test for differences between the groups.
Ulla Kiiskinen, Niklas Kähkönen, and Monica Julio Barreto are acknowledged for excellent technical help. Hongquan Zhang and Staffan Strömblad kindly provided the kindlin-1 construct. We acknowledge Prof. Janne Jänis (University of Eastern Finland) for the determination of total mass of the purified talin head proteins. M.B. and R.H.C. were supported by the NIH (grants TR002866, EB021230, CA225266, and CA198880) (R.H.C.) and National Institute of Food and Agriculture (CAD-MCB7399H) (R.H.C.). We acknowledge Academy of Finland (Grant 290506) for research funding (to V.P.H.). Biocenter Finland is acknowledged for infrastructure support. S.K. was supported by the Tampere Graduate Program in Biomedicine and Biotechnology. B.W.-H. and M.-C.J. were supported by Swiss National Science Foundation Grants 31003A_166384 and 310030_185261. P.Z., T.G., Y.S., and J.W. were supported by NIH Grant GM119560 (to J.W.) and American Cancer Society Grant RSG-15-167-01-DMC (to J.W.).
The atomic coordinates and structure factors have been deposited in the Protein Data Bank with accession number 6VGU. All other study data are included in the article and SI Appendix.
1
2
3
4
5
6
7
8
9
10
11
12
13
14
15
16
17
18
19
20
21
22
23
25
26
27
28
29
30
31
32
33
34
35
36
37
38
39
40
41
42
43
44
45
47
48
49
50
51
 Crystal structure of the FERM-folded talin head reveals the determinants for integrin binding
 Facebook
 Twitter
 Linkedin
 Whatsapp
