
 ,
Chi Zhang,
Revathi Balasubramanian,
Craig E. Wheelock,
Robert J. Casson,
Pete A. Williams,
,
Chi Zhang,
Revathi Balasubramanian,
Craig E. Wheelock,
Robert J. Casson,
Pete A. Williams,
Edited by James B. Hurley, University of Washington, Seattle, WA, and accepted by Editorial Board Member Jeremy Nathans November 12, 2020 (received for review July 7, 2020)
Author contributions: J.M.H., C.E.W., R.J.C., P.A.W., and S.W.M.J. designed research; J.M.H., C.G., J.P.M.W., E.D., G.C., C.Z., R.B., B.H.C., N.E.F., K.E.D., T.B.O., C.M., and P.A.W. performed research; J.M.H., C.G., J.P.M.W., E.D., G.C., C.Z., R.B., B.H.C., N.E.F., R.J.C., and P.A.W. analyzed data; and J.M.H., C.E.W., R.J.C., P.A.W., and S.W.M.J. wrote the paper.
Age-related bioenergetic insufficiency increases the vulnerability of retinal ganglion cells to intraocular pressure during glaucoma pathogenesis. This paper addresses these relationships and provides a deeper understanding of this common neurodegeneration. We demonstrate an intraocular pressure-dependent decline in retinal pyruvate levels coupled to dysregulated glucose metabolism, and detected mTOR activation at the mechanistic nexus of neurodegeneration and metabolism. Supporting this, oral supplementation of pyruvate or mTOR inhibition by rapamycin strongly protects from neurodegeneration. Bioenergetic enhancement thus provides a readily clinically translatable strategy for neurodegenerative disease. This study provides important avenues for neuroprotection against glaucoma by targeting key metabolic pathways that may be mirrored in other neurodegenerative diseases in which metabolic dysregulation may play a key role.
Intraocular pressure-sensitive retinal ganglion cell degeneration is a hallmark of glaucoma, the leading cause of irreversible blindness. Here, we used RNA-sequencing and metabolomics to examine early glaucoma in DBA/2J mice. We demonstrate gene expression changes that significantly impact pathways mediating the metabolism and transport of glucose and pyruvate. Subsequent metabolic studies characterized an intraocular pressure (IOP)-dependent decline in retinal pyruvate levels coupled to dysregulated glucose metabolism prior to detectable optic nerve degeneration. Remarkably, retinal glucose levels were elevated 50-fold, consistent with decreased glycolysis but possibly including glycogen mobilization and other metabolic changes. Oral supplementation of the glycolytic product pyruvate strongly protected from neurodegeneration in both rat and mouse models of glaucoma. Investigating further, we detected mTOR activation at the mechanistic nexus of neurodegeneration and metabolism. Rapamycin-induced inhibition of mTOR robustly prevented glaucomatous neurodegeneration, supporting a damaging role for IOP-induced mTOR activation in perturbing metabolism and promoting glaucoma. Together, these findings support the use of treatments that limit metabolic disturbances and provide bioenergetic support. Such treatments provide a readily translatable strategy that warrants investigation in clinical trials.
Glaucoma is a complex disease characterized by the progressive dysfunction and loss of retinal ganglion cells (RGCs). Age, genetics, and elevated intraocular pressure (IOP) are major risk factors. Glaucoma affects ∼80 million people worldwide and thus represents a considerable health and economic burden (1). Although there are strategies to manage IOP, they do not treat the neurodegenerative component of glaucoma. Many patients are refractory to pressure-lowering medication or they progress to blindness despite low, managed IOPs. Subsequently, >40% of treated glaucoma patients will go blind in at least one eye (2), highlighting the therapeutic need for new neuroprotective strategies. Although the factors that initiate glaucomatous neurodegeneration remain to be elucidated, they are unlikely to be unique to glaucoma (3, 4). As such, neuroprotective strategies in glaucoma will likely translate to other common age-related neurodegenerations, such as Alzheimer’s disease, where progressive neuronal dysfunction followed by axon loss is a defining feature.
Increasing evidence suggests that risk factors for glaucoma conspire to reduce energy production in the retina and optic nerve. Age- and intraocular pressure- dependent metabolic deficits are emerging as a critical factor influencing RGC vulnerability in glaucoma (5, 6). RGCs sit on a metabolic knife edge that is exacerbated by age and prolonged elevated IOP, and they are dependent on neuronal mitochondria as well as glial trophic support to maintain cellular homeostasis and bioenergetic needs. Supporting a hypothesis in which bioenergetic insufficiency renders RGCs susceptible to glaucomatous neurodegeneration, mounting evidence suggests that mitochondrial and metabolic disturbance are common in glaucoma patients, and strategies to overcome or buffer these deficits have shown promise in cell and animal models of glaucoma (567–8).
Here, we demonstrate that by disturbing retinal glucose and pyruvate levels, elevated IOP alters metabolism beyond the changes caused by aging. Pyruvate is an important nutrient for diverging energy metabolism pathways and for balancing energy needs in different physiological contexts (9, 10). We find that oral supplementation of pyruvate strongly protects from neurodegeneration in preclinical models of glaucoma. This study provides important avenues for neuroprotection against glaucoma by targeting key metabolic pathways.
To understand how elevated IOP alters energy metabolism in RGCs in a chronic preclinical model of glaucoma, we analyzed RNA-sequencing datasets from RGCs of 9-mo-old DBA/2J (D2) and D2-Gpnmb+ mice (a strain-matched nonglaucoma control). At 9 mo of age in our colony, D2 eyes have had ongoing high IOP, but have not yet developed glaucoma, allowing for the assessment of early predegenerative molecular changes. We focused on changes in energy metabolism defined by functional analysis of differentially expressed genes. This identified many early transcriptional changes to glycolysis (produces pyruvate), mannose, and fructose metabolism, gluconeogenesis (utilizes pyruvate), and pyruvate metabolism in general. Higher expression of pertinent regulatory genes also occurred in D2 RGCs, including the glucose transporter Glut3, the glycolytic regulatory gene Pfkfb3, pyruvate transporters Mpc1 and Mpc2, and pyruvate dehydrogenase component Pdha1 (SI Appendix, Fig. S1A). Given the theme of altered pyruvate metabolism in the RGC gene expression data, we next determined how retinal pyruvate levels were affected. Pyruvate levels declined with increasing exposure to elevated IOP in D2 retinas, but did not change significantly with age alone (in control D2-Gpnmb+ mice) (SI Appendix, Fig. S1 B and C). Thus, elevated IOP has a significant impact on pyruvate production or metabolism. These data are consistent with a genetic program in RGCs favoring pyruvate use in response to chronically elevated IOP, or could indicate a loss in pyruvate production during IOP-related stress (or a combination of both). Since pyruvate is a key nutrient in various energy metabolism pathways, pyruvate depletion may increase RGC dysfunction and vulnerability. Immunolabeling for mitochondrial pyruvate carriers, MPC1 and MPC2, confirmed that RGCs have the machinery to direct pyruvate into the citric acid cycle. These proteins were present in high levels in RGCs across a range of species (mouse, rat, primate, and human) (SI Appendix, Fig. S1 D–G), and their transcript increased in RGCs following ocular hypertension (SI Appendix, Fig. S H and I), highlighting the potential importance of pyruvate metabolism to RGCs in healthy and diseased states.
In addition to a major role in energy metabolism, pyruvate has been shown to protect against PARP activation, oxidative stress, and neuroinflammation (10, 11), all of which have been associated with glaucoma (121314–15). We tested the ability of pyruvate to protect stressed RGCs utilizing cultured retinal neurons and assessing the effects of pyruvate treatment following glucose deprivation or oxidative stress. In both models, pyruvate supplementation enhanced neuronal survival (SI Appendix, Fig. S2). Inhibiting monocarboxylate transporters, which facilitate pyruvate uptake into cells, with α-cyano-4-hydroxycinnamic acid (4CIN) potently inhibited the protective action of pyruvate (SI Appendix, Fig. S2). This suggests that pyruvate is an important energy source and acts as a protectant for RGCs under stress. The neuroprotective effects of pyruvate were also assessed in a model of axon injury that leads to programmed cell death similar to glaucoma. In mouse retina explant cultures pyruvate supplementation prevented degeneration of axotomized RGCs (SI Appendix, Fig. S3).
We further assessed the efficacy of long-term oral pyruvate supplementation in vivo. In D2 eyes, IOP elevation is observed beginning at 6 mo of age leading to significant optic nerve degeneration, which typically occurs from 10 mo of age onwards. This model is similar to human open angle glaucoma in that an extended therapeutic window exists between the detection of elevated IOP and progression of glaucomatous neurodegeneration. As such, we initiated pyruvate treatment at this 6-mo-of-age time point, which would correspond to detection of preglaucomatous ocular hypertension in human patients. Pyruvate-treated D2 mice had increased levels of retinal pyruvate at 9 mo, an age prior to histologically detectable glaucoma (Fig. 1A and SI Appendix, Fig. S4). Continued treatment reduced the onset of optic nerve degeneration and prevented RGC loss at older ages, yielding a decreased incidence of glaucoma (Fig. 1 B–E). RGCs of aged, pyruvate-treated D2 mice had enhanced retinal function compared to untreated mice (as assessed by pattern electroretinography [PERG], a sensitive measure of RGC function in humans and animals) and had intact, long-range axon projections capable of anterograde axoplasmic transport (Fig. 1 F–I). As acute or subacute high IOP insults contribute to clinical incidences of glaucoma, we also tested pyruvate in an inducible model of glaucoma. In this model, laser photocoagulation of limbal blood vessels in rats induced a subacute elevation of IOP which leads to a significant loss of RGCs. Pyruvate treatment increased RGC survival, decreased RGC axon cytoskeletal damage, and decreased microglial activation (Fig. 1 J–O). As pyruvate treatment protected from neurodegeneration both in an interventional (explant axotomy) and prophylactic setting (D2 glaucoma), pyruvate treatment has promising potential to reduce glaucoma in patients with diverse IOP and glaucoma-related insults.

![Pyruvate protects from glaucomatous neurodegeneration in chronic mouse and rat models. (A–I) DBA/2J mice. (A) Retinal pyruvate levels decline following the onset of elevated IOP and are recovered by oral pyruvate treatment (n > 24/group). (B and H) Pyruvate intervention protected from optic nerve degeneration as assessed by PPD staining (paraphenylenediamine; a sensitive stain for damaged axons) in D2 mice (n = 60/group). Green, no or early damage (<5% axon loss; no or early [NOE]); yellow, moderate damage (∼30% axon loss [MOD]); red, severe (>50% axon loss [SEV]) damage. (C) Counts and (D) optic nerve areas from D2 mice demonstrate a robust axon protection by pyruvate treatment (control = no glaucoma, D2-Gpnmb+; n = 10/group; all NOE except for D2 which are SEV). (E and H) Pyruvate protected from RGC soma loss (RBPMS is a specific marker of RGCs in the retina; control = D2. Gpnmb+; n = 6/group). (F and G) Pyruvate rescued PERG amplitude so that 12-mo-old treated mice were not significantly different from 9-mo-old untreated mice that had not yet developed glaucomatous degeneration (PERG is a sensitive measure of RGC function in animals and humans; n > 20/group). Individual example tracings are shown in G. (I) Pyruvate protects from the loss of anterograde axoplasmic transport as assessed by CT-β tracing to the dLGN (dorsal lateral geniculate nucleus) and SC (superior colliculus) (control = D2-Gpnmb+; n = 6/group; quantification shown to the Right). (J–O) Inducible rat model. (J) Laser photocoagulation of limbal blood vessels in rats caused a subacute elevation of IOP (ocular hypertension [OHT]). The magnitude of IOP elevation is unchanged by pyruvate treatment. (K and L) Pyruvate treatment in the rat prevents RGC soma loss and axon loss in the optic nerve. Examples are shown in O. Brn3a is a specific marker of RGCs in the rat retina. (M–O) Pyruvate treatment decreases RGC axon cytoskeletal damage (SMI32+ dystrophic axons) and decreases microglia activation (ED1+ microglia) (n = 18/group for J–O). *P < 0.05, **P < 0.01, ***P < 0.001. ns, non-significant.](/dataresources/secured/content-1765760064030-8168054c-df34-4b7a-915c-fc54f571ee4d/assets/pnas.2014213117fig01.jpg)
Pyruvate protects from glaucomatous neurodegeneration in chronic mouse and rat models. (A–I) DBA/2J mice. (A) Retinal pyruvate levels decline following the onset of elevated IOP and are recovered by oral pyruvate treatment (n > 24/group). (B and H) Pyruvate intervention protected from optic nerve degeneration as assessed by PPD staining (paraphenylenediamine; a sensitive stain for damaged axons) in D2 mice (n = 60/group). Green, no or early damage (<5% axon loss; no or early [NOE]); yellow, moderate damage (∼30% axon loss [MOD]); red, severe (>50% axon loss [SEV]) damage. (C) Counts and (D) optic nerve areas from D2 mice demonstrate a robust axon protection by pyruvate treatment (control = no glaucoma, D2-Gpnmb+; n = 10/group; all NOE except for D2 which are SEV). (E and H) Pyruvate protected from RGC soma loss (RBPMS is a specific marker of RGCs in the retina; control = D2. Gpnmb+; n = 6/group). (F and G) Pyruvate rescued PERG amplitude so that 12-mo-old treated mice were not significantly different from 9-mo-old untreated mice that had not yet developed glaucomatous degeneration (PERG is a sensitive measure of RGC function in animals and humans; n > 20/group). Individual example tracings are shown in G. (I) Pyruvate protects from the loss of anterograde axoplasmic transport as assessed by CT-β tracing to the dLGN (dorsal lateral geniculate nucleus) and SC (superior colliculus) (control = D2-Gpnmb+; n = 6/group; quantification shown to the Right). (J–O) Inducible rat model. (J) Laser photocoagulation of limbal blood vessels in rats caused a subacute elevation of IOP (ocular hypertension [OHT]). The magnitude of IOP elevation is unchanged by pyruvate treatment. (K and L) Pyruvate treatment in the rat prevents RGC soma loss and axon loss in the optic nerve. Examples are shown in O. Brn3a is a specific marker of RGCs in the rat retina. (M–O) Pyruvate treatment decreases RGC axon cytoskeletal damage (SMI32+ dystrophic axons) and decreases microglia activation (ED1+ microglia) (n = 18/group for J–O). *P < 0.05, **P < 0.01, ***P < 0.001. ns, non-significant.
To better understand the metabolic changes in glaucoma, we performed metabolomics on single retinas at time points matching our RNA-sequencing analysis. We analyzed D2-Gpnmb+ control mice, untreated D2 mice, and D2 mice treated with pyruvate or nicotinamide (NAM) (another metabolite we have demonstrated to be strongly neuroprotective) (7). Eighty-six metabolites were identified at level 1 accuracy according to the Metabolomics Standards Initiative (except for isoleucine) (16), the majority of which were altered following elevated IOP (39 increased, 9 decreased in glaucoma compared to controls) (Fig. 2 A–C and SI Appendix, Fig. S5 and Dataset S1). Pathway analyses of the altered metabolites showed enrichment in pathways related to glucose metabolism and oxidative stress, indicating a preponderance in changes related to energy metabolism. Similar pathways were enriched in gene expression changes specific to RGCs (Fig. 2 D–F and Dataset S2). These data suggest during ocular hypertensive stress there is metabolic coupling between RGCs and other retinal cell types and/or that the observed changes in metabolites occur in RGCs. The largest change in a single metabolite following elevated IOP was glucose (52-fold increase). The increased glucose may reflect altered glycolysis or other features of glucose metabolism, including conversion of astrocytic glycogen (6). We previously demonstrated PARP up-regulation in RGCs during D2 glaucoma and PARP can inhibit glycolysis by impacting hexokinase (11). Elevated glucose is associated with poor outcomes in brain injury and disease (17, 18), and high glucose concentrations lead to decreased mitochondrial cristae and mitochondrial remodeling in diabetic and cell models (19, 20). D2 RGC mitochondria have decreased cristae at corresponding disease time points (7). D2 mice do not have hyperglycemia (21, 22), implying that retinal glucose metabolism itself is disrupted.
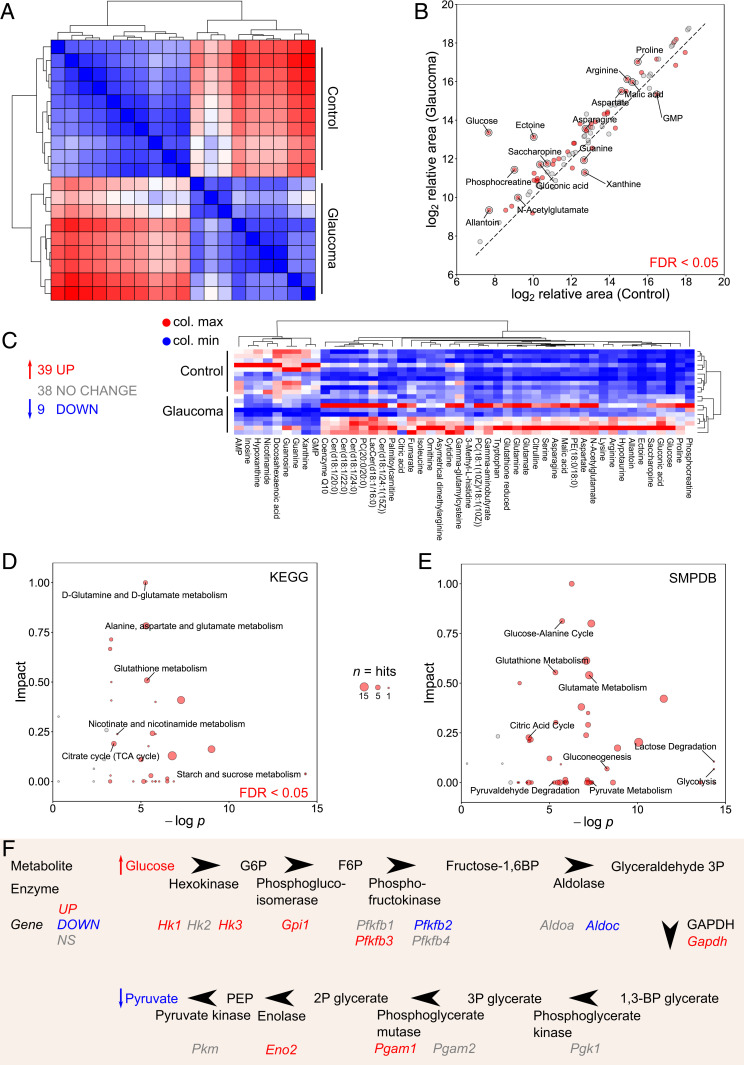
Retinal metabolic dysfunction occurs early following the onset of elevated IOP in D2 mice. (A) Whole retina samples underwent metabolomic profiling (at 9 mo of age, n = 10/group, control = D2-Gpnmb+, glaucoma = D2). Hierarchical clustering (HC) (Spearman’s) defined metabolically distinct groups. (B and C) A total of 86 metabolites were conclusively identified with level 1 accuracy according to the Metabolomics Standards Initiative (16) (except for isoleucine) (39 increased, 9 decreased in D2 preglaucomatous retinas compared to controls). All metabolites are shown in B; significantly changed metabolites are shown in C. (D) Kyoto Encyclopedia of Genes and Genomes (KEGG) and (E) The Small Molecule Pathway Database (SMPDB) pathway analysis of metabolites demonstrates significant pathway enrichment of pathways related to glucose and pyruvate metabolism and NAD metabolism. Size of data point represents number of metabolites in pathway. (F) A schematic pathway of glycolysis integrating metabolomic and RNA-sequencing data.
An additional key difference in metabolic profiles between control and glaucoma retinas was a decrease in retinal NAM. NAM levels were lower in D2 retinas compared to controls consistent with decreased retinal nicotinamide adenine dinucleotide (NAD) levels in this model (7) and decreased serum NAM levels in primary open angle glaucoma patients (23). We have previously demonstrated that NAM confers a robust neuroprotection against damaging IOP insults. NAM supplementation prevents age-dependent decreases in NAD levels, transcriptional reprogramming of RGCs, mitochondrial decline, and RGC neurodegeneration (5, 7, 24, 25). Unexpectedly, our metabolomic analysis of retinas from NAM-treated and untreated D2 mice did not detect differences outside of NAM itself. Pyruvate treatment rescued more IOP-dependent changes in the retinal metabolome than NAM. Pyruvate-treated D2 mice had differences in 27 metabolites compared to untreated mice, including lower levels of glucose and higher levels of NAM (SI Appendix, Fig. S6). As pyruvate was delivered orally, contributions from metabolite changes due to enzymatic activity by the gut microbiome or in other tissues (e.g., liver, blood) are possible. Pyruvate-induced changes in gut microbiome metabolism may indirectly benefit against glaucoma. Nevertheless, in D2 mice, oral pyruvate supplementation raises pyruvate levels in the retina (Fig. 1A), suggesting that intact pyruvate reaches the target tissues. Future experiments are needed to determine any roles of the microbiome or systemic metabolism in this protection. Future experiments could include the use of minipumps or local delivery to avoid gut-based delivery and labeled pyruvate/isotope tracers to identify the routes of pyruvate metabolism. There are multiple mechanisms by which elevated pyruvate levels may lead to an increase in NAM. One is a pyruvate-induced increase in NAD availability to NAD-consuming enzymes that generate NAM (e.g., PARPs and SIRTs; although pyruvate doesn’t directly produce NAD in these reactions) (26, 27). Alternatively, pyruvate has been demonstrated to increase nicotinamide phosphoribosyltransferase (NAMPT) levels in cancer cells (28). NAMPT is a key enzyme in NAD synthesis by the salvage pathway (29). Thus, pyruvate may modulate NAMPT to drive NAD production; but these effects on NAMPT have yet to be fully assessed in postmitotic neurons.
In addition to providing an energy substrate for mitochondrial respiration, pyruvate treatment affected NAD use. As NAD is a critical factor for glycolysis, together a decrease in NAD and pyruvate and an increase in glucose are consistent with a glycolytic deficiency. During D2 glaucoma, RGC axons were recently shown to have reduced capacity to increase glycolysis in response to metabolic demand (30). Although the regulation of glycolysis is complex, glycolytic insufficiency can occur if NAD levels decrease as the reduction of NAD+ to NADH is essential for conversion of glyceraldehyde-3-phosphate to 1,3-bisphosphoglycerate. Additionally, pyruvate metabolism is important for replacing NAD+ (9). Thus, the reduced NAD and pyruvate levels are likely to contribute to reduced glycolytic capacity in D2 RGCs, and vice versa. Another metabolite of interest for neuroprotection is gluconic acid. Levels of gluconic acid are increased in the retina following ocular hypertensive stress (Fig. 2B) and then further increased by pyruvate treatment (SI Appendix, Fig. S6B). Gluconic acid is potentially produced by the gut microbiome, especially following pyruvate treatment. It is an antioxidant and modulates the pentose phosphate pathway and hence glutathione metabolism, which is also changed by pyruvate treatment (31, 32). Thus, gluconic acid may represent another beneficial effect of this treatment.
Pyruvate and NAM are ideal treatments for clinical use, with long histories and favorable safety profiles in humans (5, 33). The most protective dose of NAM that we previously demonstrated in D2 mice is large, complicating compliance, and may be unachievable or unsafe in some patients (5, 7). Importantly, our metabolomic data suggested that pyruvate and NAM treatments may be complementary. Thus, supplementing the diet of D2 mice with both pyruvate and a suboptimal dose of NAM may be beneficial. Combination therapy of pyruvate and NAM lowered the risk of RGC loss and optic nerve degeneration in D2 mice by ∼2.6-fold, more than either treatment regime alone (SI Appendix, Fig. S7). This combination therapy showed that targeting IOP-dependent (declining pyruvate) and age-related (declining NAD) changes in glaucoma can be additive and might represent an ideal combination for human translation.
These metabolic and treatment data suggest that dysfunctional metabolism may underlie RGC vulnerability in glaucoma. Related to this, pathway analysis of our RNA-sequencing data predicted activation of the mTOR signaling pathway in RGCs in ocular hypertensive eyes (Fig. 3 A and B). mTOR is a master regulator of metabolism, and mTOR complex 1 (mTORC1) modulates glucose use and glycolysis through Hif1α (34). Hif1α is increased in the retinas of D2 mice following high IOP (7) and D2 optic nerves have a decreased maximal respiratory rate and altered glycolytic responses (30). Analysis of retinal proteins by an mTOR pathway antibody array demonstrated a specific increase in phospho-S6 and phospho-S6K, classic indicators of mTOR activation (Fig. 3C). Further, immunofluorescence analysis demonstrated activation of the mTOR pathway in retinal ganglion cells and other cell types in aged D2 eyes (increased levels of phosphor-mTOR (Ser-2448); Fig. 3D). The observed increase in mTOR pathway activity corresponded with PARP activation (7) and increased levels of glucose and related metabolites. Together, these data collectively support an increase in neuronal energy use following IOP-related stress. As mTOR inhibition can protect neurons from cell death by reducing energy use (35), we tested the role of mTOR in D2 mice. D2 mice were treated with rapamycin to inhibit mTOR-dependent metabolic reprogramming. Rapamycin is an mTOR inhibitor that promotes survival mechanisms associated with fasting and decreased energy use (34). Providing evidence that mTOR and imbalanced energy regulation represent a critical target for therapies, rapamycin treatment alone led to an ∼2.6-fold decrease in the incidence of severe glaucoma in D2 mice (Fig. 3 E–I and SI Appendix, Fig. S4). These experiments support a role for mTOR in glaucoma pathogenesis; however, as rapamycin’s effect is not specific to mTORC1 (mTORC1 is implicated by the data in Fig. 1C), further experiments are required to more precisely dissect these pathways in the context of disease (36).
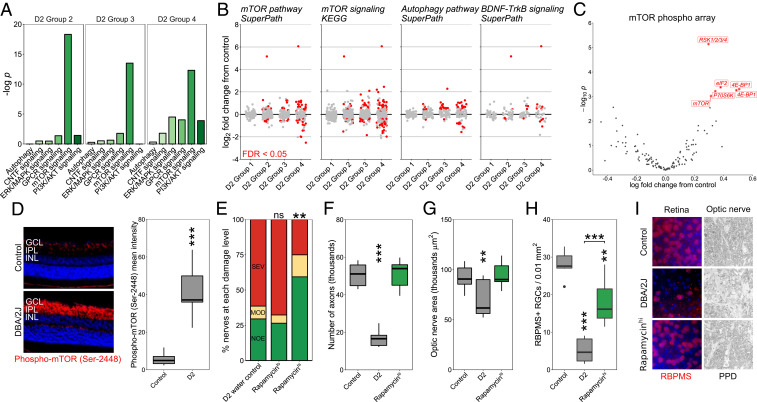
mTOR activation occurs early in glaucoma with rapamycin treatment protecting from glaucoma. (A and B) Pathway analysis of RNA-sequencing data from preglaucomatous D2 RGCs demonstrates significant enrichment of mTOR-related metabolic pathways. D2 groups 1 to 4 represent increasing disease status at the transcriptomic level as identified in Williams et al. (7). Group 1 is indistinguishable from no glaucoma controls with no significant pathway differences. (C) mTOR pathway antibody array demonstrated a specific increase in phospho-S6 and phospho-S6K, classic markers of mTOR activation. The two labels for 4E-BP1 are separate phospho sites, Thr-36 and Thr-45. (D) Phospho-mTOR (Ser-2448) increases in GCL and IPL of D2 retinas (3.5 mo control vs. 9.5 mo of age D2 shown; n = 7/group; see Materials and Methods). (E–I) Rapamycin intervention protected from optic nerve degeneration (PPD staining; n > 40/group for E, n = 10/group for axon counts and measurements in F and G) and RGC soma loss (RBPMS labeling; n = 6/group). The most common class of nerve for each group is analyzed in F and G with all being NOE except for D2 for which SEV nerves were analyzed. Control, unaffected NOE D2 nerves; D2, D2 water control; GCL, ganglion cell layer; IPL, inner plexiform layer; INL, inner nuclear layer. *P < 0.05, **P < 0.01, ***P < 0.001. ns, non-significant.
In conclusion, these findings are consistent with a model of glaucoma where elevated IOP disrupts energy homeostasis by affecting the availability of metabolic energy substrates. Further affected by low availability of coenzymes, such as NAD+, RGCs ultimately lack the energy needed to function and cope with stress and inflammation associated with age and ocular hypertension. Energy supplementation not only reduces degeneration, but also improves visual function. In this light, decreased visual function prior to degeneration may be an adaptive response to reduce energy consumption and signal a need for energy supplements. Although the combination of decreased NAD and pyruvate represent a critical component of RGC susceptibility in glaucoma, it is directly therapeutically approachable. Combining vitamin and energy supplements with established IOP-lowering therapies represents a powerful therapeutic strategy for human glaucoma that necessitates clinical investigation.
Mice were housed in a 14-h light/10-h dark cycle with food and water available ad libitum as previously reported (7). All breeding and experimental procedures were undertaken in accordance with the Association for Research for Vision and Ophthalmology (ARVO) statement for the use of animals in ophthalmic research. The Institutional Biosafety Committee and the Animal Care and Use Committee at The Jackson Laboratory approved this study. C57BL/6J (B6), DBA/2J (D2, glaucoma), and DBA/2J-GpnmbR150X (D2-Gpnmb+, control) strains were utilized. For aged glaucoma experiments mice were administered NAM, pyruvate, or rapamycin in water starting at 6 mo (prophylactic, prior to IOP elevation in almost all eyes). NAM (550 mg/kg/d, PanReac AppliChem) and/or pyruvate (500 mg/kg/d, Sigma) was dissolved in regular acid drinking water (350 mL) and changed once per week. Rapamycin (Sigma) was administered in drinking water at doses of 0.5 mg/kg/d and 2 mg/kg/d. Whole pens (n = 5 mice) were randomized between treatments and control.
IOP elevation in D2 mice is subsequent to a pigment dispersing iris disease. In all experiments, the progression of the iris disease and intraocular pressure in mutant or drug-treated mice was compared to control D2 mice as previously described (37). In each experiment, iris disease and intraocular pressure were assessed. Iris disease was assessed at 2-mo intervals starting at 6 mo of age until experiment completion. Intraocular pressure was measured at 45-d intervals beginning at 8.5 to 9 mo until experiment completion.
Rat projects were approved by the Animal Ethics Committee of the SA Pathology/Central Adelaide Local Health Network (CALHN), Adelaide, and the University of Adelaide, and conforms to the 2004 Australian Code of Practice for the Care and Use of Animals for Scientific Purposes. Adult Sprague-Dawley rats (aged >10 wk, >230 g) were housed in a temperature- and humidity-controlled room with 12-h light and dark cycles. Food and water were provided ad libitum. Rats were randomly assigned into control (water only) and pyruvate supplementation (500 mg/kg/day in normal drinking water) groups. Rats were commenced on pyruvate supplementation exactly 1 wk prior to glaucoma induction and continued on pyruvate throughout the experiment. Animals were excluded from further analysis if severe hyphema developed subsequent to laser treatment [29% collectively, which was lower than the hyphema rate of 40% reported by Levkovitch-Verbin et al. (38)].
Experimental glaucoma was induced at day 0 in the right eye of all animals, leaving the left eye untouched to serve as a control. A slightly modified protocol of the method described by Levkovitch-Verbin et al. was used to induce ocular hypertension in the right eye of each animal by laser photocoagulation of the episcleral and circumlimbal vessels (38). In brief, 135 to 150 spots of 100-μm diameter, 340 mW power, and 0.6-s duration were applied to the circumlimbal vessels. An additional 35 to 50 spots, 200-μm diameter, 300 mW power for 0.6-s duration, were delivered to the dominant superior, inferior, and temporal episcleral veins while leaving the nasal episcleral vein and intersecting nasal margins of the circumlimbal vessel patent. Intraocular pressure was monitored using a rebound tonometer (TonoLab, Icare).
PERG was recorded subcutaneously (s.c.) from the snout of mice as previously reported (7, 39). Waveforms were retrieved using an asynchronous averaging method (40).
The processing of optic nerves and staining with paraphenylenediamine (PPD) was as published (41). A segment of optic nerve from within a region up to 1 mm from the posterior surface of the sclera was sectioned (1-µm-thick sections) and stained with PPD. Typically 30 to 50 sections are taken from each nerve. Multiple sections of each nerve were considered when determining damage level. Optic nerves were analyzed and determined to have one of three damage levels: NOE (no or early damage), MOD (moderate damage), or SEV (severe damage) (7). Optic nerve axon counts were performed using AxonJ (42).
A short piece of proximal optic nerve from the right-treated eye of each rat, 1.5 mm behind the globe, was removed for resin processing. In short, proximal optic nerves were fixed by immersion in 2.5% glutaraldehyde with 4% paraformaldehyde in 0.1 M phosphate buffer, pH 7.4 for at least 24 h. Optic nerves were then placed in osmium tetroxide in saline overnight and washed with cocadylate buffer at room temperature (RT). Optic nerves were subsequently dehydrated in graded alcohols and embedded in epoxy resin for transverse sectioning. An ultramicrotome was used to cut sections at 1 μm, which were then mounted on glass slides, and enhanced with osmium tetroxide-induced myelin staining using 1% Toluidine Blue.
For immunohistochemistry performed on optic nerve sections, tissues were postfixed by immersion in 4% paraformaldehyde (PFA) at 4 °C overnight. Optic nerve and chiasma were then processed for routine paraffin-embedded sections, embedded longitudinally, and 5-μm sections were cut. Colorimetric immunohistochemistry was performed as described above. Axonal injury was quantitatively assessed by immunolabeling for SMI-32, an antibody which recognizes the nonphosphorylated chain of neurofilament heavy. SMI-32 has been consistently demonstrated to be a highly sensitive marker of axonal cytoskeleton disruption, owing to the labile nature of nonphosphorylated neurofilament heavy chain and its susceptibility to degradation by calpain. Microglial status was quantitatively assessed by immunolabeling for ED1. ED1 recognizes a single chain glycoprotein that is expressed predominantly on the lysosomal membrane of myeloid cells. The amount of ED1 expression can be correlated to the extent of phagocytic activity. Quantification of immunolabeling for each marker in longitudinal sections of the intracranial optic nerve was performed as previously described (43). For each antigen, immunohistochemistry was performed using one section of mid optic nerve and one section of distal optic nerve adjacent to the optic decussation as previously described. One photomicrograph from each location covering the entire width of the nerve was taken using a 20× microscope objective. They underwent color deconvolution to separate diaminobenzidine reaction product from hematoxylin counterstain using ImageJ. Images were subsequently analyzed with regard to the specifically stained area in pixels using ImageJ. Measurements from one animal were averaged and treated as an independent data point.
Mice were anesthetized using ketamine/xylazine and intraviteally injected with 2 μL AF488 cholera toxin subunit B (CT-β; 1 mg/mL in phosphate buffered saline [PBS]) (Thermo Fisher Scientific). After 72 h, mice were anesthetized and killed via 4% PFA cardiac perfusion. Brains and eyes were postfixed in 4% PFA for an additional 24 h, cryoprotected in 30% sucrose in PBS overnight, optimal cutting temperature compound (OCT) cryoembedded, and sectioned at 20 μm. AF488 was visualized using a Zeiss AxioObserver. Images were recorded at 20× at bregma −2.4 to −2.7 (for the lateral geniculate nucleus [LGN]) and −3.2 to −3.5 (for the superior colliculus [SC]) and whole CT-β for the tissue analyzed using the measure intensity function (mean pixel intensity) in FIJI (ImageJ).
For immunofluorescence staining, mice were killed by cervical dislocation, their eyes enucleated, and placed in 4% PFA overnight. Retinas were dissected and whole-mounted onto slides, permeabilized with 0.1% Triton-X for 15 min, blocked with 2% bovine serum albumin in PBS and incubated overnight at RT in primary antibody (see SI Appendix, Table S1 for a complete list of antibodies used in this manuscript). After primary antibody incubation, retinas were washed five times in PBS and stained for 4 h at RT with secondary antibody. Slides were then washed an additional five times with PBS, labeled with 500 ng/mL DAPI for 15 min, mounted with fluoromount, and sealed with nail polish. For retinal sections, eyes were cryoprotected in 30% sucrose overnight, frozen in OCT, and cryosectioned at 18 μm. Slides were warmed to room temperature and the procedure above was followed. Retinas were imaged on a Zeiss AxioObserver for low-resolution counts.
For phospho-mTOR labeling in D2 mice, control (3.5 mo) and aged (9.5 mo) D2 eyes were enucleated and fixed in 4% PFA on ice for 3 h, followed by cryoprotection with 30% sucrose, OCT embedding, and 10-μm sections were cryosectioned. Slides containing both young and aged eye sections were permeabilized and blocked with PBS, containing 0.5% Triton X-100 and 5% donkey serum in room temperature for 30 min. Fluorescent stainings were done in a three-step protocol using primary antibody overnight at 4 °C, donkey anti-rabbit biotin (Invitrogen, A16027) 1 h at room temperature, and streptavdin-549/DAPI for 1 h at room temperature, with washing by PBS containing 0.5% Triton X-100 three times, 5 min after each step. Images were captured on a Keyence BZ-810 microscope. Intensity of mTOR fluorescent staining was quantified using FIJI. Briefly, the area encompassing the inner plexiform layer (IPL) and ganglion cell layer (GCL) were outlined and mean pixel intensity was recorded. Equal thresholding based on negative control sections (secondary-antibody-only stained) was applied to the background for all images. We compared staining between 15 young control and 15 aged eyes. Phospho-mTOR was increased in 7/15 of the aged eyes with the others being indistinguishable from the controls. This is expected as it is well established that some D2 eyes are molecularly unchanged, being the same as nonglaucoma controls at 9.5 mo, while others have developed early glaucoma with evident molecular changes (7). As molecular markers of disease often enable improved comparions to controls and increased phopsho-mTOR identifies eyes that have responded to IOP and are undergoing early glaucoma (as also evident by mTOR pathway changes by RNA-sequencing), we compared the 7 responding eyes to 7 randomly selected controls. Although confounded by eyes that have not yet changed, the group difference was robust enough to be significant even when comparing all 15 eyes in each group (P = 0.01).
Tissue sections from mouse, rat, marmoset, and human donors were used to visualize mitochondrial pyruvate carrier expression. These studies were approved by the SA Pathology/CALHN Animal Ethics Committee (Adelaide, Australia), and conformed with the Australian Code of Practice for the Care and Use of Animals for Scientific Purposes, 2013, and with the ARVO statement for the use of animals in vision and ophthalmic research. Ocular tissue was collected from adult marmosets (Callithrix jacchus), aged 10 to 14 y, belonging to the colony housed at the Queen Elizabeth Hospital (South Australia, Australia) that were being killed. Human ocular tissue for analysis was obtained from the Eye-Bank of South Australia, Flinders Medical Centre (Adelaide, Australia) following the guidelines of the Southern Adelaide Clinical Human Research Ethics Committee; all had been screened to ensure there was no underlying ocular disease and all were from Caucasian donors aged 50 to 65. There was no consistent orientation of globes with regard to the nasal-temporal, superior-inferior quadrants of the retina analyzed. Sections were typically taken at the level of the optic nerve head and hence comprise at least two quadrants. Globes that were used for immunohistochemistry were immersion fixed in 10% buffered formalin or Davidson’s solution for 24 h (rat and mouse) or 48 h (for marmoset and human eyes), and transferred to 70% ethanol until processing. Eyes were then processed for routine paraffin-embedded sections. Globes were embedded sagittally. In all cases, 4-μm sections were cut. Colorimetric immunohistochemistry was performed as previously described (44). In brief, tissue sections were deparaffinized, endogenous peroxidase activity was blocked, and high-temperature antigen retrieval was performed. Subsequently, sections were incubated in primary antibody, followed by consecutive incubations with biotinylated secondary antibody and streptavidin-peroxidase conjugate. Color development was achieved using 3,3′-diaminobenzidine. Confirmation of the specificity of antibody labeling was judged by the morphology and distribution of the labeled cells, by the absence of signal when the primary antibody was replaced by isotype/serum controls, and by the presence of a comparable signal when an alternative primary antibody was used.
Sprague-Dawley rats were housed according to the Australian Code of Practice for the Care and Use of Animals for Scientific Purposes 2004, and the ARVO statement for the use of animals in ophthalmic and vision research. From stocks, litters of pups (1 to 3 d postpartum) were obtained to derive mixed retinal cell cultures. Cultures were prepared via a sequential trypsin- and mechanical-digest procedure and comprised neurons, including RGCs, glia, and photoreceptors, as previously described (45). Isolated cells were dispensed at 0.5 × 10⁶ cells/mL onto 13-mm borosilicate glass coverslips (precoated for 15 min with 10 µg/mL poly-l-lysine), for immunocytochemistry, or into 96-well plates (CellPlus positive-charge-coated plates, Sarstedt), for viability assays. Cultures were routinely maintained under saturating humidity at 37 °C in minimum essential medium containing 10% (vol/vol) fetal bovine serum (FBS), 5 mM D-glucose, 2 mM l-glutamine, and penicillin/streptomycin.
For treatment of cell cultures, treatments were commenced at 7 d in vitro and were carried out for 24 h. For nutrient deprivation (ND) experiments, culture medium was replaced with one lacking FBS, glucose, pyruvate, and glutamine. Pyruvate was added at appropriate test concentrations (100 µM, 1 mM, and 5 mM) and the monocarboxylate transport inhibitor, 4CIN, was applied at 10 µM. For application of oxidative stress to cells, medium lacking FBS, glucose, and pyruvate but containing 2 mM l-glutamine was used. Glutamine was present in this case because removal of all nutrients caused catastrophic death of all cells within 2 to 4 h and this amino acid has been shown to support neuron survival in vitro (46). When cultures were to be used for immunocytochemistry, cells on coverslips were fixed for 10 min with 10% (wt/vol) neutral buffered formalin containing 1% (vol/vol) methanol. For viability assessment using the 3-(4,5-dimethylthiazol-2-yl)-2,5-diphenyltetrazolium bromide (MTT) assay, for the last hour of the incubation, medium and test compounds were removed and new medium free of potentially confounding dead cells/cell debris was applied along with 0.5 mg/mL MTT. After 1 h, medium was removed from wells again and remaining cells solubilized with dimethyl sulphoxide (DMSO) before colorimetric absorbance was determined at 570 nm (with 630-nm reference).
Fixed cells were permeabilized in 0.1% Triton X-100 (vol/vol) in PBS for 15 min and then blocked in 3.3% (vol/vol) horse serum in PBS (PBS-HS). Primary antibodies were appropriately diluted in PBS-HS and applied to coverslips overnight at room temperature in a moist chamber. After overnight incubation, coverslips were washed in PBS and then labeling was completed by successive incubations with appropriate biotinylated secondary antibody (1:250) and fluorescent Alexa Fluor-conjugated (488 or 594) streptavidin (1:500). Nuclear counterstaining was achieved with a 5-min incubation between PBS washes with 500 ng/mL DAPI. In the case of double labeling of cultures by two antibodies, one was developed as mentioned and the other, concurrently, with an appropriate secondary species-specific antibody directly linked to the opposite colored Alexa Fluor fluorescent label. Quantification of immunocytochemistry was achieved by manually counting labeled cells for each antibody in five fields per coverslip, averaging and rounding to the nearest integer; this represented a single determination.
Whole retina explant culture was performed as previously described (7). Retinas were incubated in pyruvate in retinal explant media at the doses indicated. Retinas were incubated in six-well plates at 37 °C and 4% CO2 for 5 d before being fixed in 4% PFA and stained with DAPI. Retinas were imaged on a Zeiss AxioObserver.
For pyruvate quantification, mice were killed by cervical dislocation and retinas were homogenized in ice-cold Hanks' balanced salt solution and pyruvate was measured following the manufacturer’s instructions (Cayman Chemical). Results were calculated according to the standard curve generated by using standards from the kits. Final metabolite concentrations for each sample were normalized to total protein concentration measured by Bradford assay, and values are shown as percent of young 4-mo-old mice of the respective genotype, as D2-Gpnmb+ mice had lower values at all ages.
Liquid chromatography-mass spectrometry (LC-MS) grade water was purchased from Honeywell (Riedel-de Haën; lot I174P) and formic acid was purchased from Sigma-Aldrich (lot 179247). LiChromasolv hypergrade acetonitrile (lot 10947229817) and 2-propanol (lot K50189881818) for LC-MS analysis were purchased from Sigma-Aldrich. The internal lock masses (purine and HP-0921) and tune mix for calibrating the quadrupole-time of flight mass spectrometry (Q-TOF-MS) (electrospray ionization-low concentration tuning mix) were purchased from Agilent Technologies.
Samples (in 1.5-mL Eppendorf tubes) were kept on dry ice while 150 µL of ice-cold methanol (Optima LC-MS, Fisher Scientific; lot 1862991) was added to each retina sample with a multichannel pipette. Samples were vortexed for 15 s prior to sonication in an ice bath for 15 min. Samples were then centrifuged at 12,000 × g for 12 min at 4 °C. Upon completion, 140 µL of each sample supernatant was added to a separate Ultrafree-MC VV Centrifugal Filter (Sigma-Aldrich; lot R7JA29961) and centrifuged for 4 min at 8,000 × g at original temperature. The supernatant (40 µL each) was transferred to two separate liquid chromatography (LC) vials for zwitterionic hydrophilic interaction liquid chromatography (ZIC-HILIC) and reversed phase analysis. Another 40 µL was collected from each sample and pooled together to represent the quality control (QC). The samples were randomized and after every batch of 12 samples a QC sample was incorporated in order to observe any instrumental drifts, changes in instrument sensitivity, as well as evaluate the % coefficient of variation (%CV) of each detected metabolite.
Liquid chromatography-high resolution mass spectrometry (LC-HRMS) experiments were performed on a 1290 Infinity II ultra-high performance liquid chromatography (UHPLC) system coupled to a 6550 iFunnel Q-TOF mass spectrometer equipped with a dual AJS electrospray ionization source (Agilent Technologies). Polar metabolites were separated on a SeQuant ZIC-HILIC (Merck) column 100 Å (100 mm × 2.1 mm, 3.5 µm particle size) coupled to a guard column (20 mm × 2.1 mm, 3.5 µm particle size) and an inline filter. Nonpolar metabolites were separated on an EclipsePlus C18 2.1 × 100 mm, 1.8 μm column, guard column (2.1 × 5 mm), and an inline filter. For the ZIC-HILIC analysis, mobile phases consisted of 0.1% formic acid in water with (solvent A) and 0.1% formic acid in acetonitrile with (solvent B). The elution gradient used was as follows: isocratic step at 95% B for 1.5 min, 95% B to 40% B in 12 min, and maintained at 40% B for 2 min, then decreasing to 25% B at 14.2 min and maintained for 2.8 min, and then returned to initial conditions over 1 min; the column was equilibrated at initial conditions for 7 min. The flow rate was 0.3 mL min−1, injection volume was 3 µL, and the column oven was maintained at 25 °C. For the reversed phase (RP) analysis, mobile phases consisted of 0.1% formic acid in water (solvent A) and 2-propanol:acetonitrile (90:10, vol/vol) with 0.1% formic acid (solvent B). The gradient elution was set as follows: isocratic step of 5% B for 3 min, 5 to 30% B in 2 min, then B was increased to 98% in 13.5 min, maintained at 98% B for 1.5 min, returned to initial conditions over 0.5 min, and then held for a further 4.5 min. The flow rate was 0.4 mL/min, injection volume was 3 μL, and the column oven was maintained at 50 °C. Two independent injections were run for positive and negative acquisition modes. The Q-TOF MS system was calibrated and tuned according to the protocols recommended by the manufacturer. Nitrogen (purity >99.9990%) was used as a sheath gas and drying gas at a flow of 8 L min−1 and 15 L min−1, respectively. The drying and sheath gas temperature was set at 250 °C, with the nebulizer pressure at 35 psi and voltage 3,000 V (± for positive and negative ionization mode, respectively). The fragmentor voltage was set at 380 V. The acquisition was obtained with a mass range of 50 to 1,200 m/z, where full scan high-resolution data were acquired at three alternating collision energies (0 eV, 10 eV, and 30 eV). The data acquisition rate was six scans sec−1. Between 16 and 25 min, LC flow was diverted to the waste for the ZIC-HILIC analysis. For further details regarding the acquisition methodology, see Naz et al. (47) and Daskalaki et al. (48). Positive and negative raw LC-HRMS files were independently processed with an in-house developed personal compound database and library (PCDL) library for polar and nonpolar metabolites using Profinder version B.06 (Agilent Technologies). Metabolites detected in both ionization modes were correlated, and the ones with a larger relative intensity as well as lower %CV were selected. Proper identification of reported compounds (ZIC-HILIC = 52, reversed phase = 33) was assessed by accurate mass and retention time (AMRT) plus fragment identification at two collision energies (10 and 30 eV) using an in-house generated database. A separate PCDL library was created to screen for isoleucine putatively. Metabolomics data were analyzed using MetaboAnalyst and R using the 86 identified metabolites as a background list for enrichment (49, 50). Metabolite identities were confirmed according to level 1 of the Metabolomics Standards Initiative (16).
mTOR phospho antibody arrays were performed on n = 3 per condition of whole homogenized retina from 9 mo of age D2 and D2-Gpnmb+ mice following the manufacturer’s instructions (Full Moon BioSystems; PMT138). Data were analyzed in R using limma (linear models for microarray data, designed for microarray analysis but suitable for other data types) (5152–53).
RNA-sequencing data were accessed through the Gene Expression Omnibus (accession number GSE90654) and analyzed as previously described in R (7).
The sample size (number of eyes, n) is shown in each figure legend. Graphing and statistical analysis was performed in R. Student’s t test was used for pairwise analysis in quantitative plots and Fisher’s exact test for optic nerve analysis. Where multiple groups were compared, a one-way ANOVA was employed, with a post hoc Tukey–Kramer test. For boxplots, center hinge represents the median, the upper and lower hinges represent the first and third quartiles, whiskers represent 1.5 × interquartile range, and values beyond the whiskers are plotted as outliers. Unless otherwise stated *P < 0.05, **P < 0.01, ***P < 0.001.
P.A.W. is supported by funding from Vetenskapsrådet (2018-02124), StratNeuro (StartUp grant), Karolinska Institutet in the form of a Board of Research Faculty Funded Career Position, and by St. Erik Eye Hospital philanthropic donations. S.W.M.J. was funded by NEI grant EY011721, the Barbra and Joseph Cohen Foundation and startup funds from Columbia University Irving Medical Center and its Precision Medicine Initiative. Work at Columbia University was also supported by core grant P30EY019007 and unrestricted departmental funds from Research to Prevent Blindness. S.W.M.J. is an Investigator of HHMI. We thank Mimi de Vries and Amy Bell for assistance with organizing mouse colonies and intraocular pressure measurements; and the staff of the histology, gene expression services, and computational sciences at The Jackson Laboratory and Columbia University, including John Peregrin.
All study data are included in the article and supporting information.
1
2
3
4
5
6
7
8
9
10
11
12
13
14
15
16
17
18
19
20
21
22
23
24
25
26
28
29
30
31
32
33
34
35
36
37
38
39
40
41
42
43
44
45
46
47
48
49
50
51
52
 Disturbed glucose and pyruvate metabolism in glaucoma with neuroprotection by pyruvate or rapamycin
 Facebook
 Twitter
 Linkedin
 Whatsapp
