
Edited by Nils Chr. Stenseth, University of Oslo, Oslo, Norway, and approved October 20, 2020 (received for review June 26, 2020)
Author contributions: F.S., B.F.M., and D.B. designed research; F.S. and B.F.M. performed research; F.S., B.F.M., O.J., D.H., and A.Z. analyzed data; and F.S., B.F.M., and D.B. wrote the paper.
During the COVID-19 pandemic, mobility restrictions have proved to be an effective mitigation strategy in many countries. To apply these measures more efficiently in the future, it is important to understand their effects in detail. In this study, we use mobile phone data to uncover profound structural changes in mobility in Germany during the pandemic. We find that a strong reduction of long-distance travel rendered mobility to be more local, such that distant parts of the country became less connected. We demonstrate that due to this loss of connectivity, infectious diseases can be slowed down in their spatial spread. Our study provides important insights into the complex effects of mobility restrictions for policymakers and future research.
In the wake of the COVID-19 pandemic many countries implemented containment measures to reduce disease transmission. Studies using digital data sources show that the mobility of individuals was effectively reduced in multiple countries. However, it remains unclear whether these reductions caused deeper structural changes in mobility networks and how such changes may affect dynamic processes on the network. Here we use movement data of mobile phone users to show that mobility in Germany has not only been reduced considerably: Lockdown measures caused substantial and long-lasting structural changes in the mobility network. We find that long-distance travel was reduced disproportionately strongly. The trimming of long-range network connectivity leads to a more local, clustered network and a moderation of the “small-world” effect. We demonstrate that these structural changes have a considerable effect on epidemic spreading processes by “flattening” the epidemic curve and delaying the spread to geographically distant regions.
During the first phase of the coronavirus disease 2019 (COVID-19) pandemic, countries around the world implemented a host of containment policies aimed at mitigating the spread of the disease (123–4). Many policies restricted human mobility, intending to reduce close-proximity contacts, the major driver of the disease’s spread (5). In Germany, these policies included border closures, travel bans, and restrictions of public activity (school and business closures), paired with appeals by the government to avoid trips voluntarily whenever possible (6). We refer to these policies as “lockdown” measures for brevity.
Based on various digital data sources such as mobile phone data or social media data, several studies show that mobility significantly changed during lockdowns (7). Most studies focused on general mobility trends and confirmed an overall reduction in mobility in various countries (891011–12). Other research focused on the relation between mobility and disease transmission: For instance, it has been argued that mobility reduction is likely instrumental in reducing the effective reproduction number in many countries (13141516–17), in agreement with theoretical models and simulations, which have shown that containment can effectively slow down disease transmission (1819–20).
However, it remains an open question whether the mobility restrictions promoted deeper structural changes in mobility networks and how these changes impact epidemic spreading mediated by these networks. Recently, Galeazzi et al. (21) found increased geographical fragmentation of the mobility network. A thorough understanding of how structural mobility network changes impact epidemic spreading is needed to correctly assess the consequences of mobility restrictions not only for the current COVID-19 pandemic, but also for similar scenarios in the future.
Here, we analyze structural changes in mobility patterns in Germany during the COVID-19 pandemic. We analyze movements recorded from mobile phones of 43.6 million individuals in Germany. Beyond a general reduction in mobility, we find considerable structural changes in the mobility network. Due to the reduction of long-distance travel, the network becomes more local and lattice-like. Most importantly, we find a changed scaling relation between path lengths and geographic distance: During lockdown, the effective distance (and arrival time in spreading processes) to a destination continually grows with geographic distance. This shows a marked reduction of the “small-world” characteristic, where geographic distance is usually of lesser importance in determining path lengths (22, 23). Using simulations of a commuter-based susceptible-infected-removed (SIR) model, we demonstrate that these changes have considerable practical implications as they suppress (or “flatten”) the curve of an epidemic remarkably and delay the disease’s arrival between distant regions.
We base our analysis on mobility flows collected from mobile phone data. The data counts the number of trips, where a trip is defined as a single mobile phone switching cell towers at least once, between two resting phases of at least 15 min (Fig. 1D). A resting phase is defined as a mobile phone not switching its connected cell tower. These trips are aggregated over the course of a day to build the daily flow matrix . The element quantifies the total number of trips from location to location on a given day . Locations are the counties of Germany. Note that flows within counties are included. During times with normal mobility (e.g., during March 2019, which we use as a baseline, see below) the total flow is trips per day on average, recorded among 43.6 million users (24), corresponding to an average of 3.8 trips per user per day. The baseline average daily flow between all pairs of locations is (averaged over all days in March 2019) with a SD of . Flows below a threshold of were omitted from the data due to anonymization requirements.

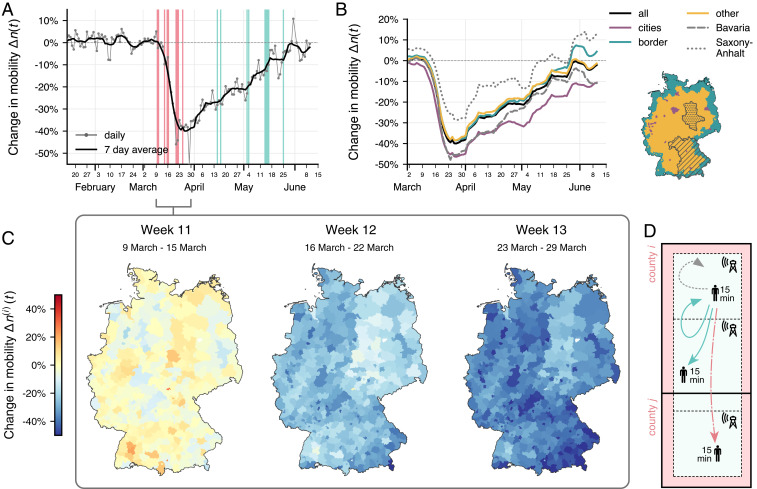
Mobility changes in Germany during the COVID-19 pandemic. (A) The change in total movements in 2020, relative to March 2019. Mobility decreases drastically in mid-March, coincident with restricting measure implementations (red bars), followed by a gradual increase in mobility concurrent with the lifting of restricting policies (teal bars). Bar width indicates the number of policies issued or lifted on that date, respectively. (B) The change in mobility is spatially heterogeneous. Mobility is reduced more in large cities (shown here for the 20 largest cities) and states that implemented more severe restrictions (such as Bavaria). (C) Mobility change in German counties for the 3 wk with most substantial global change. The mobility change represents the number of trips that originate in county (Materials and Methods). (D) Illustration of how mobility is recorded. A trip is counted when a user switches to one or multiple new cell towers, until the user becomes stationary again (no further switch for approximately 15 min). Trips can be within the same county (teal, solid line) or between different counties (red, dotted-dashed line). Movements without changing cell towers are not recorded (gray, dotted line).
To analyze general changes in mobility during the COVID-19 pandemic, we focus on the daily mobility change , which is the relative difference in the total number of trips compared to the baseline number of trips, i.e., during a period of “normal” mobility. Here, we use March 2019 as this baseline period and compare the mobility on each date from 2020 to the average mobility on the corresponding weekday in March 2019 (Materials and Methods).
We find that mobility in Germany was substantially reduced during the COVID-19 pandemic (Fig. 1). The largest reduction occurred in mid-March, when the vast majority of mobility-reducing interventions took effect (information on government policies is taken from the ACAPS dataset (6); SI Appendix). Over the course of 3 wk, mobility dropped to below baseline on March 27 in the 7-d moving average. The total number of daily recorded trips decreased from to trips (from 3.8 to 2.3 daily trips per user). The decline was followed by an immediate rebound at the beginning of April, even though mobility-restricting regulations remained in effect during this period. In the following months, mobility increased slowly, reaching its prelockdown levels in early June. Interestingly, the increase in mobility took place in small bursts followed by short periods of stagnation. These bursts started at around the same time that mobility-restricting policies were lifted, hinting at a causal relationship.
Mobility did not decrease homogeneously in Germany: Some areas witnessed a more substantial reduction than others. We observed a greater mobility reduction in western and southern states (such as Bavaria), which were more substantially affected by the pandemic, compared to the eastern states of Germany (for example, in Saxony-Anhalt) (25). This difference can partially be explained by more severe mobility restrictions in some western states. For instance, Bavaria passed stricter measures on May 20, resulting in a higher reduction in mobility in calendar week 13. Still, most policies were uniform across Germany and were implemented in a similar manner on a federal level. Therefore, differences in policies can deliver only a partial explanation for regional heterogeneities. Furthermore, we found systematic dependencies on demographic factors. Mobility is reduced more in large cities compared to less densely populated areas. In addition, several border regions particularly associated with cross-border traffic exhibit a higher than average mobility reduction, although the border as a whole does not deviate markedly from the average.
The observed general reduction in mobility begs the question of how mobility has changed and what types of trips were reduced. We observe a distinct dependence of mobility change on trip length (Fig. 2). We calculated the mobility change for all trips in a certain distance range . Because data are aggregated on a county level, we use the distance between the county centroids as an estimate of trip distance (Materials and Methods).
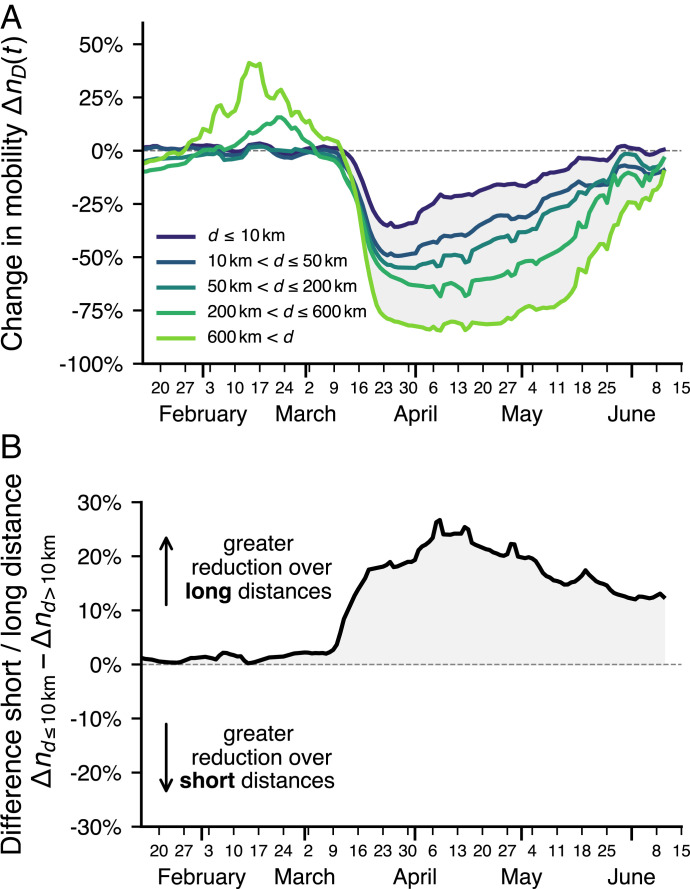
Mobility reduction as a function of distance. (A) Relative mobility changes for different distance ranges (7-d moving averages). Long-distance trips reduction is higher. The notable increase in long-distance trips in February coincides with school holidays in several German states. Fluctuations in April and May are often centered around public holidays. (B) The difference between short-distance mobility change and long-distance change is a useful indicator for unusual mobility.
Over the full range of observed distances, we find that long-distance trips decreased more strongly than short-distance trips. This resonates with the expectation that many social-distancing policies targeted long-distance travel specifically: travel bans across country and state borders, cancellations of major events, and border closures by other countries affecting holiday travel.
Furthermore, we find that the split between short- and long-distance mobility reduction is a useful indicator for an unusual state of the mobility network. While the total number of trips has almost returned to its prepandemic state (Fig. 1A), which could at first glance give the impression that normal mobility patterns have been restored, the continued discrepancy between short- and long-distance mobility reduction indicates a long-lasting structural change in mobility patterns (Fig. 2). The discrepancy, while declining slightly, remained stable over the course of the pandemic, evidence for the prevalent impact of mobility changes.
To identify key structural changes over time, we analyze the mobility networks for each calendar week , where the edge weights correspond to the average daily flow along the edge during this week (Materials and Methods). To highlight the changes occurring during lockdown, we compare two specific time periods: The prelockdown network is constructed from the trips in calendar week 10 (March 2 to 8), before policy interventions were passed. The lockdown network is constructed from all trips in calendar week 13 (March 23 to 29, the week with the highest reduction in mobility).
The lockdown network is considerably less dense than the prelockdown network (Fig. 3). Many pairs of counties with traffic under normal conditions lack traffic during the lockdown week or the average daily flow fell below the anonymization threshold . In particular, the lockdown network has fewer long-distance flows than the prelockdown network (Fig. 3C), in line with our previous finding that mobility over long distances was reduced most substantially (compare Fig. 2).
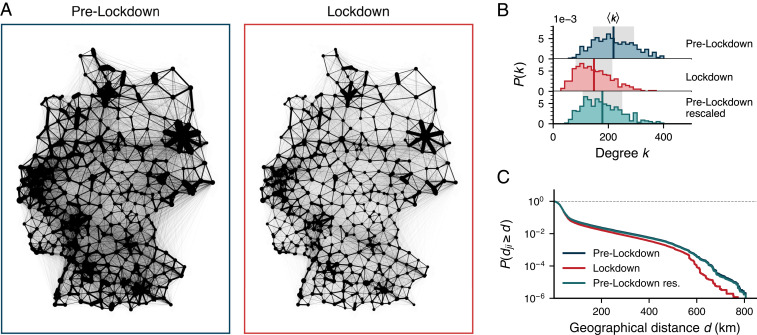
Comparison of the prelockdown mobility network and the lockdown network corresponding to calendar weeks 10 and 13, respectively. (A) Depiction of the networks. Line widths indicate the average number of daily trips along each connection. During lockdown, there are fewer trips in total, fewer unique edges, and fewer long-distance connections. (B) Distribution of node degrees . The average node degree and network density are lower during lockdown () than in the prelockdown network (). These differences are only partially explained by a uniform, global reduction of trips (which causes trips to fall below the anonymization threshold ), as demonstrated by comparison to the rescaled prelockdown network which is structurally similar to network but has the same number of total trips as (Materials and Methods). (C) The probability that a randomly chosen edge is of a distance . The lockdown network contains considerably fewer long-distance trips than the prelockdown network, an effect that cannot be explained by a uniform, global reduction of flows (rescaled prelockdown network).
The loss of density during lockdown cannot be explained by a global, uniform reduction of mobility alone, which causes trips to fall below the observation threshold . To illustrate this point, we compare the lockdown network to the rescaled network where edge weights of the prelockdown network were rescaled such that it is structurally similar to the prelockdown network but has the same total number of trips as the lockdown network (Materials and Methods). This rescaling can rule out effects that originate in a homogeneous, global mobility reduction. We find that the rescaled prelockdown network is denser than the lockdown network. Specifically, we find a greater probability of observing long-distance travel (Fig. 3 B and C). We conclude that long-distance travel has been reduced more substantially during lockdown than can be explained by a mere global reduction of mobility and thresholding effects.
The structural mobility changes during lockdown impact properties typically associated with the so-called small-world characteristic of the network (22), namely the shortest path lengths between counties and the clustering coefficient of nodes (definitions in Materials and Methods). The shortest path length can be related to time scales for search or spreading processes, i.e., the time it takes to reach one location starting at another. The clustering coefficient quantifies the magnitude of the average flow between triplets of neighboring locations—a large value indicates that two neighbors of a location are likely to have large flows between them, too. Numerous systems are associated with high clustering while having small shortest paths (typically mean shortest paths scale logarithmically with systems size), which is referred to as the small-world property. This property typically facilitates the spread of epidemics (26, 27). In contrast, lattices typically have shortest paths scaling polynomially with system size and high clustering and thus comparatively slower spreading speeds (28).
We observe substantial changes in the structural properties of the mobility networks during lockdown, as illustrated by the shortest path trees for the weekly mobility networks (Fig. 4A). In the prelockdown network , long-distance connections enable a quick traversal of the network followed by few local steps. In the lockdown network , the shortest paths are generally longer and include more local steps between neighboring counties. As a consequence of these structural changes, both the average shortest path length and average clustering coefficient increase substantially (Fig. 4B). Moreover, we observe a striking difference in expected path length as a function of geographic distance (Fig. 4C). In the prelockdown network, the expected shortest path length initially increases with geographical distance , but eventually levels out at an almost constant level for , i.e., is independent of geographic distance. This is a well-known phenomenon of spatial small-world networks, where it has been shown that shortest path lengths typically scale as with Euclidian distance up to a critical distance , followed by an independence regime, for (29). A similar relation has been found in empirical human mobility networks such as air traffic networks (23). In such networks, geographic distance is an unreliable predictor for the effective arrival time because larger geographical distances can quickly be overcome by traveling along links connecting distant places. However, in the lockdown network, we observe a continued, almost linear dependence of the shortest path length on geographical distance, which is a typical property of lattices (28). Because long-distance links are missing or weak, and travel predominantly occurs along short-distance connections, geographical distance dominates effective travel distance or travel duration.
![Lockdown effects on structural network metrics. (A) The shortest path tree originating at Berlin for the weekly mobility networks GT. In the prelockdown network G10 (week T0=10, blue frame), long-distance connections facilitate quick traversals. In the lockdown network G13 (week T=13, red frame), shortest paths are generally longer and include more local steps between neighboring counties. Radial distance is scaled in multiples of the average shortest path length L(T0) in week T0=10. Gray circles mark the largest shortest path length in week 10. Further plots for Berlin and for other sources (which we find to exhibit qualitatively similar changes) are provided in SI Appendix, section 3D. (B) The average shortest path length L(T) and the average clustering coefficient C(T) for weekly mobility networks GT over time, relative to their values in week T0=10 (blue bar). Both metrics increase substantially in the following weeks and peak for the lockdown network G13 (red bar), indicating a more clustered and sparser network. (C) The expected shortest path length Ld(T) at distance d, i.e., Ld(T)=⟨Lji(T)|dji∈[d−ϵ,d+ϵ]⟩. In the prelockdown network G10, the shortest path length Ld is independent of geographical distances d at large distances, a known phenomenon of spatial small-world networks. In contrast, we observe a continued, roughly linear, scaling relation for Ld in that distance range for the lockdown network G13, a known property of lattices. The rescaled, prelockdown network G10* (T=13) does not replicate the changed scaling behavior, demonstrating that the effect is not solely explained by a global, uniform reduction of mobility and thresholding effects.](/dataresources/secured/content-1765760000144-6027ebae-7d72-4ba0-aec2-eb7bdb7efb10/assets/pnas.2012326117fig04.jpg)
Lockdown effects on structural network metrics. (A) The shortest path tree originating at Berlin for the weekly mobility networks . In the prelockdown network (week , blue frame), long-distance connections facilitate quick traversals. In the lockdown network (week , red frame), shortest paths are generally longer and include more local steps between neighboring counties. Radial distance is scaled in multiples of the average shortest path length in week . Gray circles mark the largest shortest path length in week 10. Further plots for Berlin and for other sources (which we find to exhibit qualitatively similar changes) are provided in SI Appendix, section 3D. (B) The average shortest path length and the average clustering coefficient for weekly mobility networks over time, relative to their values in week (blue bar). Both metrics increase substantially in the following weeks and peak for the lockdown network (red bar), indicating a more clustered and sparser network. (C) The expected shortest path length at distance , i.e., . In the prelockdown network , the shortest path length is independent of geographical distances at large distances, a known phenomenon of spatial small-world networks. In contrast, we observe a continued, roughly linear, scaling relation for in that distance range for the lockdown network , a known property of lattices. The rescaled, prelockdown network does not replicate the changed scaling behavior, demonstrating that the effect is not solely explained by a global, uniform reduction of mobility and thresholding effects.
We therefore conclude that the lockdown network is more lattice-like, with predominantly local connections and fewer connections between remote locations, reflecting a reduction of the system’s small-world property. As indicated above, this has important implications for dynamical processes such as epidemic spreading, which we discuss in the next section.
The unexpected scaling relation between path lengths and geographic distance during lockdown cannot merely be explained by the fact that the total flow is reduced in the lockdown network, and neither is it due to thresholding effects. To demonstrate this, we use the rescaled prelockdown network as a comparison. As we see in Fig. 4C, the reduced flow accounts for the changes at small distances, but it does not explain the different dependence of the shortest path length on geographical distance at large distances. This confirms that the observed effect is due to structural differences between the prelockdown and lockdown networks. In SI Appendix, section 3, we present further evidence to support this conclusion by evaluating how several spreading time scales change over time in both the measured mobility networks and rescaled networks.
Finally, we address the question of to what extent the lockdown-induced changes in mobility impact epidemic spreading processes mediated by the mobility network. We simulate an SIR epidemic metapopulation model (30, 31). In SIR models, individuals are assumed to be in one of three distinct states: susceptible (S), infected (I), or removed (R) from the transmission process. Contacts between susceptibles and infecteds may lead to the infection of the susceptible individual and infected individuals can spontaneously be removed from the transmission process by medical/nonmedical interventions, death, or immunization. In metapopulation models, infecteds based in one location can cause infections in other locations with a rate proportional to the daily flow between locations. Implicitly it is assumed that individuals travel back and forth and transport the infection between areas.
Note that in the following, we use epidemiological parameters similar to those of COVID-19 (Materials and Methods). However, we do not aim to replicate the actual spread of COVID-19 in Germany, but rather intend to demonstrate qualitative effects of the lockdown on epidemic spreading in general.
We implement a well-known commuter-dynamics SIR metapopulation model (32) with minor modifications. Specifically, the original model does not account for changes in the total amount of mobility (i.e., total number of trips). The modified model accounts for the drastic reduction in total mobility, a substantial part of the changed mobility patterns due to containment measures.
To include changes in the total amount of mobility in the model, we assume that a reduction in mobility reduces the rate with which contacts between infecteds and susceptibles cause infections. We implement this in two variants, to capture different methodological approaches: In the “distancing” scenario, mobility reduction leads to a proportional reduction in the average number of contacts. The “isolation” scenario instead implies that the equivalent percentage of the population isolates at home while the remaining individuals do not change their behavior (see Fig. 5A for an illustration and Materials and Methods and SI Appendix for details on the SIR model). Note that while many other nonpharmaceutical interventions may mitigate the spread of an infectious disease, we purely aim to discuss the effect of reduced and restructured mobility here.
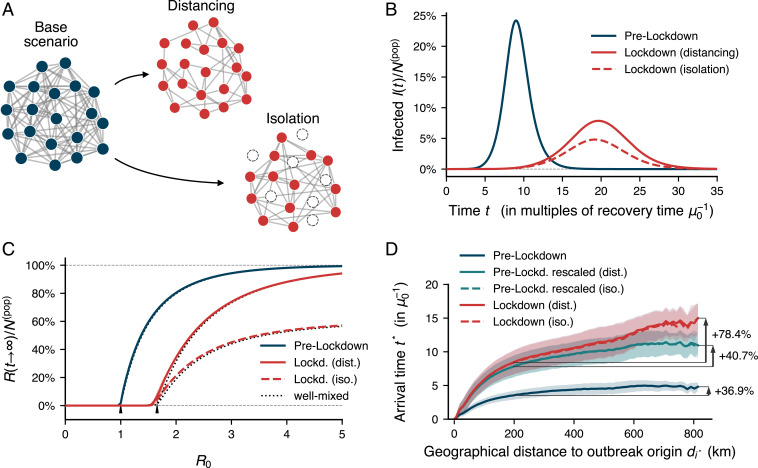
Simulations of an SIR epidemic on prelockdown and lockdown mobility networks. (A) We incorporate changes in total mobility in two scenarios in the model: In the “distancing” scenario, reduced mobility removes contacts between individuals, uniformly distributed over all individuals. In the “isolation” scenario, reduced mobility implies that an equivalent fraction of individuals isolate at home and are effectively removed from the system (see main text and SI Appendix for details). (B) In both model scenarios, the epidemic curve (infecteds over time) is flattened and its peak shifted to later times during lockdown. Note that we omit simulations on the rescaled network that yield similar results, indicating that the observed flattening effect is dominated by a decreasing basic reproduction number rather than structural changes. Results are shown for and recovery rate , with a single random outbreak origin of , averaged over 1,000 simulations for each scenario. (C) The epidemic threshold is shifted to higher values of during lockdown in both lockdown scenarios. Arrows indicate the well-mixed epidemic thresholds at (prelockdown) and (lockdown). (D) The average arrival times in counties as a function of geographic distance from the outbreak origin . The arrival time is defined as the first time when infecteds pass the threshold of in a county. In the lockdown network, arrival times increase due to lower mobility. More importantly, however, we observe a similar scaling relationship as shown for the shortest path lengths: During lockdown, the arrival time shows a continued increase as a function of geographic distance from the outbreak origin, even in the long-distance regime. The changed scaling behavior cannot be explained by the lower total amount of trips (rescaled network).
An analysis of the SIR model indicates that lockdown measures have a distinct impact on epidemic spreading (Fig. 5). Most prominently, a reduction of mobility reduces the overall incidence of the epidemic and delays its spread, shifting the peak to later times: The lockdown measures “flatten the curve” of the epidemic (Fig. 5B). This applies to both lockdown scenarios implemented here, where the stricter isolation scenario shows a lower overall incidence. The rescaled prelockdown network shows an almost identical incidence curve to the lockdown network (not shown here), which indicates that the flattening is mostly caused by the reduction in overall traffic.
In addition, lockdown measures increase the epidemic threshold of the disease, that is, the minimal force of infection required to infect a substantial amount of the population (Fig. 5C). We compare the simulations to results of the canonical well-mixed model (Materials and Methods). We find little difference between the results of the metapopulation simulation and the well-mixed model, which suggests that stochasticity plays only as small role in the metapopulation system.
An important observation is that the spread of the epidemic shows a similar functional dependence on geographic distances as the shortest paths. This implies that the observed structural changes have considerable practical implications. To clarify this point we measured the arrival times of the epidemic in counties (Fig. 5D). During lockdown, the epidemic takes longer to spread spatially, which is caused by the reduced contact numbers due to reduced mobility. More importantly, a stronger and continued increase of the arrival time with geographic distance from the outbreak origin during lockdown is observed: The farther away a county is from the outbreak origin, the longer it will take for the county to be affected by the epidemic. In contrast, with prelockdown mobility, the arrival times exhibit only a slow increase with geographic distance. Furthermore, the rescaled network does not replicate the changed scaling relation of arrival times during lockdown, which demonstrates that it is not caused by a reduction in the total amount of trips.
The dependence of arrival times on geographic distance in Fig. 5D matches the corresponding relationships for the shortest path lengths depicted in Fig. 4C. Therefore, structural changes—i.e., a reduced connectivity across long distances—have direct consequences for the dynamics of an epidemic, mitigating the spatial spread over long distances.
In this study, we report and analyze various lockdown-induced changes in mobility in Germany during the initial phase of the COVID-19 pandemic. We found a considerable reduction of mobility during the pandemic, similar to what was previously reported for other countries that passed and implemented comparable policies (8910–11). The reduction in mobility can be divided into a swift decrease, early in the lockdown phase, followed by a slow recovery. The initial rebound occurred in late March although official policies remained unchanged. This could be indicative of individuals taking up nonessential trips again despite lockdown policies. We think that further research is necessary to illuminate what part of the mobility reduction was a direct consequence of policies and which part was caused by voluntary behavioral changes within these official regulations.
We found evidence for profound structural changes in the mobility network. These changes are primarily caused by a reduction of long-distance mobility, resulting in a more clustered and local network, and hence a more lattice-like system. Most importantly, we found that path lengths continually increase with geographic distance, which is a qualitative change compared to prelockdown mobility. These changes indicate a reduction of the small-world characteristic of the network.
In the context of human mobility, the structural network changes can be interpreted in different ways. Fewer individuals travel along connections of growing distance. One possible reason for this is that the individual “cost” of traversing long-distance connections has increased, more so than that for short-distance links, for example due to legal restrictions on travel, missing transportation options (such as flights), or slower and reduced transportation overall. As a result, people might avoid such travel or break up their travel in smaller trip segments.
The practical consequences of our findings are highlighted in the epidemic simulations analysis. We found that reduced global mobility during lockdown likely slowed down the spatial spread of the disease. Regarding structural changes, we found that the arrival times in counties increase continuously with the distance to the outbreak origin during lockdown, matching results of the topological analyses of the shortest path lengths. This result emphasizes our argument that the changes in the mobility network shown in this study have direct and nontrivial consequences on dynamic processes such as epidemic spreading. Our findings also suggest that targeted mobility restrictions may be used to effectively mitigate the spread of epidemics. In particular, measures that reduce long-distance travel mitigate a diseases’ spread during the first phase of an outbreak while a reduction in general mobility may be associated with a flattened prevalence curve.
In conclusion, we hope that future research will further illuminate the complex effects of restrictive policies on human mobility. Deeper and more complex aspects of mobility changes may occur during lockdowns, ranging from topological properties of the mobility network to its relation to sociodemographic and epidemiological conditions of the affected regions. We hope that a clearer understanding of complex effects of mobility-restricting policies will enable policymakers to use these tools more effectively and purposefully and thus help to mitigate the ongoing COVID-19 pandemic and to better prepare us for future epidemics.
To investigate national mobility trends, we focus on the total number of trips on the date . To judge whether mobility has changed during the pandemic, we compare the mobility during the pandemic to a baseline period with normal mobility . Different comparison time frames can be chosen and no clear, optimal choice that exhaustively accounts for seasonal effects, holidays, and general changes in mobility patterns exists. Here, we use March 2019 as a comparison, which we assume to be structurally closest to the period of March 2020 where most interventions took place.
For a given date within the time frame of the pandemic , we calculate the mobility change by comparing the number of trips to the expected number of trips during the baseline mobility period as
When we calculate the distance-dependent mobility change , we proceed similarly to the previous section, but we consider only trips whose distance falls into a certain distance range . As a proxy for the distance of flows , we use the geographical distance between the centroids of counties and . The number of trips in the distance range is
We create weekly mobility networks from trips measured during calendar week . Let denote the set of days in calendar week . The edge weights are then calculated as the average daily number of trips between counties during this week,
To investigate how the global reduction of mobility affects our observations in comparison to structural changes, we construct rescaled networks by scaling the weights of the prelockdown network of calendar week 10 by the flow lost during week ; i.e., we set
To measure path lengths in the network, we consider two counties to be “close” to each other when they are connected by a large flow value and define the distance of each link as the inverse weight along the edge . Using this distance metric we calculate the shortest path length between each pair of source node and target node using Dijkstra’s algorithm (33). We calculate the weekly average path length and the average weighted and directed clustering coefficient over all nodes for the weekly networks (as defined in ref. 34). Because the above definition of distance is sensitive to changes in the total flow of the network, we discuss a variety of other distance scales in SI Appendix, yielding similar results (SI Appendix, sections 3B and 3C). Additionally, we show that increasing the observation threshold does not substantially change the results, indicating that the original threshold of the data was chosen small enough to not have an impact on our conclusions.
We use a modified version of the model proposed in ref. 32 where susceptible , infected , and recovered individuals are associated to be part of commuter compartments (with ) when they live in location and work in location . The compartments are coupled by shared work and home locations, respectively, and commuter-compartment population sizes are assumed to be proportional to the edge-specific outflux ratio of location as . Full details are given in SI Appendix, section 4.
As stated in the main text, we incorporate two different variations of lockdown mechanisms into the model, to account for different interpretations of the influence of mobility reduction on the average number of contacts. In the distancing scenario, we assume that a mobility reduction by a factor in a location leads to a linear reduction in the transmission rate throughout the epidemic; i.e., . The assumption here is that the reduced mobility uniformly translates into reduced contacts between individuals. In the other, stricter scenario of isolation, we instead assume that the reduced mobility means that individuals stop their commuting and are effectively removed from the system. We implement this by assuming that initially, a fraction is removed from the transmission process such that and . Both scenarios lead to a reduction of the basic reproduction number that is proportional to a reduction of mobility. In SI Appendix, section 5, we argue that such a linear relationship corresponds to an upper bound of transmissibility reduction induced by mobility reduction.
Recent metareviews estimate the basic reproduction number for COVID-19 in the range of 2 to 3 and the infectious period as roughly 7 d (3536–37). Accordingly, we use and a recovery rate of , close to values previously used for the analysis of the disease’s spread in Germany (14).
We thank Luciano Franceschina, Ilya Boyandin, and Teralytics for help regarding the mobile phone data. We also thank Vedran Sekara, Manuel Garcia-Herranz, and Annika Hope Rose for helpful comments regarding the analyses. B.F.M. is financially supported as an Add-on Fellow for Interdisciplinary Life Science by the Joachim Herz Stiftung.
The mobile phone dataset is deposited in the Open Science Framework (OSF) repository for the COVID-19 mobility project (38) in an anonymized form, which will enable readers to replicate the main results of this paper (see SI Appendix for a description of the anonymization process). All other datasets used are publicly available: the ACAPS dataset on government policies (6), population data (39), and county-level geodata for Germany (40). Their sources and details are also listed in SI Appendix. The Python code used for the SIR simulation is available at https://github.com/franksh/EpiCommute and included in the OSF repository (38).
1
2
3
4
5
6
7
8
9
10
11
12
13
14
15
16
17
18
19
20
21
22
23
24
25
26
27
28
29
30
31
32
33
34
35
36
37
38
39
40
 COVID-19 lockdown induces disease-mitigating structural changes in mobility networks
 Facebook
 Twitter
 Linkedin
 Whatsapp

