
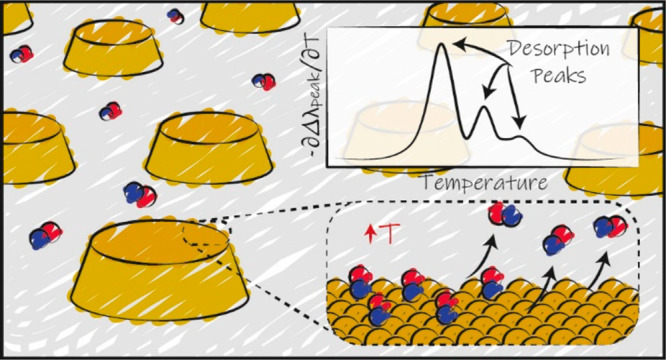
Temperature-programmed desorption (TPD) allows for the determination of the bonding strength and coverage of molecular mono- or multilayers on a surface and is widely used in surface science. In its traditional form using a mass spectrometric readout, this information is derived indirectly by analysis of resulting desorption peaks. This is problematic because the mass spectrometer signal not only originates from the sample surface but also potentially from other surfaces in the measurement chamber. As a complementary alternative, we introduce plasmonic TPD, which directly measures the surface coverage of molecular species adsorbed on metal nanoparticles at ultrahigh vacuum conditions. Using the examples of methanol and benzene on Au nanoparticle surfaces, the method can resolve all relevant features in the submonolayer and multilayer regimes. Furthermore, it enables the study of two types of nanoparticles simultaneously, which is challenging in a traditional TPD experiment, as we demonstrate specifically for Au and Ag.
Temperature-programmed desorption (TPD) spectroscopy along with temperature-programmed reaction probe adsorbate–surface interactions through examining the thermodynamics and kinetics of molecular desorption from a surface1 and find application in fundamental surface science and catalysis.2 For all of these areas, interactions between molecules and nanoparticles may be of particular interest due to the enhanced reactivity of the nanoparticles, as well as their unique optical properties. In traditional mass spectrometry-based TPD studies (MS-TPD), a linear temperature ramp induces desorption of adsorbed species from a surface in an ultrahigh vacuum (UHV) environment, and the resulting rise in the localized partial pressure is used to infer the initial surface coverage and configuration of the adsorbates. However, despite TPD being a workhorse in surface science for decades, the MS-TPD approach has a number of shortcomings. For example, any information retrieved about what is occurring on the surface during the temperature ramp must be inferred indirectly from the kinetics and thermodynamics of desorption of previously adsorbed species on the surface and detected by the MS. In other words, the method does not provide any direct information about the surface or adsorbates on it. Second, mass spectrometers are not inherently selective to desorbed species stemming only from the target surface since desorption of molecules from other surfaces in the chamber, such as heating wires, can be difficult to deconvolute. This nonselective readout also prohibits the use of MS-TPD to study more than one target surface simultaneously. Finally, the MS-TPD technique is also blind to adsorption and readsorption events onto the target surface that might occur during the temperature ramp.
Here, we present an alternative and complementary solution, plasmonic TPD (P-TPD) based on localized surface plasmon resonance (LSPR), with which adsorbates at (sub)monolayer coverage on a surface can be directly measured by continuously recording the optical absorbance spectra of plasmonically active nanoparticles at UHV conditions in a TPD experiment. To validate the methodology, we examined the desorption of two chemical species, namely, methanol (CH3OH) and benzene (C6H6), from nanofabricated arrays of Au nanoparticles. These species have previously been shown to reversibly desorb from Au(111) surfaces using traditional MS-TPD,3−5 and their monolayer desorption behaviors are different from one another, allowing benchmarking of the capabilities of our approach. As the final step we then demonstrate that desorption from two chemically different types of nanoparticle surfaces can be tracked simultaneously and analyzed independently, constituting a significant step beyond the capabilities of traditional MS-TPD.
To set the stage for P-TPD, we remind ourselves that desorption of adsorbates from a surface follows Arrhenius behavior and can be precisely described by the Polanyi–Wigner equation:6
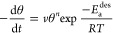

To demonstrate the P-TPD concept, we nanofabricated quasi-random arrays of Au nanodisks with 120 nm diameter and 20 nm thickness onto a sapphire substrate15,16 (Figure 1a, also see Methods). The sample was then mounted in an UHV system with optical access to enable online optical extinction measurements during linear temperature ramps and controlled exposure to the desired molecular species to form (sub)monolayers. For the P-TPD experiment, the system was first heated to 500 K for 1 h to desorb any residual species from the sample and render a clean Au nanoparticle surface. Subsequently, after cooling, the sample temperature was ramped linearly from 100 to 300 K at a rate of β = 0.2 K/s while the optical extinction spectra of the clean surface as a function of temperature were simultaneously recorded (Figure 1b). This initial clean run was performed as a calibration to exclude the temperature dependence response of the Au nanoparticles from the P-TPD spectrum. The corresponding spectral position of the LSPR peak maximum, λpeak, as obtained by fitting a Lorentzian to the measured spectra, is depicted in Figure 1c and exhibits a linear dependence on temperature, in good agreement with earlier reports for similar Au nanoparticle arrays.17,18 This linearity stems predominantly from the thermal expansion of the Au nanoparticles upon heating.12,17

(a) SEM image of the nanofabricated Au nanoparticle array (particle ⌀ = 120 nm, h = 20 nm). (b) Extinction spectra obtained from the array at different temperatures (i.e., 100–300 K, 50 K steps). Note that an increase in temperature shifts the LSPR peak to a longer wavelength. (c) Continuous change in the LSPR peak spectral position, Δλpeak, as a function of temperature. The dashed line is a linear fit to the experimental data.
As the first example to illustrate our P-TPD methodology based on this setup, we studied the thermal desorption of methanol from the nanofabricated Au nanoparticle surfaces. We chose methanol as the adsorbent since molecular mono- or multilayers can be formed depending on the exposure and, accordingly, because methanol has been previously shown to adopt three distinct adsorption phases on Au(111).4 Specifically, for a heating rate of 0.5 K/s, two low-temperature desorption peaks have been reported to correspond to methanol desorbing from a crystalline (∼134 K) and an amorphous structure (∼143 K) formed in methanol multilayers. For low exposure only a single desorption peak was observed, corresponding to complete monolayer desorption at 155 K, which shifts to even higher temperature for decreasing coverage in the submonolayer regime.4
To test this scenario with the P-TPD method, we applied five different methanol exposures to our Au nanoparticle array (2.0 × 10⁴ to 2.4 × 10⁵ L) and applied a heating rate of β = 0.33 K/s. We note that our Langmuir deposition numbers are larger than those typically seen in other works due to the fact that, in our system, deposition is taking place via an adjacent chamber of the UHV system, rather than via direct line-of-sight. When plotting the induced Δλpeak for the different exposures as a function of temperature during the TPD experiment, we notice that the Δλpeak is positively correlated to exposure at 100 K (Figure 2a). This indicates that molecular layers with different thickness are formed, since in the thin film regime the Δλpeak signal is proportional to film thickness,11,19 as we will discuss for the methanol system at hand in more detail further below.
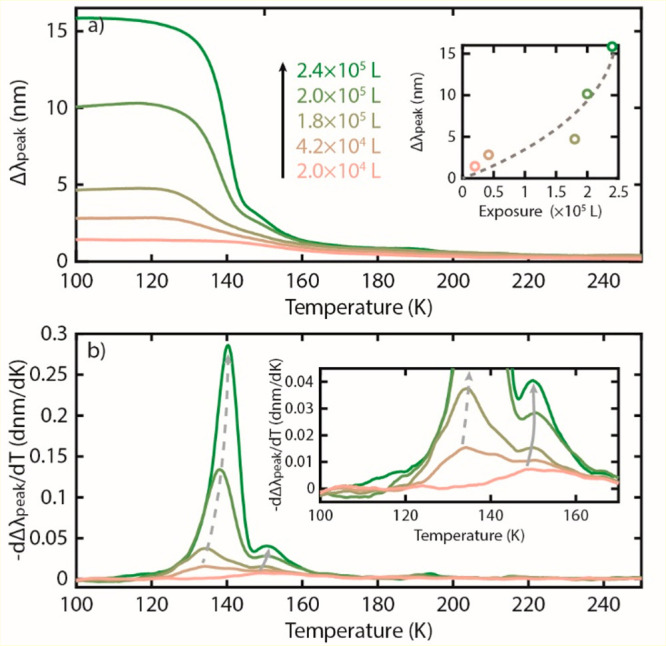
(a) The difference between λpeak of a clean and methanol-covered Au nanodisk array, Δλpeak, for varying initial exposures and thus molecular coverages along a temperature ramp with a linear heating rate of β = 0.33 K/s. The initial increase in the Δλpeak of 2.0 × 10⁵ L is likely due to small drift in the measurement. A positive correlation between Δλpeak at 100 K and initial methanol exposure is observed, indicating the formation of molecular layers with different thickness, as depicted in the inset. Dashed line is a guide to the eye. (b) Negative of the first derivative of the data in (a) showing multiple peaks corresponding to desorption of methanol from amorphous and crystalline parts of the methanol multilayer structure, as discussed in the main text. Inset is a zoomed-in image of (b).
Taking the negative first derivative of Δλpeak reveals a clear dependence of desorption temperatures on initial coverage (Figure 2b). At the lowest initial deposition of 2.0 × 10⁴ L, a small peak centered at ca. 150 K is present. This peak shifts to higher temperature as the initial deposition is increased to 2.4 × 10⁵ L, consistent with first-order desorption with strong intramolecular binding. These characteristics are consistent both with previous results for monolayer methanol desorption4 and with the expected behavior of a molecule capable of hydrogen bonding since this additional intermolecular interaction stabilizes the monolayer. A second desorption peak starts to emerge for 4.2 × 10⁴ L exposure at 130 K and shifts to 140 K for further increased initial coverage. It follows zeroth-order desorption characteristics with an overlapping leading edge for increasing coverage. Hence, this peak indeed corresponds to the desorption observed from the crystalline and amorphous methanol multilayer structures, as reported in the literature.4 Finally, we note that the monolayer (i.e., the higher temperature) peaks appear broader than those of ref (4), which we tentatively attribute to insufficient pumping in our system to completely clear out the desorbing molecules.
To test the P-TPD method on a second and more challenging system, we study benzene for which previous work has examined desorption from Au(111) with a heating rate of β = 1 K/s, and we found three distinct configurations.5Here, we used benzene exposures ranging from 1.5 × 10² to 1.8 × 10⁴ L at a similar heating rate of β = 1 K/s. The corresponding P-TPD traces are shown in Figure 3a. In analogy to the methanol case, we immediately again notice the wide range of absolute Δλpeak at 100 K for the different initial exposures, corroborating the formation of benzene multilayers with different thickness. Taking the negative first temperature derivative for the two highest exposure traces, 6.0 × 10³ L and 1.8 × 10⁴ L, reveals a peak at ∼140 K, which increases in intensity and shifts to higher temperature for increasing coverage (Figure 3b), in agreement with previous MS-TPD data from Au(111) for benzene multilayer desorption.5 Specifically, the shape of these peaks indicates zeroth-order desorption in view of the observed leading edge overlay and the sharply declining higher edge.
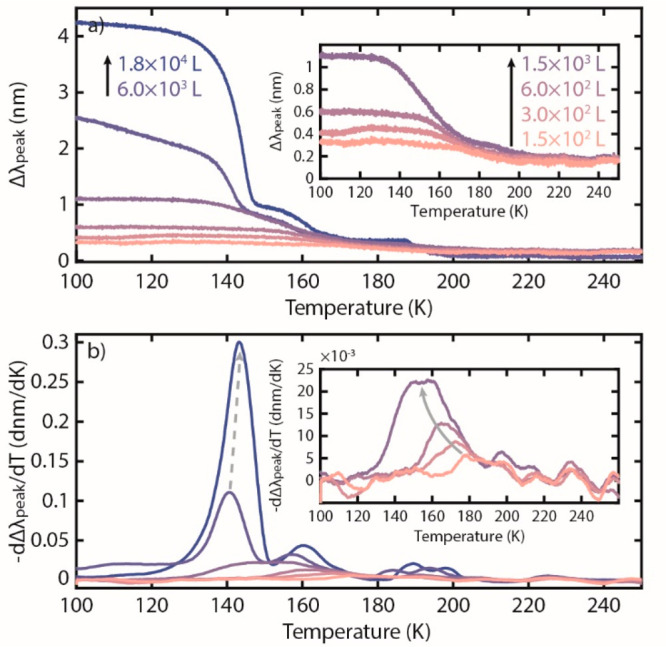
(a) The difference between λpeak of clean and benzene-covered Au nanoparticles, Δλpeak, with varying initial exposures measured for a temperature ramp with a heating rate of β = 1 K/s. A positive correlation between Δλpeak at 100 K and initial benzene exposure is observed, indicating the formation of molecular multilayers with different initial thickness. The initial decrease in the Δλpeak of 6.0 × 10³ L is likely due to small drift in the measurement. (b) Negative of the first derivative of the data in (a). Insets are zoomed-in versions of a certain area in the respective panels.
Now focusing on the low coverage regime (1.5 × 10² to 1.5 × 10³L), we observe desorption peaks that display the characteristics of a monolayer with repulsive interactions between molecules (Figure 3b). Specifically, they are symmetrical with the peak position shifting to lower temperature with increasing coverage. At the lowest coverage the monolayer desorption peak is centered at ∼175 K, and as the coverage increases, it shifts to ∼155 K. This is in good agreement with a conventional MS-TPD study,5 where at the lowest initial coverage examined (lower exposure than the 1.5 × 10² L we used here), the monolayer peak centers on 219 K and is shifted to ∼160 K at the completion of the monolayer.
To attempt a direct translation of the optical signal, Δλpeak, into molecular surface coverage, θ, in the submonolayer regime, we select the corresponding P-TPD data for benzene desorption in the range where no multilayer desorption peaks are present and match the peak desorption temperature for the complete monolayer with the literature value.5 This procedure enables us to assign the exposure of 1.5 × 10³ L benzene to the coverage of one complete monolayer. Accordingly, the integrated area under the desorption peak for this exposure can then be related to the peak area of desorption peaks measured at lower exposures to obtain the fractional monolayer coverage of each deposition. Specifically, we take the initial Δλpeak induced by benzene adsorption at 110 K (i.e., just below the desorption threshold temperature, cf. Figure 3d) and scale it with the area under the corresponding desorption peak for each exposure. In this way, we can directly translate the measured Δλpeak values into molecular surface coverage expressed as a fraction of a monolayer. For the benzene system at hand, this analysis shows a linear dependence between Δλpeak and the correspondingly obtained coverage (Figure 4), in good agreement with the plasmonic biosensing literature for submonolayer adsorption/binding of biomolecular systems.7,11 Furthermore, this analysis corroborates the ultrahigh sensitivity of the P-TPD method introduced here, which is able to detect fractions of monolayers, thanks to its spectral resolution of 0.01 nm for Δλpeak (Figure S1).20
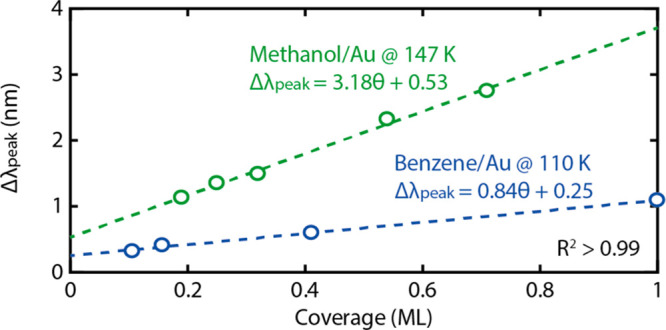
The Δλpeak of the Au nanodisk arrays as a function of methanol and benzene molecular coverage in the submonolayer regime. The proportionality observed demonstrates the possibility to deduce the molecular layer thickness with submonolayer sensitivity. The data are inferred from the results shown in Figures 2 and 3.
Attempting a similar analysis for the methanol system is slightly more complicated since the overlap of the multilayer and monolayer peaks in the P-TPD spectra adds additional complexity to the analysis. Nevertheless, we can select a target temperature where desorption from the multilayer is observed to be complete, in this case at 147 K. At this temperature it is then reasonable to assume that all Δλpeak observed is solely due to molecular coverage of a monolayer. Hence, the fraction of monolayer methanol coverage on the surface at 147 K for lower exposures can be determined by normalizing the remaining integrated area under the corresponding Δλpeak curve to the trace defined to have one monolayer coverage. Applying this procedure, we find similar linear dependence of Δλpeak on methanol coverage in the submonolayer regime but with a higher slope compared to the benzene case. The different slopes observed for methanol and benzene can be speculatively explained as the consequence of benzene being a planar molecule physisorbed flatly on the surface,21 whereas methanol is more symmetric. Therefore, from an electrodynamics perspective, a dielectric layer formed by benzene will be thinner compared to methanol and therefore will give rise to a smaller Δλpeak per molecule. (21)
As a final comment, we tentatively attribute the observed nonzero value of the Δλpeak when extrapolating to zero coverage to different surface structures at different coverage. For example, methanol adopts a planar hexamer configuration in the very low coverage regime, whereas a long-range chain configuration is formed at higher coverage.22 In the context of an interface refractive index (IRI) as recently introduced by Zhan et al.,23 this means that the IRI for the two configurations will be different. Consequently, at the transition between these two configurations the scaling between Δλpeak and coverage will be different and nonlinear. Therefore, linear extrapolation of Δλpeak for zero coverage from the high coverage regime as we do here is likely to yield a nonzero Δλpeak.
Last, we demonstrate an additional trait of the P-TPD method that enables experiments not accessible with traditional MS-TPD, namely to simultaneously measure and deconvolute desorption from two different nanoparticle types made from different metals. Specifically, we apply the same concept as recently demonstrated for multispectral nanoplasmonic sensing,24 in that plasmonic nanoparticles with spectrally separated resonances can be simultaneously and individually addressed spectroscopically. Here, we used a sample with an array of Ag and Au nanoparticles, nanofabricated separately, on either side of a sapphire substrate (Figure 5a). Hence, the two particle types are spatially widely separated to avoid any chemical “cross-talk” but can still be probed simultaneously from an optical extinction measurement. In this experiment, the Au nanoparticles have an average diameter of 60 nm and the Ag nanoparticles of 195 nm (Figure S2). The particle thickness of 20 nm was identical for both systems. This results in an optical extinction spectrum with a short-wavelength peak attributed to the Au nanoparticles and a long-wavelength peak attributed to the larger Ag nanoparticles (Figure 5b), since increasing the diameter of plasmonic nanodisks spectrally red-shifts their plasmon resonance wavelength.25
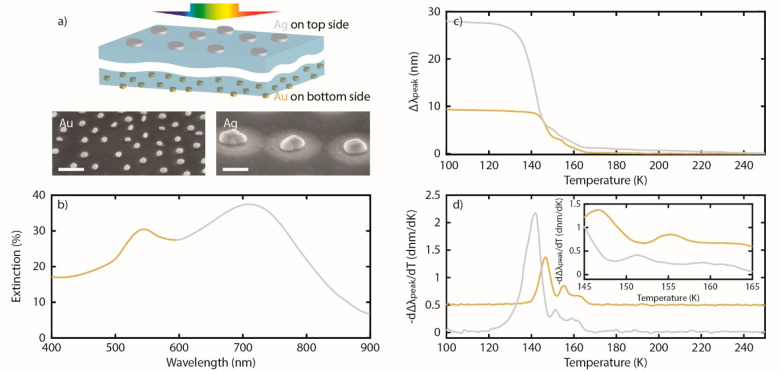
(a) Top: Schematic of the sample with two chemically different nanoparticle arrays (Au and Ag with different diameters) on the either side of a sapphire substrate. Bottom: SEM images of the corresponding Au and Ag nanoparticles in each array obtained at the same magnification to highlight the size difference. Scale bars are 200 nm. (b) Extinction spectrum of the sample, exhibiting two distinct peaks that correspond to the Au (small particles–short wavelengths) and Ag (large particles–long wavelengths) nanoparticle arrays, respectively. (c) The difference between λpeak of the clean and methanol-covered Au and Ag surfaces during a temperature ramp at a heating rate of β = 0.17 K/s. (d) Negative of the first derivative of the data in (c). It is clear that the two metals exhibit distinct desorption profiles. Note that the desorption profile of Au is shifted upward for clarity. Inset is a zoomed-in view of (d).
To demonstrate the principle, we exposed this sample to 4 × 10⁵ L of methanol at 100 K and applied a linear heating ramp of 0.17 K/s while tracking the position of the two plasmonic peaks in the extinction spectrum (Figure 5c). We chose methanol because it is nonreactive on both metals under the conditions of the experiment.26,27 As the data show, the initial absolute Δλpeak upon methanol exposure at 100 K is different for the Ag and Au nanoparticles. This is due to the higher sensitivity of the Ag nanodisks because of (i) their larger field enhancement and (ii) their spectrally more red-shifted resonance.28,29 Furthermore, and most importantly, taking the negative derivative of Δλpeak with respect to temperature, dΔλpeak/dT reveals distinctly different desorption peaks along the temperature axis for the two metal nanoparticle types measured simultaneously (Figure 5d). At the same time, qualitatively, both metals exhibit similar features, i.e., a lower temperature peak corresponding to multilayer desorption at 125–145 K for Ag and at 140–145 K for Au. Furthermore, for both systems a smaller peak is observed at higher temperature, which can be assigned to desorption from the bilayer, e.g., at 155 K for Au in agreement with the literature4 and at 152 K for Ag.26 Finally, a broad peak centered at 160 K for Ag and 162 K for Au is attributed to desorption from the monolayer on each surface, as reported from previous work assigning desorption from the monolayer of MeOH on Ag(111) in the range of 163–167 K.30
This experiment demonstrates the capability of the P-TPD method to directly discern multilayer and monolayer molecular desorption events from two different types of nanoparticles in the same experiment to uniquely enable direct comparison. This is a significant advance compared to traditional MS-TPD since in such experiments the desorption trace data from complex multiparticle samples need to be deconvoluted into their constitute parts. Specifically, any peaks in traditional MS-TPD data need to be assigned to desorption from the different surfaces, with additional care taken when such peaks overlap.
In conclusion, the P-TPD method demonstrated uses the plasmonic peak shift response from arrays of metal nanoparticles to directly measure the coverage of adsorbed molecular species with submonolayer resolution during temperature ramps at UHV conditions. Specifically, to validate the approach, we examined the desorption of methanol and benzene from an array of nanofabricated Au nanoparticles. We found excellent agreement with the literature using traditional MS-TPD for both systems in resolving both the coverage-dependent mono- and multilayer desorption peaks and the specific different monolayer desorption features of the respective system. Furthermore, we identified a linear dependence of the P-TPD response with coverage in the submonolayer coverage regime, indicating a detection limit of only fractions of a monolayer. Finally, we demonstrated the capability of P-TPD to simultaneously track and analyze desorption from nanoparticles with different chemical composition on the example of Ag and Au, an experiment not possible with traditional MS-TPD.
Looking forward, we highlight that P-TPD will also enable studies of other metals and alloys besides Au and Ag considered here, since all metallic elements exhibit LSPR, as explicitly demonstrated for systems like Pt,31 Pd,31 Cu,32 Ni,33 Al,34,35 Sn,36 Mg,37 and/or AuPd and CuPd alloys.38 If nonplasmonic surfaces are of interest, the so-called indirect nanoplasmonic sensing concept may be applied.39 It places an inert/encapsulated plasmonic antenna close to the system of interest, which it then probes via the enhanced plasmonic near field. This approach also efficiently enables studies of very small nanoparticles down to the (sub) 10 nm size range.40,41
As key limitations of the P-TPD method, it may require rather complex sample preparation if nanofabrication methods are used (however, simple drop-casting of colloidal nanoparticles may also be considered), and the measured optical signal Δλpeaka priori neither provides absolute surface coverage information without prior calibration for a specific molecular system nor chemical information in the sense that different species present on the surface could be discriminated. Therefore, we postulate that its combination with traditional MS-TPD may provide interesting applications beyond their independent operation. For example, as illustrated by preliminary data presented in Figure S4, the P-TPD method is able to discern readsorption of molecules on the sample surface by molecules desorbing from, for example, the sample holder or the chamber walls during the TPD temperature ramp. Such effects are not distinguishable in traditional MS-TPD due to the indirect nature of the measurement, whereas P-TPD can resolve them due to it directly measuring surface coverage. In this way, the combination of the two methods has the potential to resolve this long-standing limitation of temperature-programmed desorption and temperature-programmed reaction experiments.
The Supporting Information is available free of charge at https://pubs.acs.org/doi/10.1021/acs.nanolett.0c03733.
Methods, experimental Δλpeak noise, particle size distribution of a double-sided sample, schematics of the UHV chamber, and detection of molecular readsorption events using P-TPD (PDF)
The manuscript was written through contributions of all authors. All authors have given approval to the final version of the manuscript.
The authors declare no competing financial interest.
This research has received funding from the European Research Council (ERC) under the European Union’s Horizon 2020 research and innovation programme (678941/SINCAT) and from the Knut and Alice Wallenberg Foundation project 2015.0055. Part of this work was carried out at the MC2 cleanroom facility and at the Chalmers Materials Analysis Laboratory.
 Plasmonic Temperature-Programmed Desorption
 Facebook
 Twitter
 Linkedin
 Whatsapp
