
The control of domain walls is central to nearly all magnetic technologies, particularly for information storage and spintronics. Creative attempts to increase storage density need to overcome volatility due to thermal fluctuations of nanoscopic domains and heating limitations. Topological defects, such as solitons, skyrmions, and merons, may be much less susceptible to fluctuations, owing to topological constraints, while also being controllable with low current densities. Here, we present the first evidence for soliton/soliton and soliton/antisoliton domain walls in the hexagonal chiral magnet Mn1/3NbS2 that respond asymmetrically to magnetic fields and exhibit pair-annihilation. This is important because it suggests the possibility of controlling the occurrence of soliton pairs and the use of small fields or small currents to control nanoscopic magnetic domains. Specifically, our data suggest that either soliton/soliton or soliton/antisoliton pairs can be stabilized by tuning the balance between intrinsic exchange interactions and long-range magnetostatics in restricted geometries.
A dramatic increase in investigations of magnetism in materials having a chiral crystal structure followed the discovery of regular arrays of skyrmions, whirls of the local magnetization all with the same chirality (handedness) arranged in a lattice, in MnSi.1−7 These suggested a new route toward overcoming domain wall volatility, the random switching of small magnetic domains due to thermal fluctuations,8−15 which may be enhanced in low-dimensional structures with magnetic anisotropy and where the interplay of topology and thermal nucleation has long been realized.16 Further exploration of MnSi made clear that the underlying crystal symmetry plays a dominant role in determining the magnetic states that emerge in this and similar cubic crystals with the B20 symmetry.1,3,7 The small crystalline anisotropy and cubic symmetry of the B20’s are essential to the formation of helical domains in the ground state, as well as the conical and skyrmion lattice states that appear with small rotational-symmetry-breaking magnetic fields. In contrast, the reduced symmetry and related crystalline anisotropy found in hexagonal chiral magnets result in a very different set of magnetic states.7,17 Here, the helical pitch in the magnetically ordered state is confined to the crystallographic c-axis even when exposed to a magnetic field, H. Thus, for H lying perpendicular to the c-axis, skyrmion lattices are not found. Instead, experiments indicate a distorted helical structure allowing the possibility of the formation of chiral magnetic soliton domain walls (DW).4,18,19 How this picture changes with variations in the physical parameters that control the size and character of DW has yet to be fully explored.20
One route toward producing hexagonal chiral magnets has been to intercalate transition metal elements between the hexagonal layers of van der Waals compounds.4,12−23 Here, we intercalate the 3d transition metal Mn into NbS2 (Figure 1a), forming a magnet with a crystal structure that lacks both inversion and mirror symmetries. The magnetic properties are explored through magnetometry, small-angle neutron scattering (SANS), and Fresnel imaging in Lorentz transmission electron microscopy (LTEM). We compare these data with predictions of models and micromagnetic simulations that corroborate the discovery of a linear soliton lattice and the observation of soliton–antisoliton annihilation by an external magnetic field, confirming theoretical predictions.5 Here, a soliton with opposite-handed modulation is referred to as an antisoliton to distinguish from the homochiral case.

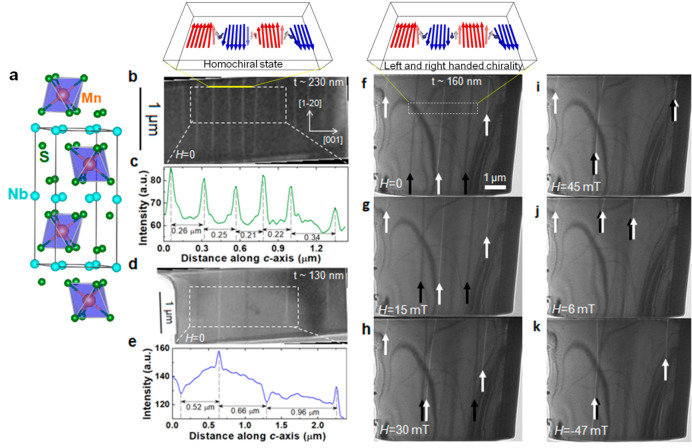
Crystal structure and magnetic microstructure of Mn1/3NbS2. (a) Crystal structure: the intercalated Mn atoms occupy the octahedral interstitial holes (2c site) between trigonal prismatic layers of 2H-NbS2 in the ideal case. (b) Defocused Fresnel images for an ∼230 nm thick region of sample 1 recorded at 12 K. A series of alternating bright lines (domain walls) separated by gray regions that are not strictly periodic are observed. (c) Line profile of the intensity shown in (b) integrated along the (12̅0) direction for the white-boxed region shown in (b). (d) Fresnel image for an ∼130 nm thick region of sample 1 recorded at 12 K. A series of alternating bright and dark lines perpendicular to the c-axis of the crystal are observed that lack a strict periodicity. (e) Line profile of the intensity shown in (d) integrated along the (12̅0) direction for the white-boxed region shown in (b). (f–k) Fresnel images of sample 2 of thickness ∼160 nm in zero and applied magnetic fields (identified in the figure) recorded at 14 K. Arrows indicate the position of alternating bright (white arrows) and dark (black arrows) lines of contrast. Schematics of the magnetic structure at the top of panels (b,f) are suggested by our micromagnetic simulations.
While our previous investigations of Mn1/3NbS2 revealed moments lying along the NbS2 planes forming a nearly ferromagnetic state below Tc = 45 K,21,23 Fresnel defocused24 images taken on thin lamella (Figure 1) display ferromagnetic domains of hundreds of nanometers in size with chiral (Bloch) DW. The DW propagate along the crystallographic c-axis with a rotation in the NbS2 plane (Figure 1b,c). These Fresnel micrographs of Mn1/3NbS2 differ significantly from what was found in isostructural Cr1/3NbS2 where a simple helimagnetic state with equally spaced bright and dark stripes was observed in LTEM for a thin lamella.4 Furthermore, Figure 1b,d,f demonstrates a dramatic change with a reduction of the thickness, t, of the lamella. For the relatively thick specimens, t = 230 nm (Figure 1b,c), a nearly periodic sequence of bright lines interspaced between darker regions at distances of ∼250 nm along the c-axis appeared when images were taken at 12 K. These micrographs change significantly for thinner lamella, t ∼ 130 nm Figure 1d and t ∼ 160 nm Figure 1f, where alternating bright and dark stripes are separated by gray regions of roughly 1 μm along the c-axis. Again, strict periodicity is not observed. For the three samples that we have measured, warming above 25 K causes a loss of contrast, and subsequent cooling results in a similar pattern of stripes, albeit at a different location within the field of view [see Video S1 in Supporting Information (SI)]. This suggests a magnetic origin for the contrast, a conclusion strengthened by the sensitivity of the contrast pattern to small field as demonstrated in Figure 1g–k. Keeping in mind that LTEM is only sensitive to magnetic moments lying in the plane normal to the electron beam (i.e., the lamella plane), the contrast pattern in Figure 1b implies a rotation of the magnetization within the hexagonal ab-plane of the crystal as highlighted by the sharp bright stripes. This image is consistent with a distorted helical magnetic structure where magnetic moments tend to lie in the plane of the lamella modifying this easy-plane system toward an effective easy-axis one. The appearance of alternating dark and bright stripes in the thinner samples (Figure 1d,f) separated by larger regions of slowly varying or nearly constant contrast is substantially different from that seen in the thicker sample (Figure 1b) or in Cr1/3NbS24 requiring a different interpretation.
Perhaps more intriguing is the response of the contrast pattern to small H oriented parallel to the electron beam, Figure 1g–k (and at several other fields in Figures S1–S3)). For fields of one sign (defined positive here), dark stripes are seen to translate rightward and bright stripes leftward until they approach each other above 30 mT forming dark/bright pairs. For larger H (Figure 1i), they begin to annihilate each other with vestiges of the pairs apparent at the edge of the sample so that the contrast persists at the upper edge. The contrast lines that persist merge at a distance of a few hundred nanometers from the edge where the contrast is lost. Significant hysteresis is apparent as H decreases (Figure S1j) until the direction switches (negative H), causing the reappearance of alternating dark and bright stripes. These stripes move in an opposite direction as the H is increased in the negative sense, forming tight bright/dark pairs (Figure S1k and Figure S2). This unusual asymmetry in the motion of chiral DW is not yet understood. However, it is likely a consequence of the Dzyaloshinskii–Moriya interaction (DMI) on DW and interactions between them similar to that observed in ferromagnetic films with perpendicular magnetic anisotropy.25 Alternatively, it may be a consequence of the variation of sample thickness along the lamella.
Insight into these results are made by considering a model where the total energy density contains contributions from the exchange stiffness, A, easy-plane anisotropy K, DMI, D, coupling to the external magnetic field, H, and the dipole–dipole interactions via a local demagnetizing field Hdm

Under these assumptions, for field in the easy plane but normal to the lamellae, the phase ϕ(z) satisfies the double sine-Gordon (dSG) equation, 2Aϕzz – K̃ sin 2ϕ + H cos ϕ = 0. The energy of the solutions is modified by the DMI, which distinguishes this problem from other physical contexts where the dSG appears.26,27 For K̃ = H = 0, we recover the well-known helical state, ϕ(z) = q0z with q0 ∼ D/2A. A much longer pitch of the helix in Mn1/3NbS2 compared to Cr1/3NbS2 (∼250 nm21 versus 48 nm28) indicates a smaller DMI strength and therefore greater role of the dipolar-driven anisotropy. For K̃ ≠ 0, H = 0, the spins prefer to be in the plane of the lamellae, ϕ = 0,π, and these two classical configurations are connected by Bloch DW, which are the solutions of the sine-Gordon equations for the phase ϕ(z). The DMI interaction lowers (raises) the energy of these DW to be depending on the chirality (winding number, ). Therefore, for anisotropies 0 < K̃ ≤ D2/2A the ground state of the system is the lattice of chiral Bloch π-DW. This agrees with the results of simulations presented in Figure 2a,b and likely corresponds to the LTEM data in Figure 1b,c. The origin of this state is similar to that appearing for K̃ = 0 under a finite field, where the energy of 2π solitons (versus π DW) is , so that a chiral soliton lattice is stabilized for H ≤ Hc ∼ D2/2A.29 This lattice has been observed in Cr1/3NbS2.30
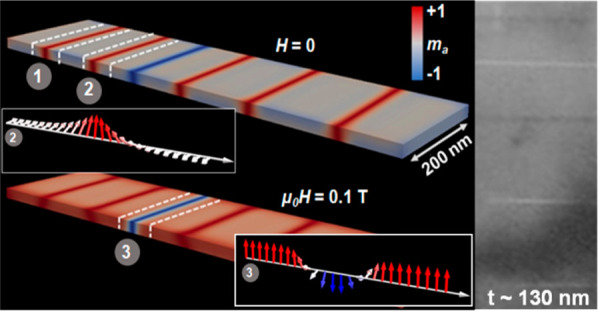
Linear soliton lattice. Snapshots from the micromagnetic simulations showing (a) a contour plot of the a-component of the magnetization at zero external field for a thick sample exhibiting a linear soliton lattice in the form of repeating domain-wall pairs. (b) Schematic demonstrating the generalized parametrization of the magnetization vector for the contour shown in (a). Here, each domain wall in the pair has opposite polarity, but they all have the same handedness, which is determined by the sign of the DMI. (c) Contour plot of the a-component of the magnetization for a thick sample in a field, H = 0.1 T, exhibiting a magnetic soliton lattice state. (d) Schematic highlighting a 2π right-handed chiral domain wall. If the sample is thinner, however, magnetostatic interactions play a dominant role and domain-wall pairs with the same polarity and opposing handedness occur, as shown in (e). (f) With the application of a magnetic field, a thin sample lacks much of the topological protection enjoyed by the thicker sample due to the proximity of chiral domain walls of opposite handedness. Generalized parametrization of the magnetization vector for a (g) right-handed (region 1) and (h) left-handed (region 2) π-domain wall. (i) Schematic demonstration of a pair of homochiral domain wall pairs (region 3).
For higher anisotropy (thinner samples), the DW are either thermally generated or pinned by the boundaries, and the DMI-induced difference in the energies of DW of different winding is small compared to the domain-wall energy. Then, the field at the lateral edges of the lamella is essential, and the description of dipolar interactions as leading to an effective uniaxial anisotropy is insufficient. In simulations, at H = 0 we find wide regions of spins tilted slightly away from the plane, separated by the DW with spins normal to the lamella in the opposite direction, see Figure 2e,g,h. The total winding number is determined by the boundary conditions, and for topologically trivial boundaries DW appear mostly in pairs adding up to w = 0. A sequence of red stripes (magnetic moments pointing up at each of the DW) in Figure 2e indicates switching chirality between sequential domains, see Figure 2g,h, an absence of net winding, and hence nontopological nature of the magnetic order. This should be contrasted with the quasiperiodic red/blue pattern in Figure 2a characteristic of the chiral state.
When the field H < Hc = 2K̃ is applied normal to the lamellae, the DW-like kinks connect classical spin configurations tilted from the plane by the angle ϕ0 = sin–1H/2K̃. Small (large) kinks have phase varying in the regions (ϕ0, π – ϕ0) and (−π – ϕ0, ϕ0) respectively.31 Similar phenomena (without DMI) have been predicted and analyzed in the B-phase of 3He.32,33 Above the critical field, spins are polarized, small kinks vanish, and the energy of the large kinks continuously transforms into that of the 2π soliton known from K̃ = 0. This is confirmed by the simulations for a thick sample, Figure 2c,d, (as well as Video S2) showing the chiral pattern similar to that observed in ref (4).
Small kinks have spins nearly aligned with the field, hence they have lower energy and higher density at moderate fields, as is clear from simulations (Figure 2f:): the light red regions (moments tilted toward the field) are mostly separated by bright red regions (moments along the field). Importantly, because the dSG equation is not exactly integrable, these kinks interact as they are not exact eigenstates of the system at any field.31,34,35 Studies in the absence of the DMI demonstrated trapping of kink–antikink pairs into long-lived quasi-bound states34,35 equivalent to nontopological magnetic bions.36 Experimental observation of pairs of bright and dark lines in LTEM patterns under a magnetic field, Figure 1h,k, suggests that the DMI interaction may help stabilize these pairs. Vanishing of the signal at higher fields, once the lines approach each other, indicates that these are objects with opposite winding numbers, so that the global state is nontopological. We note that the general features of the structure and the field-dependence of the observed states are reminiscent of those predicted for thin ferromagnetic films in ref (37), but the role of the DM interaction, not accounted for in that analysis, needs to be fully elucidated theoretically.
To place these images and calculations in context and to better establish the magnetic state of the system from which the domain structures imaged in Figure 1 derive, we have measured the magnetic properties of bulk single crystals adding more understanding to previous results.21,23,38 These established a magnetic phase transition to a nearly ferromagnetic state below Tc via dc magnetization measurements and neutron diffraction. Our new measurements suggest a phase diagram shown in Figure 3a, where we highlight a distinct change in behavior below ∼25 K (phase I). The response of this system to magnetic fields as observed in the magnetization, M(H), and the ac susceptibility, reveals changes not commonly observed in simple magnets. For example, M(H) with H oriented perpendicular to the c-axis is displayed in Figure 3b where a hysteresis is apparent for T < 25 K only for nonzero H, illustrated in Figure 3a by dotted lines. The maximum temperature where this hysteresis is found, T ∼ 25 K, corresponds with distinct changes in the T- and H-dependent ac susceptibility shown in Figure 3c–f. Most dramatic is the reduction in the imaginary part of the ac susceptibility, χ″, at all H for T < 25 K (Figure 3d,f). Thus, phase I is characterized by the hysteresis in H and the small χ″, corresponding well with the T and H region where lines of contrast were observed in the Fresnel images. The implication is that there is a distinct change in the magnetic domain structure and dynamics at the boundary of phase I with phases II and III since the range of H spanning the purported phase I typically corresponds to mesoscopic-sized features. This conclusion is supported by the variation of the frequency dependence of χ′ and χ″ as displayed in Figure S4.
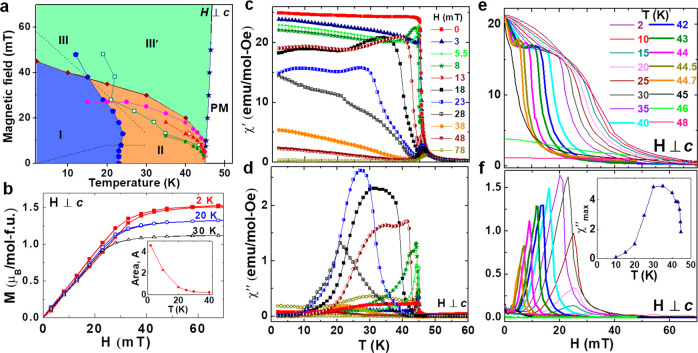
Magnetic properties. (a) Proposed magnetic phase diagram of Mn1/3NbS2 as a function of temperature, T, and magnetic field, H, applied perpendicular to the crystallographic c-axis. Phase I is a helical magnetic phase lacking strict periodicity, phase II is a nearly ferromagnetic phase that is not fully characterized, whereas phases III and III′ are nearly fully polarized magnetic phases, and the region above 45 K (labeled PM) is paramagnetic. The region near the critical temperature, Tc = 45 K, is characterized by a peak in the T dependence of the real part of the ac susceptibility, χ′(T), at finite H (panel c) and Figure S5b (denoted as T1) and plotted in the phase diagram as solid blue stars. At lower T, we observe two distinct maxima in the imaginary part of the ac susceptibility, χ″(T) (panel d and Figure S5d) that are designated in panel a as open red triangles (T2) and open green squares (T3). T2 and T3 are well correlated with features in the H dependence of the real part of χ′ (panel e and Figure S5a), where H1 (solid green squares in (a)) denotes the low field minimum and H2 (solid red triangles in (a)) denotes the maximum at slightly higher H. Solid pink circles indicate H3, the maxima in χ″(H) (panel f) and Figure S5a), which appear to track T2 and H2 at slightly higher H. H3 also tracks the saturation field in the magnetization, M(H), (panel b and designated by purple diamonds in panel a) but at a somewhat smaller H. At lower temperatures, there is a hysteresis observed in M(H) (panel b) with a range indicated by the dotted lines in panel a. The upper temperature limit of the hysteretic region correlates well over a range of the phase diagram with the maximum in the derivative of χ″(T) with respect to T(dχ″/dT) (panel f and the inset to Figure S5c), which is indicted in panel a as solid blue pentagons (T4). Inset to panel f: T dependence of the magnitude of the maximum in χ″(H) shown in (f).
The other regions of the phase diagram are categorized by the response observed in χ′ and χ″ including for T > Tc, where a small χ′ and χ″ are consistent with a paramagnetic state. For temperatures between 24 and 45 K and H < 40 mT (phase II in Figure 3a), the response is characterized by a highly H-dependent χ′ and a large χ″ that is maximum near fields when M(H) approaches saturation. Finally, for H > 40 mT the system is nearly saturated. However, since a peak in χ′ persists at the transition between phase III and the PM state (T1) at H well above the apparent saturation, and χ″ continues to evolve at these higher H, we hesitate to refer to this region as fully field polarized.
Further insight into the magnetic structure was accomplished through small-angle neutron scattering (SANS) measurements (Figure 4). The geometry of the measurement has the crystallographic c-axis nearly horizontal in the plane of the detector, while the neutron beam lies along the ab-plane. For T < Tc, Figure 4a–c, a streak of scattering along the c-axis is apparent and increases in intensity with temperature near scattering vector, Q = 0, particularly for T > 32 K. These data are presented in graphical form in Figure 4e, where the intensity after integration between azimuthal angles, χaz, lying within the white, wedged-shaped regions in Figure 4a–c is plotted as a function of Q and in Figure S7. The variations we observe with cooling are likely related to the evolution of the ac susceptibility that motivated the phase diagram of Figure 3a. This scattering streak signals a disordered magnetic structure consisting of either ferromagnetic domains or a nonsinusoidal helical magnetic structure. Whether the disorder is intrinsic to Mn1/3NbS2, or a result of Mn site defects,21 or the possible presence of stacking faults along the c-axis evident in X-ray diffraction of larger crystals is not yet known. However, a simple disordered ferromagnetic state is not likely since the width of magnetic scattering along the c-axis would resemble that found in the nuclear Bragg scattering. The crystallographic disorder apparent in our previous neutron diffraction measurements21 and our single and powder crystal X-ray characterization is not compatible with the mosaicity required by the SANS data for a disordered ferromagnetic state. In addition, high resolution electron micrographs of our LTEM specimens display minimal disorder, with no indication of stacking faults on the scale of the images, and no indication of an incommensurate order (Figure S6). Instead, the SANS data indicate a nonperiodic stripe phase, a conclusion driven by the Fresnel images which demonstrate a lack of strict periodicity resulting in a set of helical pitch lengths corresponding to the shaded region in Figure 4e. This is supported by recent SANS measurements of isostructural Cr1/3NbS2 where small site disorder results in higher order peaks. We conclude that the Mn site disorder21 contributes significantly to the width of scattering in Figure 4.39
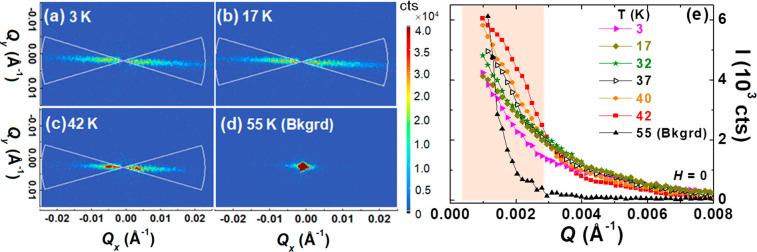
SANS measurement of Mn1/3NbS2 at (a) 3 K, (b) 17 K, and (c) 42 K with the wavevector, Q, parallel to the (001) reflection along the horizontal. The signal at 55 K (panel d) was considered as background and subtracted from the data collected at lower temperatures. Data were obtained with the incident neutron beam perpendicular to the c-axis. (e) Variation of the integrated intensity, I, obtained from the area designated by the white lines in panels a–c versus Q at the indicated temperatures. The shaded region corresponds to the Q-range expected for the periodicities found in the Lorentz TEM studies (see Figure 1).
The importance of the DMI in this system is made clear by the presence of spin textures that are both nonperiodic and thickness dependent. Interestingly, magnetic contrast in Fresnel images only appears at T < 25 K < Tc = 45 K, which corresponds well with changes in the ac susceptibility, M(H), and SANS, suggesting that spin textures are intrinsic to the material, even in bulk crystalline form. The spatial extent of the spin textures in LTEM, confirmed by SANS data, is hundreds of nanometers indicating a small DMI, which is much smaller than was observed in isostructural Cr1/3NbS2 and is in agreement with electronic structure calculations.40 The implication of these observations is that the DMI and the magnetostatic interactions are of similar magnitude so that variations within our samples, such as the sample thickness and crystalline disorder, although thought to be small, create significant variations in the periodicity of the spin textures. For the thin lamella explored through Fresnel images, the shape anisotropy appears to be sufficient to distort the magnetic structure, such that it is no longer helical, as the images suggest that regions where the magnetic moments lie within the plane of the lamella increase significantly for our thinnest samples.
Our experiments, together with theory and simulation, strongly support the idea that the effective sample geometry-induced anisotropy in chiral magnets can switch the magnetic states from topological to trivial, opening up a new avenue for controlling topological properties in these systems. In addition, the heterogeneity in the period of the chiral magnetic state implied by the SANS and LTEM measurements suggests that even minimal imperfections in our crystals strongly affect the local periodicity of the magnetic structure. Investigations of the crystalline structure of our samples, including X-ray and neutron diffraction and high-resolution TEM imaging, do not indicate significant disorder. Far from being a deficiency, the variation we observe instead suggests a method to manipulate the length scales of the magnetic textures and presumably the currents necessary to drive them. Despite the lack of strict periodicity of the magnetic structure, we have demonstrated that the shape anisotropy, which tends to confine magnetic moments in the plane of thin samples, can be used to control the overall chirality of the magnetic state. Thick samples (small influence of the sample surfaces) retain the helicity defined by the DMI and thus the topological protection of any soliton-like features, whereas thin samples do not, thereby removing this protection. The result is a demonstrated ability to influence not only the direction of motion of chiral DW, but more importantly the ability to annihilate DW of opposite chirality with magnetic field, offering unprecedented control topological features and soliton pair dynamics.
The Supporting Information is available free of charge at https://pubs.acs.org/doi/10.1021/acs.nanolett.0c03199.
Single crystal growth technique of Mn1/3NbS2; experimental details of ac susceptibility, SANS measurement, focused ion beam and Lorentz transmission electron microscopy measurements; micromagnetic simulation details; LTEM images at 14 K upon applying an increasing magnetic field up to +45 mT that was sequentially reduced to −47 mT and finally to 0 mT; line profile analysis of LTEM images; temperature dependence of ac magnetic susceptibility at various frequencies; ac magnetic susceptibility and further discussion of the phase diagram; high-resolution HAADF STEM images of Mn1/3NbS2; wavevector and temperature dependence of the SANS data (PDF)
Video displaying temperature-dependent Lorentz TEM data at zero magnetic field (MOV)
Video demonstrating the results of a micromagnetics simulation with the application of a transverse magnetic field (MOV)
◆ (M.M.) Department of Chemistry and Chemical Biology, Rutgers University, Piscataway, NJ 08854.
S.K.K., M.C., D.P.Y., and J.F.D. conceived and designed the experiments. S.K.K. synthesized crystals under the direction of D.P.Y. and performed the magnetization and ac magnetic susceptibility measurements. M.M. and W.X. performed the single crystal X-ray diffraction experiment. S.K.K., J.F.D., and L.D.-S. performed the small-angle neutron scattering measurements, A.K. and M.C. performed the Lorentz transmission electron microscopy (LTEM) measurements. The data analysis of LTEM was performed by S.K.K. with the supervision of J.F.D., M.C., and A.K. M.C. performed the micromagnetic calculations. I.V. and W.A. performed the analytic calculations. All authors participated in the writing of the manuscript.
The authors declare no competing financial interest.
The experimental material presented here is supported by the U.S. Department of Energy under EPSCoR Grant DE-SC0012432 with additional support from the Louisiana Board of Regents. A.K. acknowledges support for the Fresnel imaging in LTEM from the EU’s ERC Horizon 2020 program under Grant Agreement 856538 and from DFG project-ID 405553726–TRR 270. The SANS measurements at ORNL’s HFIR was sponsored by the Scientific User Facilities Division, Office of Science, Basic Energy Sciences (BES), U.S. Department of Energy (DOE). I.V. acknowledges support from NSF Grant DMR 1410741 for theoretical work and hospitality of the KITP, where part of this research was performed under NSF Grant PHY-1748958. We would like to thank Dr. Ron Kelley from ThermoFisher Scientific for providing access and assistance with their PFIB for sample preparation and TEM imaging. We thank Dr. Dongmei Cao of the Shared Instrument Facilities at Louisiana State University for assistance with sample preparation for the LTEM imaging.
 Annihilation and Control of Chiral Domain Walls with
Magnetic Fields
Annihilation and Control of Chiral Domain Walls with
Magnetic Fields
 Facebook
 Twitter
 Linkedin
 Whatsapp
