 Ultrabright Fluorescence Readout of an Inkjet-Printed
Immunoassay Using Plasmonic Nanogap Cavities
Ultrabright Fluorescence Readout of an Inkjet-Printed
Immunoassay Using Plasmonic Nanogap Cavities
Nano Letters


- Altmetric
Fluorescence-based microarrays are promising diagnostic tools due to their high throughput, small sample volume requirements, and multiplexing capabilities. However, their low fluorescence output has limited their implementation for in vitro diagnostics applications in point-of-care (POC) settings. Here, by integration of a sandwich immunoassay microarray within a plasmonic nanogap cavity, we demonstrate strongly enhanced fluorescence which is critical for readout by inexpensive POC detectors. The immunoassay consists of inkjet-printed antibodies on a polymer brush which is grown on a gold film. Colloidally synthesized silver nanocubes are placed on top and interact with the underlying gold film creating high local electromagnetic field enhancements. By varying the thickness of the brush from 5 to 20 nm, up to a 151-fold increase in fluorescence and 14-fold improvement in the limit-of-detection is observed for the cardiac biomarker B-type natriuretic peptide (BNP) compared to the unenhanced assay, paving the way for a new generation of POC clinical diagnostics.
Extensive efforts have been made to translate fluorescence optical sensing toward clinical and point-of-care tests (POCTs).1,2 Fluorescent protein microarrays represent a promising platform due to low fabrication cost, straightforward multiplexing, and the need for low sample volumes.3,4 Significant progress has been made in the fabrication of microarrays, by optimization of their performance through immobilization strategies,5,6 miniaturization,7 and automation.8 The need for multiple washing and incubation steps, which is incompatible with POCT, has recently been overcome with a single-step technology (the “D4 assay”) where the capture and fluorescently labeled detection antibodies are inkjet-printed on a stealth protein and cell resistant polymer brush, namely, poly(oligo(ethylene glycol) methyl ether methacrylate) (POEGMA) that is grafted from the surface of glass via surface-initiated atom transfer radical polymerization (SI-ATRP). Incubation of this chip with a drop of biological fluid results in the appearance of discrete fluorescent spots, the intensity of which correlates with analyte concentration. The standard D4 assay has been well-characterized in the literature and was previously tested against the clinical gold standard test, ELISA, where it was shown that leptin levels measured by the D4 strongly correlated with those measured by ELISA in a pilot clinical study.9 However, the readout of the assay is still severely limited by the fluorescence signal and typically requires the use of highly sensitive detectors. Plasmonics provides a possible solution to this challenge, as plasmonic nanostructures can concentrate light into small volumes and yield high field enhancements or “hot spots” that can enhance the efficiency of optical excitation and emission processes of emitters.10−13 Although plasmonic platforms have shown enhancements sufficient to detect single molecules,14 and plasmonic metasurfaces have been used for phase interrogation,15,16 their utilization as POCTs is limited as they often are not scalable and need intricate fabrication and functionalization steps.17,18 For example, a rough gold film has shown fluorescence enhancements up to 100-fold for the detection of different biomarkers18−21 and in a multiplex format;22 additionally, a plasmonic “stamp” has been added onto a variety of substrates which has produced comparable enhancements.23 However, common to both cases, optimization of antibody immobilization and extra washing and blocking steps make them incompatible with POCTs, and their architecture provides limited room for further optimization of the fluorescence enhancement.
Here, we integrate a protein microarray assay with plasmonic metal–dielectric–metal cavities to uniformly enhance the fluorescence from the assay by over 100-fold while maintaining the sigmoidal performance of the test. The nanogap cavities consist of colloidally synthesized silver nanocubes (∼100 nm) separated from a metal film by a thin (3–25 nm) dielectric spacer layer24−27 and can be created over large areas using simple particle deposition.28,29 The plasmonically enhanced D4 (PED4) assay is demonstrated here for the quantification of B-type natriuretic peptide (BNP), which is an important biomarker for the prognosis and long-term monitoring of cardiac disease. BNP has multiple clinically relevant cutoff values for diagnosis of heart failure, where values <100 pg/mL indicate that heart failure is improbable; 100–400 pg/mL is considered a “gray zone” where the patient requires further testing, and values >500 pg/mL indicate that heart failure is very probable.30−32
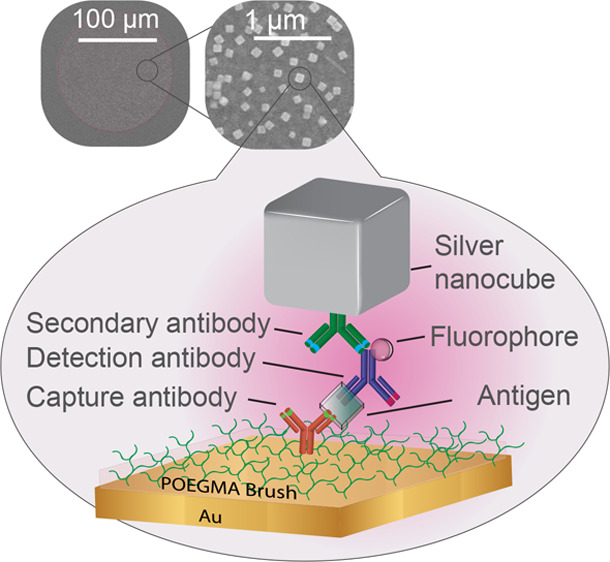
To enable optimized and uniform fluorescence enhancement, the D4 assay is integrated in the gap region between the silver nanocubes and the gold film, where local electromagnetic field enhancements of ∼100-fold are created as seen in Figure 1a. This enhanced local electromagnetic field, in turn, increases both the excitation efficiency of emitters in the gap region as well as the collection efficiency of the emitted light due to a modified radiation pattern.25 The expected enhancement depends strongly upon the gap size between the gold film and nanocubes,24 and thus, the thickness of the POEGMA brush is varied in this study between 5 and 20 nm. Figure 1b shows the fabrication steps of the PED4 assay, where a gold film is first deposited on glass, followed by growth of a POEGMA brush by SI-ATRP.33−35 Two types of microspots are then inkjet-printed on the polymer brush: “stable” spots of capture antibodies (cAbs) surrounded by “soluble” spots of fluorescently labeled detection antibodies (dAbs–Alexa 647) mixed with an excipient (typically trehalose) that helps dissolve the dAbs upon contact with biological fluid, such as serum, plasma, or blood. In the D4 assay (Figure 1c), a small volume (∼80 μL) of liquid, containing the clinically relevant cardiac biomarker BNP, is (i) dispensed on the chip, which (ii) dissolves the soluble spots of fluorescently labeled dAb. This is followed by their (iii) diffusion and binding to the analyte-bound cAb spots, which generates a (iv) detection signal of fluorescent spots that are imaged by a table-top fluorescence scanner. Finally for the PED4 assay, silver nanocubes are adhered to the surface through a poly(allylamine hydrochloride) (PAH) interfacial layer or by incubating silver nanocubes conjugated to a secondary Ab (S.A.), methods that will be discussed in detail later. Figure 1d shows representative fluorescence images of the capture spots (i) before and (ii) after adding the silver nanocubes to the gold surface for a 10 nm POEGMA brush. A 216-fold fluorescence enhancement is obtained from comparison of the “precubes” and “postcubes” on gold at a BNP concentration of 1.9 ng/mL, as can be seen by the increase in intensity of the capture spots. A 151-fold enhancement is observed when compared to a glass control at the same analyte concentration (Figure S1).

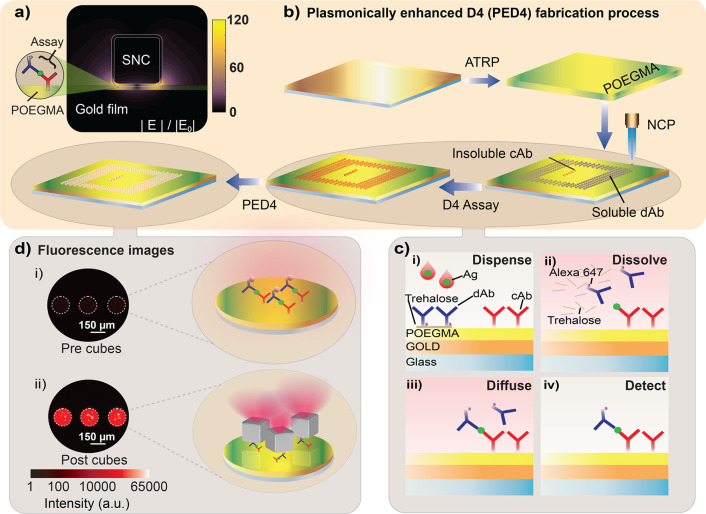
Design and fabrication of the plasmonically enhanced D4 (PED4) assay. (a) Schematic of plasmonic nanoantenna with the assay integrated between the gold film and silver nanocube (SNC). Color indicates electric field enhancement as obtained from COMSOL simulations. (b) PED4 fabrication starts by evaporating gold on a glass slide, followed by poly(oligo(ethylene glycol) methyl ether methacrylate) (POEGMA) growth by surface-initiated atom transfer radical polymerization (SI-ATRP). “Stable” capture antibodies (cAb) and “soluble” detection reagents are spotted onto the surface by noncontact inkjet printing (NCP). (c) In the D4 assay, a drop of sample is (i) dispensed on the chip, which (ii) dissolves the “soluble” dAb, followed by their (iii) diffusion and binding to the analyte-bound cAb spots, generating a (iv) detectable fluorescence signal. (d) Finally, silver nanocubes are attached to the surface resulting in 216-fold fluorescence enhancement of the capture spots for a 1.9 ng/mL B-type natriuretic peptide (BNP) concentration and a 151-fold increase when compared to a glass control at the same concentration.
To investigate the fluorescence enhancement of the assay provided by the plasmonic nanogap cavity, first PAH was used to electrostatically adhere the silver nanocubes on the surface (Figure 2a). The plasmonic nanogap cavity can be fabricated over a large area through the homogeneous deposition of silver nanocubes on the capture spot as seen in the photograph in Figure 2b, the dark field image in Figure 2c, and the scanning electron microscopy (SEM) image in Figure 2d (Figure S2 shows an SEM image of the entire spot). Figure 2e shows the reflection spectrum of the large-area plasmonic surface with strong light absorption centered at the 671 nm plasmon resonance.
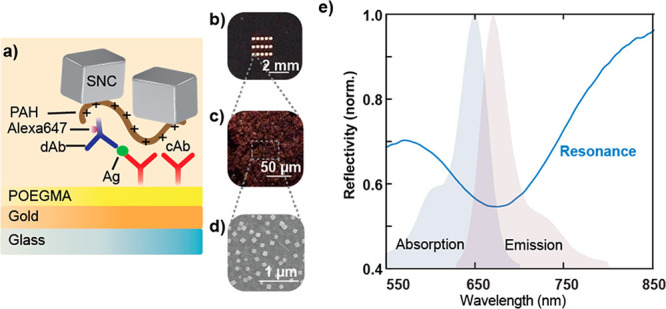
Resonant behavior of the PED4 structure. (a) Silver nanocubes (SNCs) are adhered to the assay using an interfacial poly(allylamine hydrochloride) (PAH) layer. (b) A photograph of capture spots shows that silver nanocubes attach specifically to printed spots. (c) Dark-field and (d) SEM images show the uniformity of the nanostructures. (e) Strong light absorption of the large-area plasmonic surface centered at the resonance wavelength of 671 nm (for a 20 nm POEGMA brush) is observed in the reflectivity spectrum and is overlaid with the absorption and emission of the Alexa647 fluorophore. Three replicates were taken for each spectra, and representative spectra are shown.
Next, we systematically probed the role of the POEGMA thickness on the assay performance for BNP, as this thickness varies the critical distance between the silver nanocubes and the gold film of the nanogap cavities. Because POEGMA is grown in situ from the gold or glass surface by SI-ATRP, the ATRP provides highly controlled growth kinetics of the polymer for thicknesses between 5 and 100 nm (see Figure S3 for POEGMA growth on gold). For the control, an assay performed on a 70 nm POEGMA brush on glass was utilized since the D4 assay is typically performed on a thick (50–100 nm) POEGMA brush, which provides optimal assay performance due to better antibody immobilization and resistance to nonspecific binding.9,36,37 A 20 nm POEGMA brush on glass was also measured as shown in Figure S4 and Table S1, which would provide fluorescence enhancements up to 228-fold if used as the control. To generate dose–response curves, cAbs and dAbs were printed in an array format as seen in Figure 1b. A total of 18 antibody arrays were printed on a POEGMA-coated glass slide to generate an 18-point dose–response curve by serial dilutions. Each array contained five printed cAb spots as replicates. Antibody printing was followed by addition of BNP-spiked fetal bovine serum (FBS) at BNP concentrations ranging from 3.8 pg/mL to 62.5 ng/mL. The fluorescence intensity for each antigen dilution was obtained from the average intensity of the five replicates (on the same sample), where the intensity from each spot was obtained by averaging the intensity over the entire 160 μm diameter spot. This was done for three separately run assays, and their intensity values were averaged to generate dose–response curves which were later fitted with a 5-parameter logistic regression, a commonly used model for immunoassay dose–response curve analysis.
Before performing detailed measurements of dose–response curves, we studied the effect of the detector photomultiplier (PMT) gain on the fluorescence enhancement and limit of detection (LOD). This was done for an assay on a 70 nm POEGMA brush on glass as well as for the PED4. t It was observed that decreasing the gain reduced the noise in the calibration curve, providing a 14-fold decrease in the LOD when compared to a glass control (Figure S5). This serves as a demonstration of how the PED4 can potentially be used to compensate for loss in sensitivity with low-cost detectors. A gain of 400 was chosen for the following experiments, as it provided the highest fluorescence enhancement without saturation of the detector and a low LOD (Figures S5–S8). Antibody pairs were printed on the gold films with POEGMA thicknesses of 5, 10, 15, and 20 nm and on the 70 nm POEGMA glass control. Before adding the silver nanocubes, POEGMA-coated gold slides were measured to determine their response as seen in the purple curves in Figure 3a. This control is included in the analysis to demonstrate that the addition of only a gold film underneath the POEGMA brush does not lead to any significant difference in the performance of the assay as compared to the glass control. From this, it is observed that the fluorescence intensity for the 5 and 10 nm POEGMA brushes on gold was similar to the D4 assay on glass, while it was slightly higher for the 15 and 20 nm brushes. This is likely due to a small plasmonic fluorescence enhancement from the gold film alone of approximately 2-fold (for a 20 nm brush and a gain of 400) which is less pronounced at very close proximity to the surface due to fluorescence quenching effects. Embedding the assay in the plasmonic nanogap cavities resulted in 2 orders of magnitude fluorescence enhancement (red curves) when compared to both the glass control (black curves) and the samples before silver nanocube deposition. It is also important to note that adding the silver nanocubes to the D4 assay on glass did not appreciably alter the fluorescence intensity (Figure 3b). Therefore, the POEGMA-coated gold slides with no nanocubes and the glass slides with nanocubes serve as negative controls to demonstrate that the fluorescence enhancement is caused by the formation of the nanogap cavities consisting of both the gold film and the silver, and not from the simple addition of a gold film or silver nanoparticles by themselves.
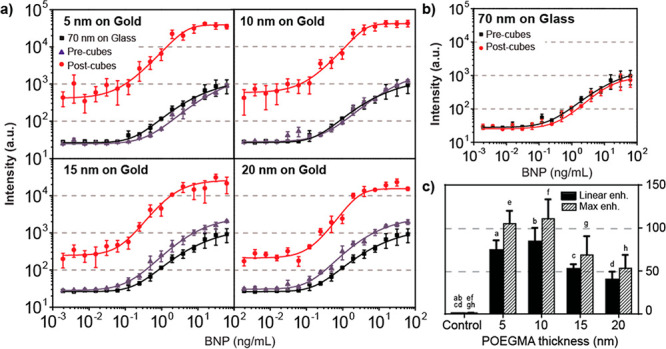
Dependence of the PED4 assay on brush thickness. (a) Evaluation of the plasmonically enhanced assay for 5, 10, 15, and 20 nm POEGMA brushes for a PMT gain of 400. Experimental data are shown for the assay before (purple) and after (red) nanocube deposition as well as for a control on glass with a 70 nm POEGMA brush (black). Solid lines show fits to the data. (b) Additional control experiment where the fluorescence intensity of a 70 nm POEGMA brush on glass is observed to not be enhanced by the addition of silver nanocubes (note small difference is not statically significant). (c) Linear and maximum enhancement summary for the PED4 with different POEGMA thicknesses along with the glass control. Error bars in all panels are based on three independent runs of each experiment. Enhancement was deemed statistically significant when compared to control but not among each other. Bars with the same letter are statistically significant.
The fluorescence enhancements from the dose–response curves were calculated by two separate methods: (1) a linear enhancement extracted from the linear component of the sigmoidal curve in the glass control, and (2) a maximum enhancement extracted from the BNP concentration providing the largest enhancement, both compared to a control consisting of 70 nm POEGMA on glass (Figure 3c). From this, we note larger enhancements for assays with thinner (5 nm) POEGMA brushes, with linear and maximum enhancement levels of 74-fold and 105-fold, respectively. These values are reduced for assays with thicker (20 nm) POEGMA brushes, with linear and maximum enhancement levels of 40-fold and 53-fold, respectively. Larger enhancements for smaller POEGMA thicknesses can be attributed to film-coupled nanocube antennas with smaller mode volumes and, in turn, larger local electromagnetic fields. Although the fluorescence enhancement is greater for smaller POEGMA thicknesses, the intensity variation between slides is larger as seen by the error bars in the dose–response curves, which likely can be attributed to diminished immobilization of the cAb on thinner POEGMA brushes (Figure S9) and increase in nonspecific binding.36,37 This larger variability in thinner brushes affects the performance of the assay and therefore increases the LOD (see Table S3 in the SI).
Next, to move this system closer to a POC format as well as decrease the noise arising from nonspecific binding of silver nanocubes, an alternate particle deposition method was investigated. The interfacial PAH layer was eliminated, and the PED4 chips were instead incubated with 100 nm silver nanocubes conjugated to a secondary Ab that specifically targets the Fc region of the dAb-Alexa 647 conjugate (Figure 4a). A BNP assay in FBS with analyte-spiked serum was performed using this approach on 5, 10, 15, and 20 nm POEGMA-coated gold slides as well as a glass control and measured before and after silver nanocubes were added (Figure 4b and Figure S10). It is observed that the PED4 assay fabricated with the conjugated silver nanocubes (red curve) has a significantly lower noise than the assay fabricated with the interfacial PAH layer, in particular at the low BNP-concentration tail of the dose–response curve. This results in a reduced LOD from 0.16 ng/mL for the glass control to 0.02 ng/mL for the conjugated nanocubes for a 20 nm POEGMA brush embedded in the plasmonic nanogap cavity (Table S4 in the SI). This represents the lowest LOD obtained in the study, which was even measured for a high gain of 500. This shows that the LOD has been reduced due to less nonspecific binding of the silver nanocubes on the assay. This improved LOD is observed while maintaining fluorescence enhancements of over 10-fold in the clinically relevant linear regime of the assay (0.1–0.5 ng/mL)38 and maximum enhancements of ∼19-fold (Figure 4c). In contrast to many traditional assays, here the signal-to-noise ratio can be improved as the nonspecific binding is reduced by the simultaneous use of two techniques. The first is the integration of the nonfouling polymer brush POEGMA to avoid nonspecific binding of proteins on the surface,35−37 and the second is the conjugation of the nanocubes to increase their specificity to the assay and reduce the noise at low BNP values. Furthermore, the use of the nonfouling POEGMA reduces the likelihood of the secondary antibodies in the conjugated nanocubes to attach nonspecifically to the surface.
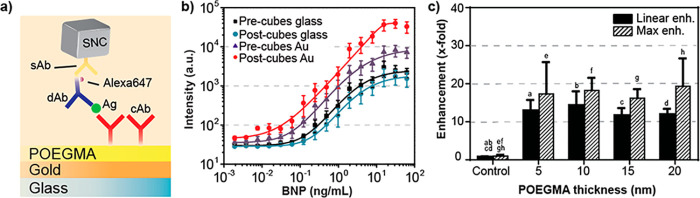
Reduced-step assay with Ab-nanocube functionalization. (a) Schematic of the assay where the silver nanocubes are conjugated with a secondary antibody that targets the Fc region in the dAb. (b) Dose–response curve for 20 nm POEGMA before (purple) and after (red) adding silver nanocubes to the assay on gold as well as control on glass before (black) and after (blue) adding nanocubes (note that a small difference between before and after nanocubes on glass control is not statistically significant). Up to 19-fold fluorescence enhancement is observed as well as an approximately 8-fold improvement in the LOD after adding the silver nanocubes to the assay on gold. (c) Linear and maximum enhancement summary for the PED4 with different POEGMA thicknesses along with the glass control. Error bars in all panels are based on three independent runs of each experiment. Enhancement was deemed statistically significant when compared to control but not among each other. Bars with the same letter are statistically significant.
In conclusion, we have integrated a sandwich immunoassay into a plasmonic nanogap cavity using a bottom-up, scalable, fabrication approach for the detection of the clinically relevant cardiac biomarker BNP. The assay performance was extensively explored as a function of the POEGMA brush thickness as this controls the nanoscale gap between silver nanocubes and the underlying gold film and, in turn, the electromagnetic field enhancement provided by the plasmonic nanogap cavity. Fluorescence enhancements of more than 100-fold were observed for the smallest gaps corresponding to the nanogap cavity with the largest electromagnetic field enhancement. Large fluorescence enhancements were observed with brushes of up to 20 nm, enabling the readout at low PMT gains without sacrificing LOD performance. This illustrates how the lower sensitivity of POC detectors can be compensated for by using this plasmonic platform with the potential to enable the use of other inexpensive or widely available detectors such as cell-phone cameras. To reduce nonspecific binding of the nanocubes to the assay and improve the LOD, silver nanocubes were conjugated directly to the detection antibodies, which reduced intra- and interassay variation and resulted in an LOD of 0.02 ng/mL. This work demonstrates the promise of utilizing plasmonic nanogap cavities for biosensing with the potential for even greater fluorescence enhancements in the future.25 Even though this work focuses on the detection of a single cardiac biomarker, BNP, the PED4 is broadly applicable for the detection of various protein biomarkers for which antibody pairs exist. The difference in protein antigen sizes may cause variability in the dielectric gap thickness, and thus, the role of the immunocomplex size on the performance of the assay may be important for the optimization of the PED4 if used for various analytes. In addition to multiplexing capabilities, this platform may also be extended to other fluorescence-based microarrays to enable a new generation of ultrabright, point-of-care immunoassays and could even be adapted to broader applications where fluorescence enhancement is needed, such as DNA-microarrays.
Methods
SI-ATRP of POEGMA on Au
First, a 5 nm Cr adhesion layer and 75 nm Au were deposited on glass slides by electron beam evaporation (CHA Industries Solution E-beam). Gold evaporated slides were then immerged in an ethanolic solution containing 1.25 mg/mL Bis[2-(2′-bromoisobutyryloxy)ethyl]disulfide initiator and were left stirring overnight. After rinsing in ethanol, slides were immersed in ethanol and sonicated for 40 min, followed by a rinse with ethanol and deionized (DI) water. A polymerization solution of Cu(II)Br (62.5 μg/mL), HMTETA (106 μg/mL), and oligo(ethylene glycol) methyl ether methacrylate (Mn = 300 ,263 mg/mL) was degassed under helium for 3 h. For synthesis of the POEGMA brush, activators regenerated by electron transfer (ARGET)-ATRP was used, where Cu(I) complexes were regenerated from oxidatively stable Cu(II) species by adding l-ascorbic acid reducing agent (1.5 mg/mL) to the polymerization solution in an argon purged glovebox. Slides were then submerged in the polymerization solution for a specified time, depending on the desired thickness (Section S3). The POEGMA thickness was measured using an M-88 spectroscopic ellipsometer (Woollam). All reagents were obtained from Sigma-Aldrich.
SI-ATRP of POEGMA on Glass
Glass slides were first submerged in aminopropyltriethoxy-silane (10%) in ethanol and left stirring overnight. They were then rinsed with ethanol and dried at 120 °C for 2 h. Slides were then immersed in a solution of bromoisobutyryl bromide (1%) and triethylamine (1%) in dichloromethane for 30 min, rinsed with dichloromethane and ethanol, and dried with N2. ARGET-ATRP was then carried out by the same protocol as on the Au substrate.
Spotting of Antibody Microarrays
Capture Ab (monoclonal anti-BNP IgG) was obtained from HyTest, and dAb (polyclonal anti-BNP IgG) was obtained from R&D Systems. The dAbs were directly conjugated to fluorophores by following the antibody suppliers’ instructions (Invitrogen, Alexa Fluor 647 antibody labeling kit). The cAbs were spotted onto POEGMA-coated substrates using a Scienion S11 noncontact printer under ambient conditions at 1 mg/mL concentration. Spots of soluble detection reagents were composed of dAbs (1 mg/mL) mixed with excipient (0.25 mg/mL trehalose) and printed in a similar fashion.
D4 and PED4 Immunoassay
To generate dose–response curves, D4 and PED4 chips were incubated in a dilution series of analyte-spiked calf serum (Clontech) for 90 min. Substrates were then briefly rinsed in 0.1% Tween-20/PBS and then dried. Arrays were imaged on an Axon Genepix 4400 tabletop scanner (Molecular Devices, LLC). Data from three different samples were averaged, and data were fitted to a five-parameter logistic (5-PL) fit curve using OriginPro 9.0 (OriginLab Corp.). The limit-of-blank (LOB) was estimated from the mean fluorescence intensity (μ) and standard deviation (σ) from three blank samples, defined as LOB = μblank + 1.645σblank. LOD was estimated from spiked low-concentration samples (LCSs) above the LOB, such that LOD = LOB + 1.645σLCS.
Nanocube Deposition
Unconjugated and conjugated (antigoat IgG) 100 nm silver nanocubes were obtained from NanoComposix. For the deposition of unconjugated silver nanocubes, D4 chips printed on a gold film were submerged in a suspension of 3 mM poly(allylamine hydrochloride) (PAH) and 1 M NaCl for 5 min after completion of a D4 assay followed by rinsing and drying. A silver nanocube solution (1 mg/mL) was pipetted on top of a large coverslip spacer and placed on top of the D4 chips to ensure uniform thickness of the solution over the whole sample, and the D4 assay slides were placed face down on top of the coverslip. The slides were kept in a refrigerator for 60 min to reduce evaporation, after which they were rinsed with DI water and dried with N2. For the deposition of antibody conjugated silver nanocubes, 15 μL of a silver nanocube colloidal suspension (1 mg/mL) was pipetted on the D4 assay and left to incubate for 1 h. Images to characterize the nanocube deposition were obtained using an FEI XL30 SEM instrument.
Optical Measurements
Reflection spectra were obtained from the capture spots after silver nanocube deposition. White light reflectance measurements at near normal incidence were performed using a custom-built confocal microscope with a 20× objective and detected by a spectrometer with an attached charge coupled device (CCD).
Supporting Information Available
The Supporting Information is available free of charge at https://pubs.acs.org/doi/10.1021/acs.nanolett.0c01051.
Fluorescence comparison on glass control, gold film, and PED4; SEM image of capture antibody spot after SNC deposition; ellipsometer measurements of POEGMA on gold as a function of time; fluorescence enhancement obtained with 20 nm glass control; study of photomultiplier gain and POEGMA thickness on enhancement, LOD, and background noise; antibody immobilization on POEGMA brushes with different thicknesses; enhancement for different thicknesses for conjugated silver nanocubes; and a table summarizing enhancement and LOD for both deposition methods (PDF)
Author Contributions
∥ D.F.C. and C.M.F. contributed equally to this work.
Notes
M.H.M. acknowledges support from the National Institute of Health (NIH) grant 5R01-HL144928-02 and support from a Cottrell Scholar award from the Research Corporation for Science Advancement. A.C. acknowledges funding from the United States Special Operations Command (contract W81XWH-16-C-0219) and the Combat Casualty Care Research Program (JPC-6) (contract W81XWH-17–2–0045). C.M.F. acknowledges support from the National Council for the Improvement of Higher Education—CAPES (the Science without Borders project).
Notes
The authors declare no competing financial interest.
Abbreviations
| POC | point of care |
| POCT | point of care test |
| LOD | limit of detection |
| BNP | B-type natriuretic peptide |
| POEGMA | poly(oligo(ethylene glycol) methyl ether methacrylate |
| SI-ATRP | surface initiated atom transfer radial polymerization reaction |
| PED4 | plasmonically enhanced D4 |
| PAH | poly(allylamine hydrochloride |
| Ab (S.A.) | secondary antibody |
| SNC | silver nanocube |
| FBS | fetal bovine serum |
| PMT | photomultiplier |