 High-Resolution
Photonic Force Microscopy Based on
Sharp Nanofabricated Tips
High-Resolution
Photonic Force Microscopy Based on
Sharp Nanofabricated Tips
Nano Letters


- Altmetric
Although near-field imaging techniques reach sub-nanometer resolution on rigid samples, it remains extremely challenging to image soft interfaces, such as biological membranes, due to the deformations induced by the probe. In photonic force microscopy, optical tweezers are used to manipulate and measure the scanning probe, allowing imaging of soft materials without force-induced artifacts. However, the size of the optically trapped probe still limits the maximum resolution. Here, we show a novel and simple nanofabrication protocol to massively produce optically trappable quartz particles which mimic the sharp tips of atomic force microscopy. Imaging rigid nanostructures with our tips, we resolve features smaller than 80 nm. Scanning the membrane of living malaria-infected red blood cells reveals, with no visible artifacts, submicron features termed knobs, related to the parasite activity. The use of nanoengineered particles in photonic force microscopy opens the way to imaging soft samples at high resolution.
In photonic force microscopy (PhFM), the laser trap raster scans the sample and the induced displacement of the trapped particle from its equilibrium position is measured by fast interferometry.1−8 Other than providing sub-piconewton/nanometer stiffness, optically trapping the probe decouples it from the instrument, potentially allowing low-force scanning within confined volumes not accessible by other techniques.9 As in atomic force microscopy (AFM), measurements of the axial displacement of the probe in PhFM (signal Sz) reach the nanometer resolution. Recently, an improved version of the PhFM6 has achieved resolutions beyond the diffraction limit in the transverse directions (signals Sx and Sy) using ∼100–200 nm beads as scanning probes. When trapping a spherical particle, reducing its size unfortunately reduces also the signal-to-noise ratio obtained; therefore, other strategies are required to increase the lateral resolution. In order to control the applied optical force and to increase the resolution, different particle geometries have been used in different configurations.10−14 In particular, the behavior of elongated particles trapped in optical tweezers (OT) has been studied experimentally and theoretically due to their potential use as scanning probes.15−19 Second harmonic generation of optically trapped particles has also attracted interest for its potential in scanning microscopy, local spectroscopy, and thermometry.16,20,21 However, the resolution of PhFM still remains limited to hundreds of nanometers in two of the three dimensions, and the PhFM lags behind the AFM mainly because sharp tips equivalent to those used in AFM have yet to be developed.
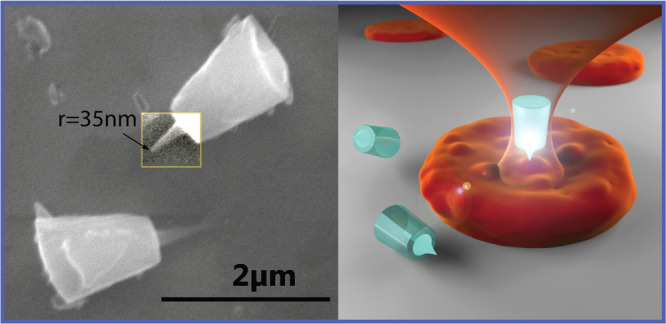
We have developed a novel nanofabrication protocol (sketched in Figure 1a), wherein we can produce optically trappable particles (60 × 106 per batch) which mimic the sharp tips of AFM. Importantly, to allow stable trapping and to maximize the optical signals from the OT, the probe is designed as a large micron-sized truncated cone, holding a sharp feature (of 35 nm radius of curvature in Figure 1b) in the center of its top surface.

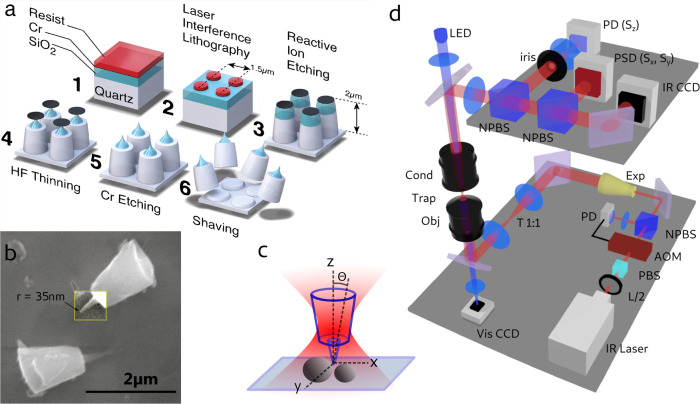
Tip fabrication and optical setup. (a) Microfabrication process. Cylindrical particles are generated by laser interference lithography, etching a quartz substrate where a 800 nm thick SiO2 layer is deposited. A tuned acid thinning by hydrofluoric acid produces sharp tips in the SiO2 layer. The particles are then cleaved mechanically off the substrate. (b) Scanning electron microscope image of cleaved particles, where the contrast of one tip has been enhanced for clarity. The radius of curvature of the tip is 35 nm. (c) Schematic cartoon of the optical trap holding the particle and scanning the surface of the sample with the sharp tip. (d) Schematic optical setup. L/2, half-wave plate; PBS, polarizer; AOM, acousto-optical modulator; NPBS, nonpolarizing beam splitter; Exp, beam expander; T1:1, one to one telescope; Obj, objective; Cond, condenser; PD, photodiode (to acquire Sz); PSD, position-sensitive detector (to acquire Sx,y); IRCCD, infrared CCD camera; VisCCD, visible CCD camera.
The simplicity of the nanofabrication protocol relies mainly on the use of laser interference lithography (LIL)22 (a cost-effective, parallel, and reliable technique which we describe in detail in ref (23)) to write the pattern that produces the particles. The particle geometry is produced by two serial etching processes which follow the LIL exposure: a first anisotropic reactive ion etching to produce the cylindrical geometry, followed by an isotropic hydrofluoric acid (HF) wet etch step to produce the tips on a top deposited SiO2 layer. Once obtained, the particles are mechanically cleaved off the substrate, collected, and stored in liquid. With scanning electron microscopy imaging, we find that 30% of the collected particles maintain their tip. The details of the nanofabrication protocol are described in the Supporting Information.
The core material chosen is quartz, a crystal whose birefringence is instrumental in PhFM. Birefringent cylindrical particles have been developed by different techniques in the context of optical single-molecule manipulation.23−28 Due to the torque imposed by radiation pressure, the main axis of the trapped particle remains parallel to the laser propagation direction. Also, due to the torque imposed by the laser linear polarization on the birefringent medium, the x-cut quartz particle cannot rotate about its geometrical axis (the particle can rotate about its main axis if the laser polarization is circular or if the linear polarization is set in rotation).29,30 This constrains all the degrees of freedom (x, y, z and two angles, Figure 1c) of the trapped particle. Moreover, the chemical stability of the crystal prevents the formation of reactive molecules, as observed in trapped semiconductor and metallic nanoparticles.31 Our OT setup is shown in Figure 1d and is described in detail in the Supporting Information. Briefly, a stabilized infrared laser beam of 20–60 mW power is focused by a 1.2 NA microscope objective into a flow cell containing the sample to scan. The forward-scattering detection consists of a position-sensitive detector (PSD) to acquire the transverse displacement of the trapped particle (signals Sx and Sy) and of a separate photodiode with reduced numerical aperture32 to detect the axial displacement (Sz signal). In this way, the transverse and axial resolution can be maximized independently.
Despite its complex geometry, the particle in the trap behaves not too differently from the standard spherical dielectric beads commonly used in OT. We characterize and quantify its behavior in Figure 2 by analyzing its overdamped Langevin dynamics (as inertia does not play a role at a low Reynolds number). In Figure 2a, we perform a distance-displacement measurement: the signals Sz,x,y are recorded while the trap position slowly scans the axial direction and contacts the rigid substrate surface. The resulting z-displacement of the tip within the trap can be approximated by a linear curve for displacements up to 400 nm. At the same time, the Sx and Sy signals remain constant, indicating that the particle x, y position is only slightly perturbed when exploring the extreme axial region of the optical potential. In order to calibrate the instrument, we extract the sensitivity β (0.94 mV/nm) from the linear region of the z-displacement curve in Figure 2a, by which one can map the signals from volts to physical distance (e.g., see the inset of Figure 2b). Fitting the power spectrum shown in Figure 2b with a Lorentzian function,34 we obtain the trap stiffness kz (3 fN/nm) and the particle drag γz (6 × 10⁻⁶ pN s/nm). To test the calibration further, we compare the resulting drag coefficient γz with the theoretical value γ∥ obtainable for microscopic cylinders35 (see Supporting Information section 2), which we find in the range γ∥ = (6–9) × 10–6 pN s/nm, validating our experimental value. Also, if we consider the theoretical value of the drag coefficient γ⊥ for a cylinder translating in the plane x, y we can calibrate the transverse dimensions of the OT, as well. This allows us to obtain images of the sample from the three displacement signals: Sz, Sx, and Sy.
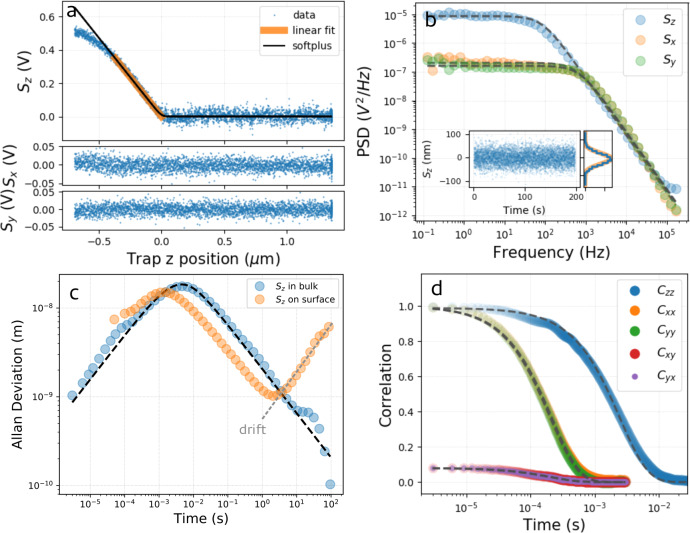
Characterization of the trapped particle. (a) Indentation measurement. The signals Sz,x,y are recorded while the optical trap is moved along z. The particle starts interacting with the flat glass surface at z = 0. The Sz signal is linear in the region highlighted in orange. Here, the tip faces the surface (see Figure 3a). (b) PSD of the signals Sz,x,y acquired from a particle trapped in the liquid bulk. The dashed lines correspond to Lorentzian fits to the data. The inset shows the signal Sz in nanometers, together with its probability density (blue histogram), fit by a Gaussian distribution (orange line). (c) Allan deviation for a particle trapped in bulk (blue points) and in contact to the surface (orange points). The black dashed line corresponds to the fit of the analytical expression33 for a particle in a harmonic potential. When the particle is in contact with the glass surface, drift becomes relevant for measurements integrating for more than 1 s. (d) Auto- and cross-correlation functions of the signal Sz,x,y for a particle trapped in the liquid bulk. The dashed lines correspond to single-exponential fits.
In Figure 2c, we trace the Allan deviation36,37 of Sz, which quantifies the accuracy of the measured mean value of the signal as a function of the integration time used. When measured in bulk, the Allan deviation can be fit by an analytical expression for a spherical particle in a harmonic potential.33 The fit provides a trap stiffness kz (4 fN/nm) compatible with the previous results (whereas the drag γz = 11 × 10–6 pN nm/s is far from the value obtained above because of the hypothesis of spherical geometry). The Allan deviation peak indicates that the particle requires ∼10 ms to explore the trap volume and that ∼4 s of integration is required to reach 1 nm accuracy. When measured with the particle in contact with the surface, the Allan deviation indicates that drift in our setup starts to deteriorate the z-accuracy for integration times longer than 1 s. In the following, when imaging the sample surface with these particles, as a compromise between z-measurement accuracy and imaging time, we fix the time spent on each pixel to 80 ms, expecting an accuracy in z of few nanometers (see Supporting Information Figure S5 for the implementation of drift correction).
Additionally, the auto- and cross-correlations of the signals carry interesting information about the linear and angular fluctuations of the elongated particle.38−40 After correcting for a small crosstalk between the signals Sx and Sy (see Supporting Information section 2), we find that both the autocorrelations, Cii(τ) = ⟨Si(t)Sii(t + τ)⟩ (i = x, y, z), and the transverse cross-correlation, Cxy(τ), can be fit by a single exponential (Figure 2c). The values of the exponential rates of Cxx, Cyy, and Cxy (corresponding to ωi = ki/γi for Cii (i = x, y) and to ΩΘ = kΘ/γΘ for Cxy, where Θ indicates the tilt angle; see Figure 1c) are found within 3% relative error. Considering the theoretical value for the angular drag coefficient of a cylinder with the dimensions compatible with our particle (γΘ = 8.8 pN nm s; see Supporting Information section 4), we can estimate from the exponential fit of Cxx and Cyy (Ω = 4530 s–1) the value of the angular stiffness (kΘ = 4 × 10⁴ pN nm; see Supporting Information section 3). The tilt angular fluctuations of the trapped particle can be estimated from . In conclusion, these results show that the particle remains stably trapped vertically in the laser focus, and that its axial position can be accurately measured by the signal Sz.
To validate our approach, we employ the nanofabricated tips to image structures on a hard substrate, which can be reliably imaged by conventional AFM for comparison. To this end, we etched the glass coverslip surface masked by randomly adhered 100 nm polystyrene beads. We find that the scattering due to the sample is negligible with respect to that from the trapped particle, due to its micrometer-scale size. Therefore, we do not implement here the correction successfully proposed by Friedrich et al. for more optically thick samples.6 The results are shown in Figure 3. First, for each particle trapped, we need to assess whether the tip faces the sample. We have found that this can be done easily and systematically by running a set of z-displacement measurements (Figure 3a), where, between each measurement, the laser trap is briefly blocked to let the particle reorient. The curves corresponding to the two configurations (tip up, tip down) are well recognizable from their shape and relative position.
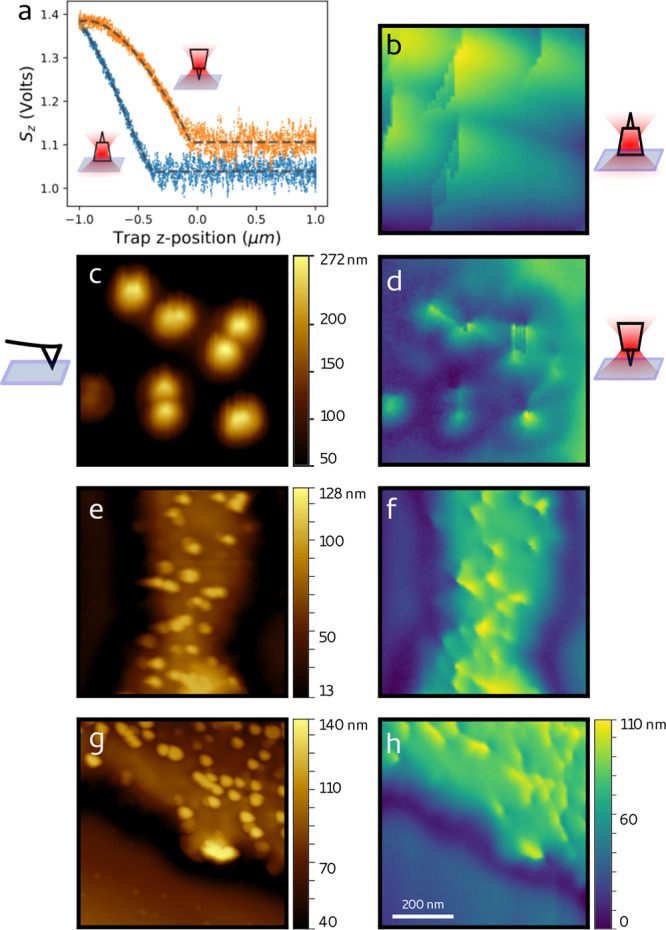
AFM and PhFM imaging of rigid samples. (a) z position-displacement curves for the two possible particle orientations. When the tip faces the surface (orange points), the contact point appears before (∼400 nm) than when the tip is in the opposite direction (blue points). The shape and relative values (in volts) of the two curves differ and allow systematic recognition of the tip orientation. The dashed lines correspond to a fit to a piece-wise polynomial function. (b) Image of 100 nm random features on glass obtained with the tip not facing the sample. (c) AFM image and (d) PhFM image (with tip facing the sample) of the same region. (e,g) AFM and (f,h) PhFM images of the same regions. Details of 80 nm can be resolved (see Supporting Information Figure S6). The color bars of (d,f,h) are the same. All the scans cover an area of 1 × 1 μm2.
We then record the signals Sz,x,y while scanning the sample surface sequentially at discrete positions spaced by 10 nm, which correspond to the position of each pixel. The images in Figure 3b,d correspond to the image of the same region obtained with the two tip configurations: the details of the sample appear only when the tip faces the sample. The image of the same region obtained by AFM (Figure 3c) confirms the one obtained by PhFM (Figure 3d). Two more comparisons between images of the same sample obtained by AFM and PhFM are shown in Figure 3e,f and Figure 3g,h and indicate that features of at least 80 nm (see Supporting Information Figure S6) can be well resolved with the nanofabricated tips by PhFM. Given the stiffness of the optical trap (kz = 3 fN/nm), the maximum force applied by the tip on the sample remains lower than 0.4 pN. Interestingly, the image obtained from the transverse tip displacement (Sx, Sy) highlights the borders of the objects scanned (Supporting Information Figure S3).
To demonstrate the potential of the technique in scanning intact living cells (without artificial hardening the sample, as routinely done in AFM to produce a sufficient probe displacement), we now image the external membrane of intact red blood cells infected by the malaria parasite. When Plasmodium falciparum infects a red blood cell, it exports newly expressed proteins (such as PfEMP1 and KHARP) to the host cell membrane, altering its otherwise smooth topography. As a result, small features of about 100 nm, termed knobs, appear on the surface, stiffening the membrane and causing increased cell adherence and eventually vascular flow nuisances41 (Figure 4a). The infected red blood cells are immobilized on a poly-l-lysine (PLL)-coated glass coverslip, which also applies tension to the membrane. The cells are otherwise not treated biochemically.
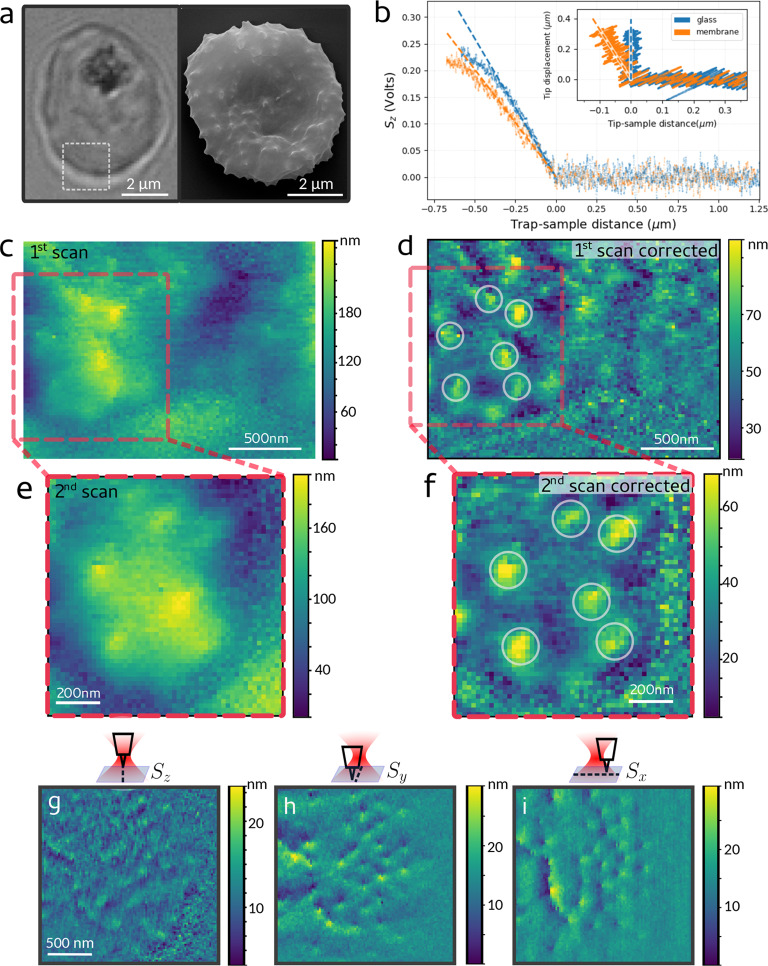
PhFM of the membrane of living malaria-infected red blood cells presenting knobs on its surface. (a) Optical (left) and SEM (right, kindly provided by Laurence Berry, UMR5235 Un. Montpellier) image of an infected red blood presenting knobs on its surface. A region scanned by PhFM is shown in the optical image. (b) Axial position-displacement curves obtained on the hard glass surface and on the cell membrane. The linear fits after contact are shown by dashed lines. Inset: corresponding indentation curves, where the curve corresponding to the glass surface is set vertical. (c) Image obtained from the axial displacement signal Sz in a first scan of an infected cell and (d) its high-pass filtered version. (e) Image obtained in a subsequent scan in the region highlighted in red and (f) its filtered version. In (d,f), the same protrusions ascribable to knobs are marked by circles, showing that their position is the same in the two scans. (g–i) Scan on a different infected cell, where the images are obtained from the signals Sz, Sx, Sy as indicated and high-pass filtered. Despite the limited axial resolution in Sz (g), the presence of the knobs is retrieved in the transverse signals (h,i).
In Figure 4b, we first show the results of membrane indentation measurements. The signal Sz is shown as a function of the axial position of the optical trap, approaching both the cell membrane and the rigid glass surface. Taking as a reference the curve obtained on glass, the inset shows that the membrane is indented by a maximum of 100 nm when the tip axial displacement is 300 nm. The calibration provides here an axial stiffness of kz = 1.5 fN/nm; therefore, the maximum force applied on the membrane by the tip is 0.45 pN. These measurements have been corrected by subtracting a background due to scattering, as shown in Supporting Information Figure S9. We then scan a 2 × 2 μm2 region of the cell far from the location of the optically dense hemozoin (a byproduct of hemoglobin digestion) and of the parasite (Figure 4a). When the low frequencies are removed by 2D polynomial subtraction from the original image (Figure 4c and Supporting Information Figure S8), small protrusions of ∼100 nm diameter and ∼20 nm height become clearly visible (Figure 4d). A subsequent scan of the region highlighted in red in Figure 4c,d confirms the positions and dimensions of these structures (∼150 nm × 40 nm, Figure 4e,f and Supporting Information Figure S8), which are compatible with knobs observed by electron microscopy and AFM on dead cells.41−43 Images of similarly immobilized noninfected red blood cells show a smoother topography, where such structures are absent, as expected (Supporting Information Figure S10). In Figure 4g–i, we show the scan of a different infected live cell, where the axial resolution (Figure 4g) is barely sufficient to resolve the knobs even after image filtering. However, information about the presence and positions of the knobs can also be retrieved from the transverse signals Sx, Sy (Figure 4h,i), which reflect the lateral shift of the particle in the trap due to the sample topography (encountering small features along its trajectory, the probe is shifted both axially and laterally). Although this information is currently qualitative, this shows the rich information easily obtainable by PhFM (similar to lateral force microscopy in AFM44), the exploitation of which will be explored in future studies.
In conclusion, we have shown a new and simple nanofabrication protocol to massively produce optically trappable particles with sharp tips, and by characterizing their behavior in the trap, we have shown that they are well suited for scanning imaging. Employing the tips in PhFM, we obtain images of rigid substrates with resolution below 80 nm, which compare well with those obtained by AFM. The potential of PhFM in scanning soft materials while applying sub-piconewton force is shown in imaging the 150 nm × 40 nm knobs on the membrane of red blood cells infected by P. falciparum. Images are obtained from living cells, with a maximum force of a fraction of a piconewton, introducing no visible artifacts. Other scanning techniques mainly require chemical fixation to rigidify the sample (therefore killing the cells) and need to apply minimum forces of tens to hundreds of piconewton to obtain a sufficient probe deflection and a good signal-to-noise ratio in the image (a notable alternative is scanning ion conductance microscopy45). In our implementation of PhFM, we find that a critical factor is the passivation of the probe (currently we use incubation in bovine serum albumin). Aspecific binding of the probe to the sample often terminates the scan, and the low force of the optical trap is not always sufficient to free the particle. Novel strategies have to be explored in this regard. The speed of imaging depends on the time required for the probe to accurately sample each pixel (a 100 × 100 pixel image requires 13 min). To decrease this characteristic time (equal to γ/k), the trap stiffness k can be increased via the laser power, but this is not always compatible with delicate samples. Alternatively, smaller particles could be engineered from higher index materials in order to decrease the drag while keeping high stiffness. A good candidate is TiO2.28 Interestingly, using a birefringent material (such as quartz or TiO2) also allows for torque manipulation.24,30,46 Despite the fact that our particles are not absorbing and that the absorption of water in the near-infrared is low,47 heating effects48 might be detrimental for the behavior of biological material under a PhFM scan. Thus, it is generally important to keep the trapping power at the sample below 50 mW (as in our case) to minimize thermal heating around the trapping region. As local heating of the sample during the scan should be minimized, it is interesting to note that novel methods such as laser refrigeration can be achieved with nanocrystals in resonant conditions.49,50 The photonic force microscope and optical tweezers are versatile and multifunctional instruments, which allow mechanical and dynamical measurements, together with manipulation at the micro- and nanoscale. Our results open the way to new PhFM development for high-resolution imaging.
Supporting Information Available
The Supporting Information is available free of charge at https://pubs.acs.org/doi/10.1021/acs.nanolett.0c00729.
Methods, corrections, correlation analysis theory, theoretical drag of microscopic cylinders, image calibration and reconstruction (PDF)
Author Contributions
⊥ R.D. and Z.S. contributed equally.
Notes
The authors declare no competing financial interest.
Acknowledgments
This paper is dedicated to the memory of our colleague Jelle van der Does. We are grateful to to Luca Costa, Pierre Emmanuel Milhiet, and Felix Rico for fruitful input and discussions, to Didier Portran and Viviana Claveria for their help in sample and cell preparations, to Frederic Pichot for the microfabrication, Roland Teissier for the development of the LIL setup, Michel Ramonda for the AFM images, and Laurence Berry for the infected red blood cell image. We acknowledge funding from the European Research Council under the European Union’s Seventh Framework Programme (FP/2007-2013)/ERC Grant Agreement No. 306475. The CBS is a member of the France-BioImaging (FBI) and the French Infrastructure for Integrated Structural Biology (FRISBI), 2 national infrastructures supported by the French National Research Agency (ANR-10-INBS-04-01 and ANR-10-INBS-05, respectively).