
These authors contribute equally to the study.
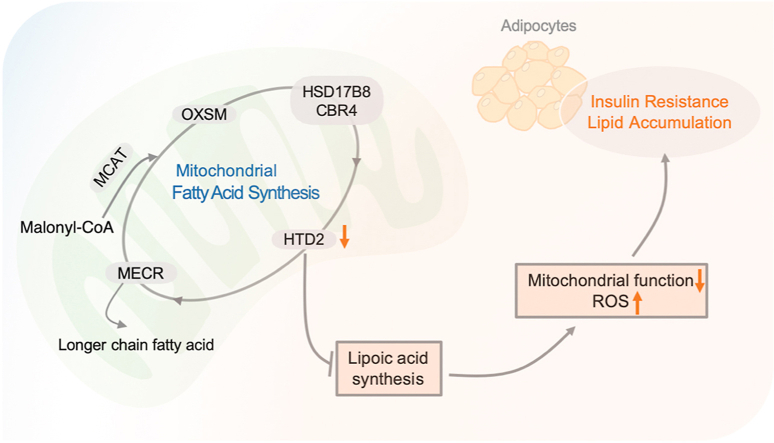
Mitochondria harbor a unique fatty acid synthesis pathway (mtFAS) with mysterious functions gaining increasing interest, while its involvement in metabolic regulation is essentially unknown. Here we show that 3-Hydroxyacyl-ACP dehydratase (HTD2), a key enzyme in mtFAS pathway was primarily downregulated in adipocytes of mice under metabolic disorders, accompanied by decreased de novo production of lipoic acid, which is the byproduct of mtFAS pathway. Knockdown of Htd2 in 3T3-L1 preadipocytes or differentiated 3T3-L1 mature adipocytes impaired mitochondrial function via suppression of complex I activity, resulting in enhanced oxidative stress and impaired insulin sensitivity, which were all attenuated by supplement of lipoic acid. Moreover, lipidomic study revealed limited lipid alterations in mtFAS deficient cells which primarily presenting accumulation of triglycerides, attributed to mitochondrial dysfunction. Collectively, the present study highlighted the pivotal role of mtFAS pathway in regulating mitochondrial function and adipocytes insulin sensitivity, demonstrating supportive evidence for lipoic acid being potential effective nutrient for improving insulin resistance and related metabolic disorders.

•
3-Hydroxyacyl-ACP dehydratase is decreased in adipocytes under diabetic condition.
•Deficient of 3-Hydroxyacyl-ACP dehydratase (HTD2) triggers mitochondrial dysfunction.
•Deficient of HTD2 promotes insulin resistance in adipocytes.
•Supplement of lipoic acid ameliorates deleterious effects of HTD2 deficiency.
White adipose tissue (WAT) is known as active endocrine organ for regulating energy balance, glucose and lipid metabolism and immunity in response to various nutritional statuses, insulin, inflammation, and aging [[1], [2], [3], [4]]. Despite of heterogeneity, adipocyte remains the predominate cell type in WAT, and increased WAT mass is the distinct feature of obesity, which has been considered as the driving force in insulin resistance and pathogenesis of metabolic syndrome [2,5]. It's becoming more apparent that WATs at different locations like visceral and subcutaneous depots have diverse effects in the development of insulin resistance with the fact that certain individuals are relatively resistant to metabolic syndrome [[5], [6], [7], [8], [9]]. This implies the importance of understanding intricate networks inside adipocytes under physiological and pathological conditions for unveiling their contributions in health management.
In the process of obesity, adipose tissues go through dynamic and complex cellular changes to expand tissue size via either hypertrophy (increase in size of existing adipocytes) or hyperplasia (formation of new adipocytes through adipogenesis from preadipocytes) [5,10]. Both activities involve fatty acid synthase (FASN) mediated De Novo lipogenesis pathway, which utilizes citrate from mitochondrial TCA cycle to synthesize palmitate with the help of ATP citrate lyase and acetyl-CoA carboxylase [11]. It was reported that FASN is closely involved in the regulation of food intake, body weight and obesity via modulating adipocyte functionality [[12], [13], [14]]. Interestingly, previous studies have unveiled the second fatty acid synthesis pathway in mitochondria (mtFAS) in addition to cytoplasmic FASN [15,16]. Unlike FASN, which presents catalyzing activities in one protein complex, mtFAS is constituted of several enzymes (MCAT, malonyl-CoA/ACP transferase; OXSM, 3-Ketoacyl-ACP synthase; CBR4/HSD17B8, 3-Oxoacyl-ACP reductase; HTD2, 3-Hydroxyacyl-ACP dehydratase; MECR, 2-Enoyl-ACP reductase) catalyzing each step in the elongation of fatty acyl chain on soluble acyl carrier protein (ACP) scaffold [17]. Although enzymes responsible for each step of mtFAS pathway have been fully identified [18], their physiological and pathological involvements of cellular activities remain poorly understood.
The bulk of fatty acid synthesis is primarily produced by FASN, while the fatty acid products of mtFAS have not been unambiguously settled. Previous studies have suggested that 3-hydroxymyristate (14:0), 3-hydroxylaurate (12:0), mitochondrial membrane phospholipids and cardiolipin were the mysterious products of mtFAS pathway, which remain extensive verification [15,19,20]. On the other hand, recent studies have well documented that mtFAS could produce octanoyl-ACP, a well-established precursor for lipoic acid synthesis in mitochondria [21]. Lipoic acid is the essential cofactor for several mitochondrial multienzyme complexes such as the pyruvate dehydrogenase complex (PDH), α-ketoglutarate dehydrogenase (α-OGDH), and branched-chain ketoacid dehydrogenase (BCKDH), all of which are closely involved in energy metabolism [22]. We have previously showed that external lipoic acid supplement could promote mitochondrial biogenesis in 3T3-L1 adipocytes [23,24], which was further confirmed in overweight subjects [25]. Together with other studies on glucose uptake and insulin signaling [26,27], supplement of lipoic acid has been suggested as feasible strategy against metabolic syndrome by targeting adipocyte function. However, the physiological and pathological involvements of endogenous lipoic acid synthesis in regulating adipocyte function remain limited.
In the present study, we found that Htd2, the gene-encoding the enzyme catalyzing 3-hydroxyacyl-ACP to produce trans-2-Enoyl-ACP in mtFAS pathway, was consistently decreased in adipocytes of obese and diabetic animals. Downregulation of Htd2 in 3T3-L1 cells primarily suppressed mitochondrial complex I function and resulted in dramatic mitochondrial oxidative stress. Even though lowered lipoic acid production and disrupted lipid composition were all observed in Htd2 deficient cells, lipoic acid supplement could sufficiently restore mitochondrial activity and redox balance in cells with improved glucose uptake and insulin sensitivity. The study further highlights the vital role of mtFAS pathway in mediating adipocyte function, suggests that HTD2-involved endogenous lipoic acid synthesis is a key factor triggering response to mitochondrial oxidative stress and cellular dysfunction, and also provides new evidence for lipoic acid supplementation as an effective strategy for metabolic disorders.
Htd2 expression is decreased in adipocytes of obese and diabetic mice. To explore the expression pattern of mtFAS enzymes under condition of metabolic disorders, we introduced obese and diabetic mice with HFD feeding for 12 weeks. Body weight gain, OGTT as well as ITT assays indicated an obvious obese and diabetic condition in mice with hyperlipidemia condition (Fig. S1). mRNA levels of mtFAS enzymes including Hsd17b8, Cbr4, Mecr, Htd2, Mcat, Oxsm were analyzed in multiple tissues. As shown in Fig. 1, Mecr and Htd2 were found decreased in the liver of HFD mice comparing to chow mice (Fig. 1A), while only Htd2 was decreased in muscle (Fig. 1B). In brown adipose tissue (BAT), Mecr, Htd2, as well as Mcat were significantly decreased in HFD group (Fig. 1C), and a broad decrease of mtFAS expression except Hsd17b8 was found in WAT of HFD group (Fig. 1D), suggesting generally suppressed mtFAS pathway under condition of metabolic disorders. In addition, the genetically diabetic db/db mice were also employed for analysis. mtFAS mRNA levels were not altered in the liver of db/db mice comparing to C57 control (Fig. 1E), and only Htd2 was uniquely decreased in muscle, BAT, and WAT of db/db mice (Fig. 1F–H). We further analyzed mRNA level of Htd2 in another genetic animal model (ob/ob) and found consistent decrease in both BAT and WAT (Fig. 1I). Even though, mtFAS enzymes presented various degrees of suppression in tissues of obese and diabetic animals, Htd2 mRNA showed consistent and significant decrease in WAT, indicating a potential important role of HTD2 in regulating adipocyte metabolic activity.
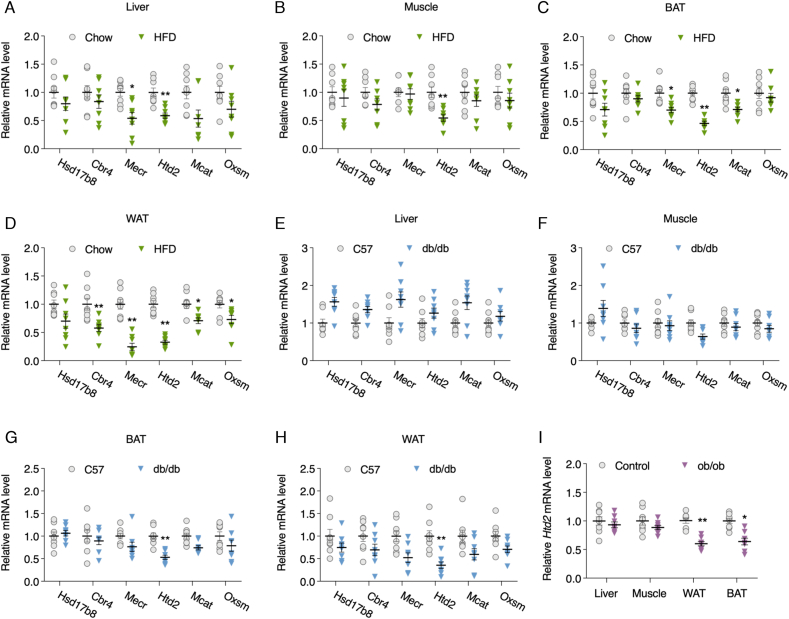
Htd2 expression is decreased in adipocytes of obese and diabetic mice. C57BL6 mice were fed on chow or high-fat diet for 12 weeks, mRNA levels of Hsd17b8, Cbr4, Mecr, Htd2, Mcat, and Oxsm were analyzed in liver (A), muscle (B), BAT (C), and WAT (D); mRNA levels of Hsd17b8, Cbr4, Mecr, Htd2, Mcat, and Oxsm in liver (E), muscle (F), BAT (G), and WAT (H) of C57BL6 and db/db mice; mRNA level of Htd2 in liver, muscle, BAT, and WAT of C57BL6 and ob/ob mice. Values are mean ± SEM, n = 6, *p < 0.05, **p < 0.01.
Lipoylated proteins are reduced in WAT of obese and diabetic mice. In contrast to FASN catalyzing fatty acid synthesis within one enzyme complex, mtFAS pathway encompasses multiple enzymes in charge of each catalyzing step in an ACP-dependent manner [34]. HTD2 as one of the enzymes in mtFAS converts 3-hydroxyacyl-ACP to trans-2-Enoyl-ACP, which works as a substrate for MECR to produce Acyl-ACP, the known precursor for endogenous lipoic acid synthesis (Fig. 2A). Despite the identification of mtFAS enzymes for quite long time, the fatty acid products of mtFAS remain uncertain, and lipoic acid is the only established byproduct which serves as a cofactor for mitochondrial enzymes by lipoylation [21]. We thereby analyzed lipoylated PDH and α-OGDH levels to evaluate the lipoic acid production in the muscle and WAT of HFD and db/db mice. As shown in Fig. 2, only a significant decrease of LA-PDH-E2 was observed in muscle while LA-OGDH-E2 was not altered (Fig. 2B and C). Meanwhile, dramatic decreases of LA-PDH-E2 and LA-OGDH-E2 were observed in the WAT of both HFD and db/db mice (Fig. 2D and E), indicating a more profound and dramatic suppression of mtFAS activity in WAT under metabolic disorders.
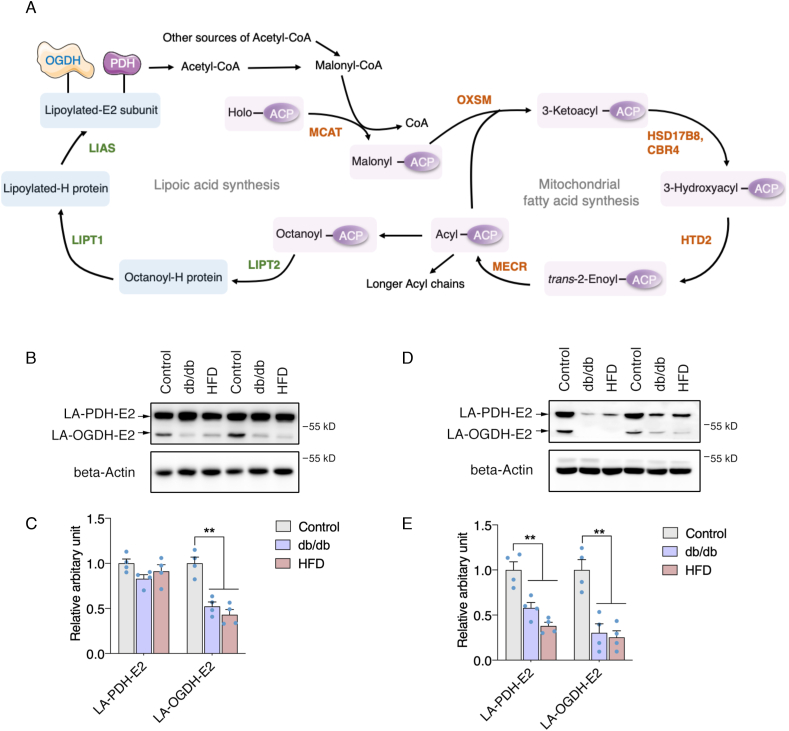
Lipoylated proteins are reduced in WAT of obese and diabetic mice. (A) Schematic representation of a the fatty acid and lipoic acid de novo synthesis in mitochondria; Lipoylation levels of PDH-E2 and OGDH-E2 subunits in the muscle of C57BL6, db/db, and ob/ob mice: (B) Representative western blot images, (C) Statistical analysis); Lipoylation levels of PDH-E2 and OGDH-E2 subunits in the WAT of C57BL6, db/db, and ob/ob mice: (D) Representative western blot images, (E): Statistical analysis. Values are mean ± SEM, n = 4, **p < 0.01. ACP: Acyl carrier protein; CBR4: Carbonyl reductase 4; HTD2: Hydroxyacyl-thioester reductase type 2; HSD17B8: Hydroxysteroid 17-beta dehydrogenase 8; MCAT: Malonyl-CoA-acyl carrier protein transacylase; MECR: Mitochondrial trans-2-enoyl-CoA reductase; OXSM: 3-oxoacyl-ACP synthase; LIPT1: Lipoyltransferase 1; LIPT2: Lipoyl(octanoyl) transferase 2; LIAS: Lipoic acid synthetase.
Htd2 deficiency suppresses lipoic acid production with altered lipid profiles in 3T3-L1 cells. To further evaluate the details of HTD2 in regulating cellular activity, we firstly confirmed HTD2 subcellular localization through immunostaining. Consistent with previous report [35], HTD2 was found to localize in the mitochondria (Fig. 3A), overlapping coefficient analysis indicated average of 69% colocalization (Fig. S2A). Further cellular fractions analysis confirmed HTD2 localization in mitochondria (Fig. S2B). Meanwhile, we generated stable knockdown 3T3-L1 preadipocytes with shRNAs specifically targeting Htd2, which knocked down HTD2 mRNA and protein expressions by over 60% (Fig. 3B and C). As the key enzyme in mtFAS pathway, the byproduct of lipoic acid was consistently decreased in Htd2 knockdown cells (Fig. 3D and E). Lipidomic analysis of lipid profiles identified 938 lipid metabolites in total, while only 35 metabolites (Fig. S3) were significantly altered (fold change ≥ 2, p < 0.05) and only 6 metabolites were decreased including one free fatty acid (Fig. 3F and G). This observation suggests that mtFAS suppression may have minor effect on de novo fatty acid synthesis, and whether the altered free fatty acid (24:2) is a direct product of mtFAS pathway requires further verification. In addition, KEGG analysis of top 25 altered metabolites revealed that they are primarily involved in fat digestion and absorption among organismal systems, metabolic pathways among metabolism, and insulin resistance among human diseases (Fig. 3H), further supporting a potential vital role of mtFAS in regulating adipose metabolic function.
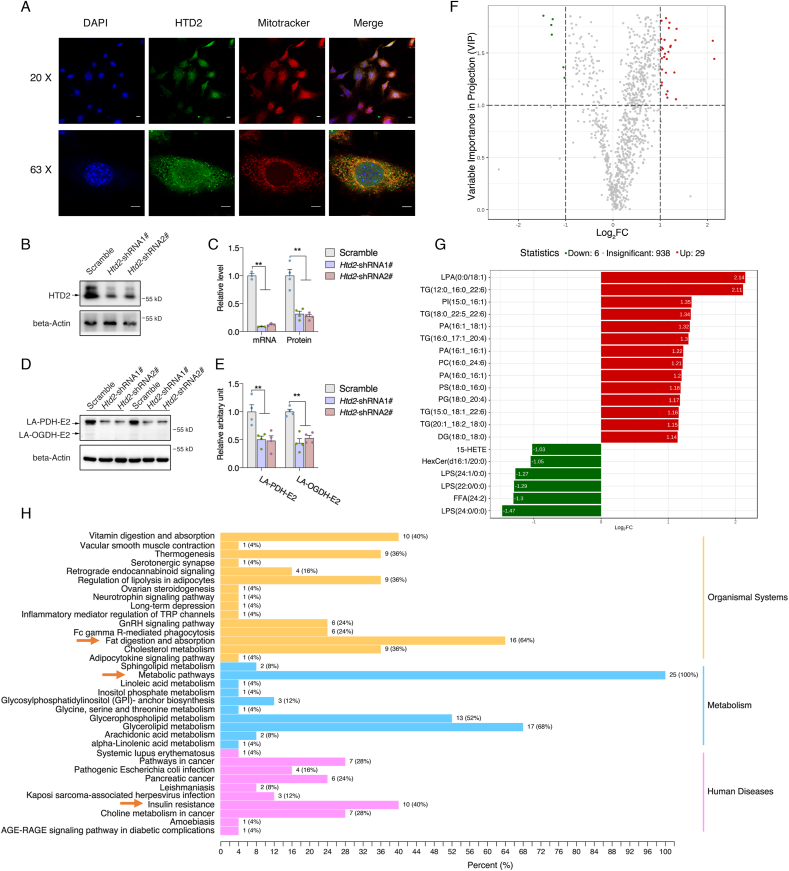
Htd2 knockdown suppresses lipoic acid production with alteredlipid profiles in 3T3-L1 cells. (A) Co-localization of HTD2 with mitochondria in HeLa cells; mRNA and protein levels of HTD2 after shRNA mediated knockdown in 3T3-L1 cells: (B) Representative western blot images, (C): Statistical analysis of mRNA and relative protein contents); Lipoylation levels of PDH-E2 and OGDH-E2 subunits in 3T3-L1 cells after HTD2 knockdown: (D) Representative western blot images, (E): Statistical analysis; Lipidomics analysis for lipid profile in 3T3-L1 cells after Htd2 knockdown: (F) Volcano plot with fold change, (G): Top metabolites with fold change, (H) KEGG pathway analysis. Values are mean ± SEM, n ≥ 3, **p < 0.01. Scale bar, 10 μM. LPA: lysophosphatidic acid; LPS: lysophosphatidylserine; PA: phosphatidic acid; PC: phosphatidylcholine; PG: phosphoglyceride; PS: phosphatidylserine; TG: triglyceride.
Htd2 deficiency provokes mitochondrial dysfunction. Since lipidomic analysis demonstrated that significantly altered lipids were primarily increased after Htd2 knockdown, and those increased metabolites were enriched in triglycerides (Fig. 3G), we thereby verified the changes in 3T3-L1 cells with Nile staining, which revealed obvious increased lipid droplets in Htd2 knockdown cells (Fig. 4A). Moreover, coefficient correlation analysis with either Kendall, Pearson, or Spearman test showed consistently no correlation between downregulated metabolites with increased metabolites after Htd2 knockdown (Figs. S4–S6), indicating an independent bioprocess was involved in accumulating lipids. In addition to de novo fatty acid synthesis, mtFAS as conserved pathway was suggested to play a key role in maintaining mitochondrial physiology [34], and we previously showed that suppression of mtFAS pathway by inhibiting OXSM (HsmtKAS) activity could impair mitochondrial function [36]. We speculated that increased triglycerides were attributed to impaired fatty acid oxidation by suppression of mitochondrial function. As expected, Seahorse analysis showed that knockdown of Htd2 induced significant decrease of mitochondrial maximal, spare and ATP associated respirations with increased proton leak (Fig. 4B). Intriguingly, further analysis showed that Htd2 knockdown specifically decreased mitochondrial complex I activity (Fig. 4C), which may be attributed to decreased complex I subunit expression encoded by mtDNA (Fig. 4D). These data suggest that mtFAS deficiency induces profound mitochondrial dysfunction and may contribute to extra lipid accumulation.
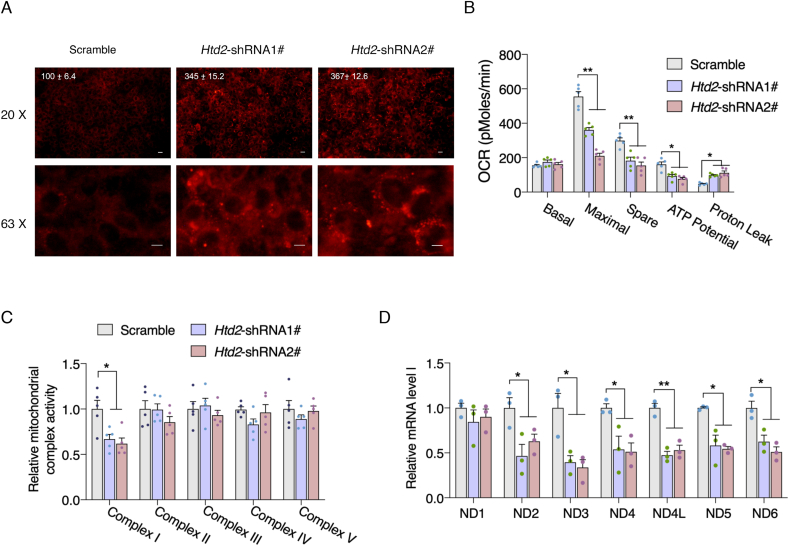
Htd2 knockdown impairs complex I activity and provokes mitochondrial dysfunction. (A) Nile red staining of lipid droplet in 3T3-L1 cells after Htd2 knockdown, average fluorescence intensity was normalized to the scramble control and appeared on top of the image; (B) Seahorse analysis of mitochondrial oxygen consumption and (C) kinetic analysis of electron transport chain activity with isolated mitochondria in 3T3-L1 cells after Htd2 knockdown; (D) mRNA levels of mtDNA encoded complex I subunits in 3T3-L1 cells after Htd2 knockdown. Values are mean ± SEM, n ≥ 3, *p < 0.05, **p < 0.01, Scale bar, 10 μM.
Lipoic acid supplement restores mitochondrial function and antioxidant capacity in Htd2 knockdown cells. It's been well demonstrated that lipoic acid is one of the key elements that modulate mitochondrial function and the primary cellular effects of mtFAS deficiency were attributed to disrupted lipoic acid biosynthesis [21]. We thereby wonder whether supplement of lipoic acid could restore the mitochondrial function in Htd2 knockdown cells. As shown in Fig. 5A, supplement of lipoic acid at 100 μM could sufficiently restore mitochondrial respiration capacity in Htd2 knockdown cells by Seahorse analysis, accompanied by increased cellular ATP level (Fig. 5B). Meanwhile, the specific decrease of complex I activity was also improved by lipoic acid supplement (Fig. 5C). In addition, Mitosox staining indicated a dramatic increase of mitochondrial ROS production in Htd2 knockdown cells which was normalized by lipoic acid (Fig. 5D), suggesting that deficient of HTD2 impaired complex I activity to promote mitochondrial stress and dysfunction via reducing lipoic acid production. Therefore, we further evaluate cellular stress and found decreased GSH level, total SOD, Mn-SOD, and CuZn-SOD activities in Htd2 knockdown cells, which were all restored to normal level by lipoic acid supplement (Fig. 6A–D). Meanwhile, protein oxidation by analyzing carbonyl protein was found significantly increased by Htd2 knockdown, and decreased by lipoic acid supplement (Fig. 6E and F). Taken together, these data suggested that complex I dysfunction and oxidative stress were the primary effects of HTD2 deficiency associated lipoic acid reduction.
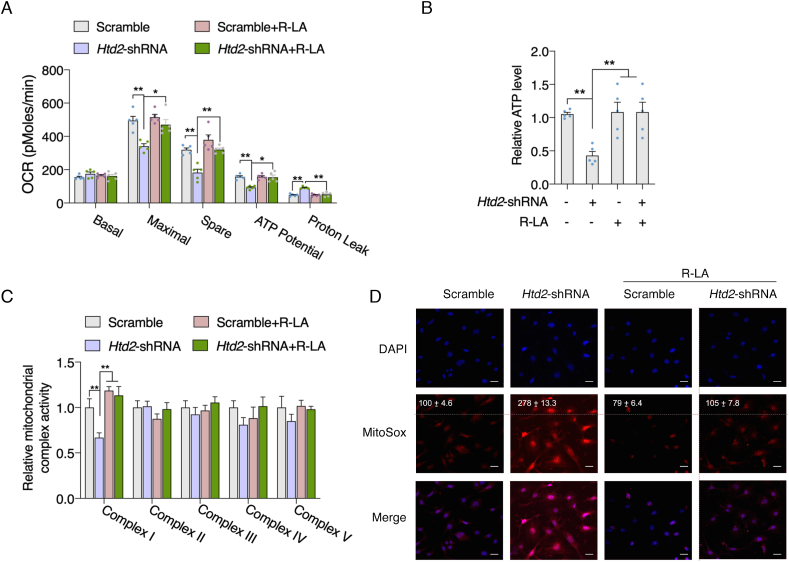
Lipoic acid supplement restores mitochondrial function in Htd2 knockdown cells. 3T3-L1 cells with stable Htd2 knockdown were further supplemented with lipoic acid for 24 h, (A) Seahorse analysis of mitochondrial oxygen consumption; (B) cellular ATP level, (C) mitochondrial electron transport chain activity, and (D) mitochondrial ROS level were analyzed, average fluorescence intensity was normalized to the scramble control and appeared on top of the image. Values are mean ± SEM, n ≥ 3, *p < 0.05, **p < 0.01, Scale bar, 10 μM.
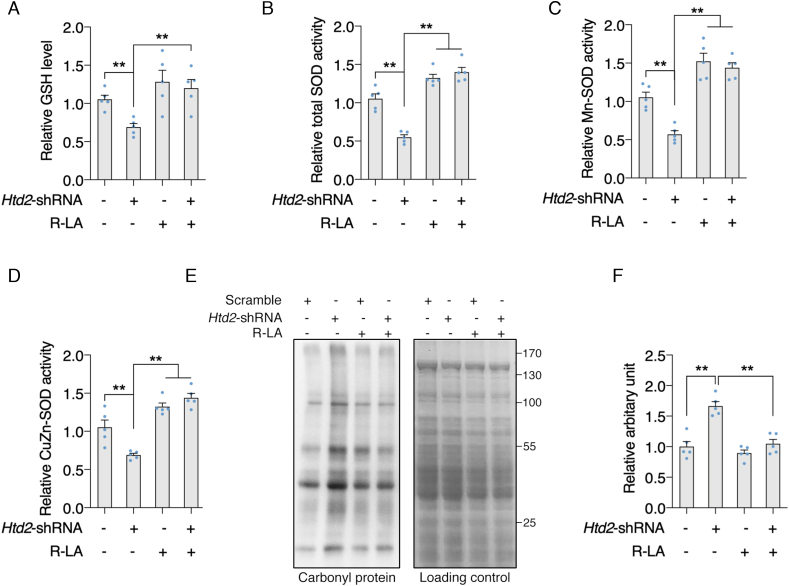
Lipoic acid supplement attenuates oxidative stress in Htd2 knockdown cells. 3T3-L1 cells with stable Htd2 knockdown were further supplemented with lipoic acid for 24 h, (A) cellular GSH level, (B) total SOD activity, (C) Mn-SOD activity, and (D) CuZn-SOD activity was analyzed; Carbonyl protein level was analyzed by Western blot: (E) Representative western blot images, (F) Statistical analysis. Values are mean ± SEM, n ≥ 3, *p < 0.05, **p < 0.01.
Suppression of mtFAS pathway impaires insulin sensitivity in 3T3-L1 cells. It's been well acknowledged that mitochondrial dysfunction is one of the key contributors to the development of insulin resistance. Lipidomic analysis also suggested that significant altered lipid metabolites in Htd2 knockdown cells were primarily associated with insulin resistance (Fig. 3H). We thereby analyzed the p-Akt level under insulin challenge, and found that Htd2 knockdown significantly decreased p-Akt level which was dramatically improved by lipoic acid supplement (Fig. 7A and B). Meanwhile, the protein level of GLU4 was decreased in Htd2 knockdown cells and restored by lipoic acid supplement (Fig. 7C and D). As a result, the glucose uptake under insulin stimulation was suppressed in Htd2 knockdown cells and was improved by lipoic acid supplement (Fig. 7E). While, 3T3-L1 is well acknowledged as preadipocytes. To validate the effects of mtFAS pathway in mature adipocytes, 3T3-L1 cells were further differentiated into mature adipocytes followed by Htd2 knockdown via lentivirus infection. Akt phosphorylation in response to insulin challenge was consistently decreased by Htd2 knockdown and was efficiently improved by lipoic acid supplement (Fig. 7F and G). Similar changes were also observed on GLUT4 expression and glucose uptake (Fig. 7H–J). These data suggest that lipoic acid production is the key factor coupling mtFAS pathway with adipocytes insulin sensitivity.
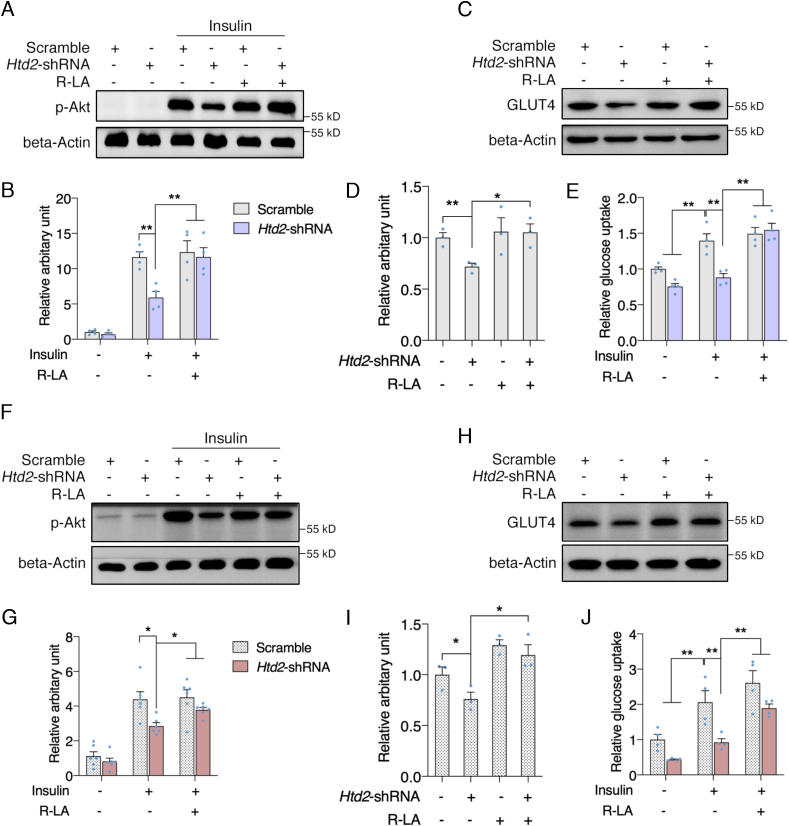
Lipoic acid supplement improves insulin sensitivity in Htd2 knockdown cells. 3T3-L1 cells with stable Htd2 knockdown were further supplemented with lipoic acid for 24 h, followed by insulin challenge for 15 min, protein levels of p-Akt was analyzed (A: Western blot, B: Statistical analysis); 3T3-L1 cells with stable Htd2 knockdown were further supplemented with lipoic acid for 24 h, protein level of GLUT4 (C: Western blot, D: Statistical analysis) and glucose uptake (E) was analyzed. 3T3-L1 cells were differentiated into adipocytes followed by Htd2 shRNA knockdown for 48 hours. P-Akt level in response to insulin challenge (F: Western blot, G: Statistical analysis), GLUT4 expression (H: Western blot, I: Statistical analysis) as well as glucose uptake (J) was analyzed. Values are mean ± SEM, n ≥ 3, *p < 0.05, **p < 0.01.
WAT has been well acknowledged as the major storage site of excess energy for modulating whole-body metabolism, and adipocyte dysfunction was suggested to be linked to insulin resistance in obesity and type 2 diabetes [2,37]. Thereby, studies of detail mechanisms involving adipocyte dysfunction remain the top interest in the field. In the present study, we revealed that Htd2 in mtFAS pathway was the primary down-regulated gene in adipocytes under condition of metabolic disorders. And down-regulated HTD2 could reduce the production of lipoic acid to trigger mitochondrial dysfunction and oxidative stress, leading to insulin resistance.
Even though mtFAS pathway was identified long time ago, its involvement in cellular physiology remains limited [34]. Previous studies in yeast indicated that defects in mtFAS resulted in failure of multiple aspects of mitochondrial function and cellular metabolism [38,39]. Recent study in mice revealed that global knockout of MECR, the enzyme carrying last step of mtFAS, displayed embryonic lethality [40], while MECR knockout in purkinje cells led to neurodegeneration in mice, which were all attributed to the loss of mtFAS activity [41]. HTD2, catalyzing the previous step of MECR, was first identified in yeast presenting close correlation with mitochondrial function and morphology [42]. Here we reported for the first time, that Htd2 was the primary downregulated gene of mtFAS in WAT under condition of insulin resistance in obesity and diabetes, suggesting potential involvement of HTD2 in WAT pathology of metabolic disorders. However, the detailed mechanisms accounting for downregulating Htd2 under such metabolic stress remain further investigation.
In the decade following the initial discovery of mtFAS, one of the major research goals was to identify the ultimate products of mtFAS. Though 3-hydroxymyristate, 3-hydroxylaurate, mitochondrial phospholipids and cardiolipin have been suggested to be the potential candidates, conclusive evidence remains limited [15,19,43,44]. On the contrary, accumulating studies have confirmed that mtFAS pathway could provide precursor for de novo lipoic acid biosynthesis, and deficiency of mtFAS led to reduction of cellular lipoic acid level [[45], [46], [47]]. In addition to antioxidant activity, lipoic acid was well established to work as a cofactor for mitochondrial enzymes including PDH and OGDH [21]. Thereby, lipoylation level of E2 subunits within PDH and OGDH was usually evaluated to indirectly representing cellular lipoic acid production. And consistent with decreased Htd2 expression in WAT of HFD and db/db mice, lipoylation levels of PDH and OGDH were found significantly decreased, while only decreased OGDH lipoylation was observed in BAT, which may be attributed to a less dramatic decrease of mtFAS enzymes, indicating that mtFAS may possess the highest sensitivity to metabolic environment. Further knockdown of Htd2 in murine 3T3-L1 cells also showed reductions of PDH and OGDH lipoylation, suggesting that HTD2 deficiency associated mtFAS dysfunction could directly suppress lipoic acid production.
Given the fact that mtFAS locates in mitochondria, defection of mtFAS is expected to induce mitochondrial abnormalities which has been extensively reviewed recently [15,34]. Consistently, we found that knockdown of Htd2 in 3T3-L1 cells impaired maximal and spare mitochondrial oxygen consumption capacity without affecting basal OCR. Further enzymatic analysis of each mitochondrial complex revealed unique reduction of complex I activity, with significantly decreased expression of mtDNA encoded complex I subunits. It was previously shown that OGDH could interact with complex I of the electron transport chain, allowing a direct supplementation of NADH to the NADH oxidation site of complex I [[48], [49], [50]]. We thereby speculated that decreased lipoylation of OGDH-E2 subunit would impair the interaction with complex I activity which contributed to the suppressed mitochondrial OCR. Moreover, previous study also indicated that both OGDH and complex I were the major sites for mitochondrial ROS production [49], we thus proposed that the impaired OGDH and complex interaction would result in excessive mitochondrial superoxide, which was evidently confirmed by mitoSOX staining of Htd2 knockdown cells. The elevated mitochondrial oxidative status would further promote oxidation of mitochondrial lipids and proteins [51], as shown by the increased carbonylated proteins and decreased SOD activity. Interestingly, supplement of lipoic acid sufficiently improved mitochondrial OCR and attenuated oxidative stress in Htd2 knockdown cells. We thereby conclude that mitochondrial complex I dysfunction and oxidative stress were the primary cellular consequences induced by HTD2 deficiency via reduction of lipoic acid level.
Adipocytes are well acknowledged for actively responding to insulin signal for regulating systemic glucose and lipid homeostasis with the involvement of classic Akt phosphorylation and Glut4 translocation [3]. Previous studies have highlighted mitochondrial dysfunction as a pivotal factor contributing to disruption of adipose insulin sensitivity [[52], [53], [54]]. Following observation of mitochondrial oxidative stress induced by Htd2 knockdown, we consistently found that Htd2 knockdown decreased Akt phosphorylation, GLUT4 expression, and glucose uptake under insulin stimuli in both preadipocytes and mature adipocytes, further supporting the direct relation between mitochondrial dysfunction and adipocyte insulin resistance. As expected, lipoic acid supplement sufficiently improved the cellular response to insulin stimuli. Even though mtFAS pathway was identified for de novo synthesis of free fatty acid, while lipidomic analysis with Htd2 knockdown cells only identified 6 significantly decreased lipids including only one free fatty acid (24:2), which warrants further investigation to elucidate its association with mtFAS pathway. On the contrary, Htd2 knockdown cells presented multiple increased triglycerides which might be attributed to impaired mitochondrial function and closely associated with development of insulin resistance based on KEGG analysis. Further lipoic acid supplement attenuated Htd2 knockdown induced mitochondrial dysfunction and cellular insulin resistance, demonstrating that lipoic acid is the vital player mediating mtFAS deficiency associated cellular dysfunction via modulating mitochondrial function.
Taken together, the present study revealed that Htd2 is a sensitive gene of mtFAS pathway under metabolic stress. Downregulation of HTD2 could suppress mitochondrial lipoic acid production to impair mitochondrial complex I and OGDH activity, leading to excessive superoxide production in adipocytes. Mitochondrial dysfunction associated oxidative stress further provoked insulin resistance in adipocytes, and lipoic acid, as an interesting mtFAS byproduct, could sufficiently improve mtFAS deficiency-induced adipocyte dysfunction. Collectively, the present study highlights the pivotal role of HTD2 in regulating mitochondrial function and adipocyte insulin sensitivity, providing supportive evidence for lipoic acid being an effective mitochondrial nutrient for improving insulin resistance in metabolic disorders.
Chemicals and reagents. Insulin, ATP mix were purchased from Sigma (St. Louis, MO); Antibodies against p-Akt, Akt, and β-actin were from Cell Signaling Technology (Danvers, MA); Antibody against lipoic acid was from Millipore (Temecula, CA); Antibody against HTD2 was from Abcam (Cambridge, MA); The cell culture medium, Mito-Tracker Red and MitoSOX Red were from Life Technologies (San Diego, CA). Other reagents used in this study were purchased from Sigma (St. Louis, MO). R-alpha-lipoic acid was from?
Animals. All mice were purchased from Vital River Laboratory Animal Technology Co., Ltd (Beijing, China). The mice were fed in a temperature- and light/dark cycle-controlled animal room with no limitations to food and water. All animals were maintained and used in accordance with the guidelines of the Institutional Animal Care and Use Committee of Xi'an Jiaotong University.
For the high-fat diet (HFD) induced obese and diabetic mouse models, 5-week-old male C57BL/6J mice were randomly grouped into mice fed on normal diet (control, 10% kcal fat content, Cat #D12492, Research Diets, New Brunswick, NJ) and mice fed on HFD (60% kcal fat content, Cat #D12450, Research Diets, New Brunswick, NJ). Body weight was recorded twice per week, oral glucose tolerance test and oral insulin tolerance test after 8 weeks feeding were performed to determine the diabetic condition. Mice were then recovered for one week before fasting overnight and sacrificed; For genetic obese and diabetic mice, 8-week-old male db/db mice and ob/ob mice with the C57BL/6 genetic background were fed on normal diet (Research Diets, New Brunswick, NJ) for 2 weeks before fasting overnight and sacrificed.
Cell culture. Mouse 3T3-L1 cell line was acquired from the ATCC (Manassas, VA). Cells were cultured in Dulbecco's Modified Eagle's Medium (DMEM) containing 100 U/mL penicillin, 100 μg/mL streptomycin, 10% (v/v) fetal bovine serum and 0.22% sodium bicarbonate at 37 °C in a cell incubator of 5% CO2. The cell medium was changed every two days. Transfection was performed using X-tremeGENE HP DNA Transfection Reagent (Roche, Basel, Switzerland) following manufacturers' protocol, stable knockdown cells were selected after 6 days puromycin treatment at 1 μg/ml. R-alpha-lipoic acid treatment was employed for 24 hours at the dose of 100 μM.
Adipocyte differentiation. 3T3-L1 cells were cultured into over 90% confluence for 24 h, adipocyte differentiation was initiated with 1 mM insulin, 0.25 mM dexamethasone and 0.5 mM 3-isobutyl-1- methylxanthine in DMEM supplemented with 10% FBS. After 48 h, the culture medium was replaced with DMEM supplemented with 10% fetal bovine serum and 1 mM insulin. The culture medium was changed every other day with DMEM containing 10% FBS. Cells were used at 8th day following induction of differentiation, and when at least 90% exhibited the adipocyte phenotype.
Confocal microscopy. For HTD2 localization, HeLa Cells were seeded onto coverslips which coated with poly-l-lysine and stained with Mitotacker Red for 30 min. The culture medium was then removed and the coverslips were washed three times with PBS. The cells were then fixed with 4% paraformaldehyde for 10 min, followed by 0.2%Triton-X-100 penetration for 5 min. The coverslips were blocked with bovine serum albumin (BSA) followed by incubation of anti-mouse-HTD2 antibody at room temperature for 1 h. Then the cells were incubated with Alexa Fluor 555-conjugated anti-mouse IgG antibody. After washing with PBS, the cells were stained with DAPI (Invitrogen, Carlsbad, CA). Images were visualized with a ZEISS LSM700 fluorescence microscope at 20x and 63x magnifications (Carl Zeiss, Chicago, IL). Colocalization analysis was performed on a pixel by pixel basis, colocalization efficiency was calculated using ZEISS ZEN software following standard Pearson correlation coefficient method. For Nile Red and Mitosox staining, confocal microcopy was performed following standard procedure as suggested by manufacturer, average fluorescence signal was calculated from at least 100 cells and expressed as relative intensity to the control group.
Glucose uptake. Mouse 3T3-L1 cells were washed by PBS and serum-starved with non-glucose DMEM (Gbico#11966025) for 3 h. Insulin (100 nM) was added and preincubated for 1 h, after changing into normal DMEM. glucose levels in the medium were detected using a Glucose Assay Kit (Bio Vision) according to the manufacturer's instructions. The OD values were measured at 570 nm to determine cellular glucose levels.
Intracellular GSH assay. GSH levels were analyzed with 2,3-naphthalenedicarboxyaldehyde (NDA) as previously described [28]. Briefly, 20 μl of adjusted cell samples plus 180 μl of NDA derivatization solution (50 mM Tris (pH 10), 0.5 N NaOH, and 10 mM NDA in Me2SO; v/v/v, 1.4/0.2/0.2) were added to each well of a 96-well plate. The plate was covered to avoid light and incubated at room temperature for 30 min. NDA-GSH fluorescence intensity was measured (472 excitation/528 emission) using a microplate fluorometer (Fluoroskan Ascent, Thermo Fisher Scientific Inc., Waltham, MA).
Intracellular ATP assay. 3T3-L1 cells were cultured in six-well plates. Cells were lysed using 0.5% Triton X-100 in 100 mM glycine buffer, pH 7.4. Assay to determine intracellular ATP levels was performed using an ATP bioluminescent assay kit (Sigma). ATP was consumed and light was emitted when firefly luciferase catalyzed the oxidation of D-luciferin [29].
Assay for mitochondrial complex activities. Mitochondria of 3T3-L1cells were isolated as previously described [30]. Briefly, cells were collected and resuspended in 1.0 mL of hypotonic buffer (10 mmol/L NaCl, 2.5 mmol/L MgCl2, 10 mmol/L Tris base, pH 7.5) and homogenized on ice with a glass homogenizer (Fisher Scientific, Pittsburgh, PA). Homogenates were then centrifuged at 1300 g for 5 min at 4 °C. Supernatants were centrifuged at 17,000 g for 15 min at 4 °C, and mitochondrial pellets were resuspended in 100 μL of isotonic buffer (210 mmol/L mannitol, 70 mmol/L sucrose, 5 mmol/L Tris base, 1 mmol/L EDTA·2Na, pH 7.5). Assays for reduced nicotinamide adenine dinucleotide (NADH)-ubiquinone reductase (complex I), succinate-CoQ oxidoreductase (complex II), ubiquinol cytochrome c reductase (complex III), cytochrome c oxidase (complex IV) and Mg2+-ATPase (complex V) activities were performed according to previously described methods [31].
Mitochondrial superoxide measurement. 3T3-L1 cells were cultured at a density of 1×10⁴ cells/ml in 24-well plates. The level of mitochondrial superoxide was observed by an MitoSOXTM Red Mitochondrial Superoxide Indicator (Thermo Fisher, USA). Briefly, cells were stained with 10 μM MitoSOXTM Red in serum-free medium for 10 min. After washing with PBS, the cells were visualized by laser scanning confocal microscopy (Zeiss, Jena, Germany).
Superoxide Dismutase (SOD) assay. Total SOD, GuZn-SOD, and Mn-SOD activities were analyzed using a Superoxide Dismutase (SOD) typed assay kit (Jian Cheng, Nanjing, China) following the manufacturer's instruction.
Assay for protein carbonyls. Level of protein carbonyls was determined using an OxyBlot Protein Oxidation Detection Kit (Cell Biolabs, San Diego, CA). Protein carbonyls were labeled with 2,4-dinitrophenylhydrazine and detected by western blot analysis. As a loading control, equal amounts of samples were subjected to 10% SDS-PAGE and stained with Coomassie brilliant blue. To assess mitochondrial protein carbonylation, soluble mitochondrial proteins from 3T3-L1 cells were isolated and analyzed using the above method.
Oxygen consumption rate (OCR) assay. 3T3-L1 cells were cultured on XF 24-well microplates (Seahorse Bioscience, Billerica, MA), after treating with mitochondrial inhibitors (1 μM antimycin A, 0.5 μM FCCP and 1 μM oligomycin), the OCR was detected using an extracellular flux analyzer (Seahorse Bioscience, Billerica, MA). Basal respiration represents the baseline of the oxygen consumption value before the injection of the mitochondrial inhibitors. Maximal respiration represents the maximum OCR value after injection of FCCP. Spare respiratory capacity is calculated by recording the OCR response to FCCP and dividing the value by the basal respiration. The actual value of OCR was adjusted according to the cellular protein concentration [32].
Sample preparation for lipidomic analysis. Control and Htd2 knockdown cells were prepared following previously published method [33]. Samples were placed in liquid nitrogen for 2 min, and thawed on ice for 5 min with gentle vortex. The procedure was repeated for 3 times, then the sample was centrifuged with 5,000 rpm at 4 °C for 1 min. Equal amount of supernatant was homogenized with 1 mL mixture (methanol, tert-butyl methyl ether, and internal standards). The mixture was vortexed for 10 min, added with 200 μL of water, vortexed for 1 min and centrifuged with 12,000 rpm at 4 °C for 10 min. 500 uL supernatant was concentrated after centrifugation. The powder was dissolved with 200 uL mobile phase B (10% acetonitrile, 90% isopropanol, 0.04% acetic acid, and 5 mmol/L ammonium formate), and the dissolving solution was then used for UPLC-MS/MS analysis.
Lipidomic analysis. The lipidomic profiling was performed using Ultra‐Performance Liquid Chromatography Mass Spectrometry (UPLC‐MS/MS) system (UPLC, Shim‐pack UFLC SHIMADZU CBM30A; MS, Applied Biosystems SCIEX 6500+QTRAP) at Metware Biotechnology (Wuhan, China). Mass spectrometric data were processed with Analyst 1.6.3 software (AB Sciex). Qualitative analysis was performed with built-in Metware database (MWDB) and the public database of metabolite information. The lipid metabolite structural analysis mainly referred to MassBank, KNAPSAcK, HMDB, Lipidmaps and METLIN database. First screening was based on the significant features, with p-value ≤0.05, fold change ≥2. Open source platforms KEGG, MetaboAnalyst and R software were applied for further analysis.
Real-time PCR. Total RNA was extracted using TRIzol (Invitrogen, San Diego, CA) following the manufacturer's protocol. Reverse transcription was performed using a PrimeScript RT-PCR kit (Otsu, Shiga, Japan) and was followed by semiquantitative real-time PCR using specific primers. Data were normalized to the mRNA levels of beta-actin, which was used as a housekeeping gene and were analyzed by the 2-ΔΔCT method. The final results are presented as relative level of the control. The primer sequences are presented in detail in Table S1.
Western blot. Cell samples were washed with PBS and homogenized with Western and IP lysis buffer (Beyotime, Nanjing, China). The homogenates were centrifuged at 13,000 g for 15 min at 4 °C, and the supernatants were collected for subsequent detection of protein concentrations with a BCA Protein Assay kit (Pierce, Rockford, IL, Cat # 23225). Equal aliquots of protein samples were loaded to SDS-polyacrylamide gels and transferred to nitrocellulose membranes (PerkinElmer Life Science, Boston, MA). After blocking with 5% non-fat milk, the membranes were incubated with primary antibodies followed by horseradish peroxidase-conjugated secondary antibodies. Images of the western blots were visualized with an ECL Western blotting detection kit (Pierce, Rockford, IL, Cat # 32209) and quantified by scanning densitometry.
Statistical analysis. Data are presented as the mean ± standard error of the mean (SEM) from at least three independent experiments and were analyzed using GraphPad Prism-5 software. Statistical significance was evaluated using one-way analysis of variance (ANOVA) followed by post hoc comparisons with Tukey's HSD test. Differences between two groups were analyzed using Student's t-test, and the level of significance was set at a value of P < 0.05.
The authors declare that they have no known competing financial interests or personal relationships that could have appeared to influence the work reported in this paper.
1
2
3
4
5
6
7
8
9
10
11
12
13
14
15
16
17
18
19
20
21
22
23
24
25
26
27
28
29
30
31
32
33
34
35
36
37
38
39
40
41
42
43
44
45
46
47
48
49
50
51
52
53
54
J.L., and Z.F. conceived the study, Z.F., J.Long., and J.L. designed the experiments; M.Z., Z.Z, X.W., and J.X. performed most experiments with the help of X.Z., K.C., Y.C., and W.L.; M.Z. and Z.F. analyzed the data; M.Z., Z.F., and J.L. wrote the manuscript, J.L. and Z.F. supervised the study.
This work was supported by the
 Htd2 deficiency-associated suppression of α-lipoic acid production provokes mitochondrial dysfunction and insulin resistance in adipocytes
 Facebook
 Twitter
 Linkedin
 Whatsapp
