

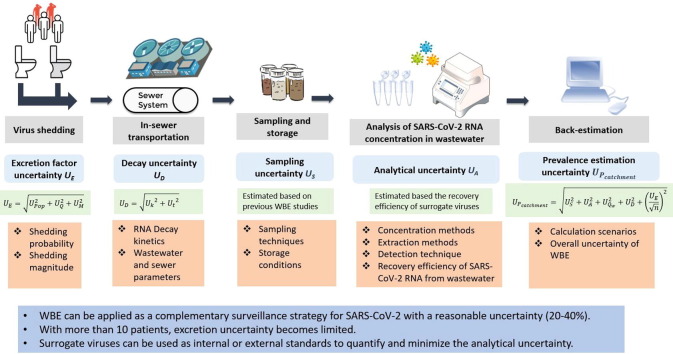
Wastewater-based epidemiology (WBE) is a promising approach for estimating population-wide COVID-19 prevalence through detection of severe acute respiratory syndrome coronavirus 2 (SARS-CoV-2) RNA in wastewater. However, various methodological challenges associated with WBE would affect the accuracy of prevalence estimation. To date, the overall uncertainty of WBE and the impact of each step on the prevalence estimation are largely unknown. This study divided the WBE approach into five steps (i.e., virus shedding; in-sewer transportation; sampling and storage; analysis of SARS-CoV-2 RNA concentration in wastewater; back-estimation) and further summarized and quantified the uncertainties associated with each step through a systematic review. Although the shedding of SARS-CoV-2 RNA varied greatly between COVID-19 positive patients, with more than 10 infected persons in the catchment area, the uncertainty caused by the excretion rate became limited for the prevalence estimation. Using a high-frequency flow-proportional sampling and estimating the prevalence through actual water usage data significantly reduced the overall uncertainties to around 20–40% (relative standard deviation, RSD). And under such a scenario, the analytical uncertainty of SARS-CoV-2 RNA in wastewater was the dominant factor. This highlights the importance of using surrogate viruses as internal or external standards during the wastewater analysis, and the need for further improvement on analytical approaches to minimize the analytical uncertainty. This study supports the application of WBE as a complementary surveillance strategy for monitoring COVID-19 prevalence and provides methodological improvements and suggestions to enhance the reliability for future studies.
The current COVID-19 global pandemic has been lasting for months since being declared as a public health emergency of International Concern by the World Health Organization (WHO). As of 1st February 2021, more than 102.9 million people were infected, and more than 2.2 million deaths were reported from 216 countries and territories in the world [1]. Current estimation of COVID-19 prevalence heavily relies on the clinical testing of individuals, which is time-consuming, and might be cost-prohibitive and region-biased especially in resource-poor regions [2]. Many people infected with severe acute respiratory syndrome coronavirus 2 (SARS-CoV-2) exhibited no known clinical symptoms [3]. Even after a patient gets isolated from a population, the ongoing circulation of SARS-CoV-2 is still likely to present, which leads to a public health threat to the population. In particular, most of the countries have surpassed the initial out-break, thus, the population-wide surveillance of the COVID-19 resurgence (the so-called second wave) is essential for applying timely control measures.
Wastewater-based epidemiology (WBE) has been developed and applied as a population-wide surveillance tool for estimating the consumption or exposure of chemicals and the prevalence of infectious diseases such as Poliovirus and Hepatitis A virus for several decades [4], [5], [6]. WBE provides an alternative surveillance approach for the population-wide disease prevalence with objective and nearly real-time estimations. It was proposed that WBE could be a sensitive tool for the early detection of COVID-19 prevalence or resurgence in the community [7]. The back-estimation of prevalence through WBE is based on the systematic collection of wastewater samples (or sludge samples) either at the inlet of wastewater treatment plants or in the sewer pumping stations, from which the concentrations of SARS-CoV-2 RNA are measured. With the concentration data and corresponding daily influent flow, correction factors (e.g. human excretion), and catchment population, the catchment-level prevalence can be estimated. To date, the existence of SARS-CoV-2 virus RNA in wastewater have been confirmed in many countries, including, Australia [8], [9], Brazil [10], China [11], [12], Czech Republic [13], Ecuador [14], France [15], [16], India [17], [18], Italy [19], [20], [21], [22], Japan [23], Spain [24], [25], the Netherlands [7], United Kingdom (UK) [26], Slovenia [27], Sweden [28], United Arab Emirates (UAE) [29], [30] and United States (USA) [31], [32], [33], [34], [35]. The successful detection of SARS-CoV-2 virus RNA through reverse transcription-quantitative polymerase chain reaction (RT-qPCR) and sequencing approaches in wastewater demonstrated the high potential of applying WBE as a tool to estimate the COVID-19 prevalence in their communities. The sampling technique, detection approach and calculation scenario for these reports are discussed in the following sections. Apart from the peer-reviewed articles included in this study, there are some pre-prints focusing on WBE for COVID-19 research, the details of which are listed on the website (https://www.covid19wbec.org/).
However, WBE back-estimates the virus prevalence from downstream wastewater concentration, hence considerable uncertainties arise due to the methodology and the complexity of various processes involved. This greatly impacts the accuracy of the prevalence estimation. The aim of this study is to discuss and quantify the uncertainty of COVD-19 prevalence estimation through WBE with wastewater samples. We further divided the estimation approach into five steps that involve: 1) virus shedding; 2) in-sewer transportation; 3) sampling and storage; 4) analysis of SARS-CoV-2 RNA concentration; 5) back-estimation. We systemically summarized the uncertainties associated with each step, estimated the overall uncertainty of the WBE approach and provided suggestions for future studies to enhance the reliability of WBE in prevalence estimation.
The electronic search for available literature was conducted on 25 January 2021, following PRISMA guidelines [36]. The goal of the review was to identify and quantify major uncertainties for SARS-CoV-2 prevalence estimation through the WBE approach from the peer-reviewed literature. Databases (i.e., Web of Science core collection, Scopus, and PubMed) were searched using the strategy and terms in Table 1 . Two search scenarios were applied for uncertainties associated with SARS-CoV-2 excretion, and in-sewer transportations and detection. A total of 685 and 487 unique papers were identified after removing duplicates using the EndNote Reference Manager software for SARS-CoV-2 excretion and detection of SARS-CoV-2 in wastewater, respectively. Titles and abstracts of the retained articles were screened and assessed for eligibility following these criteria: 1) related to SARS-CoV-2 shedding from patients or SARS-CoV-2 in wastewater; 2) a review relevant to the study or contains quantitative data relevant to the study; 3) the article is in English and is peer-reviewed. Relevant articles were further assessed by full-text read and finally, 33 and 46 articles were included in this study for SARS-CoV-2 excretion, and SARS-CoV-2 in wastewater, respectively. Details of the review process are provided in the Supplementary Information (SI).

| Target | Search terms | Number of unique papers identified through databases | Number of papers identified from references of review or other papers | Number of papers identified as relevant | Number of papers subjected to full text review | Number of papers included |
|---|---|---|---|---|---|---|
| SARS-CoV-2 excretion | “SARS-CoV-2” AND (“Stool” OR “Feces” OR “Urine”) | 685 | 0 | 57 | 54 | 33 |
| SARS-CoV-2 in wastewater | “SARS-CoV-2” AND (“Wastewater” OR “Water”) | 487 | 2 | 93 | 93 | 46 |
Monte Carlo simulation and Bayesian inference model have been applied in WBE for estimating the uncertainty of various factors including population, consumption of tobacco, alcohol, and drugs [4], [37]. This approach showed a promising outcome by a close-agreement to the estimated drug sales data globally [8], [38], [39]. The Bayesian approach is based on the idea that the posterior probability can be calculated by updating the prior probability and the final uncertainty of the unknown model parameter can be described by a probability distribution [40]. Thus, Bayesian statistics provides a more accurate approach to calculate and define the propagation of a parameter and its uncertainty derived from experimental and analytical procedures, especially for the experiment with a small scale and limited data point. Markov Chain Monte Carlo (MCMC) method is used to numerically calculate the modeling parameters, which ultimately provides the estimate for each modeling parameter with the associated credible intervals.
Through the systematic review, currently available data regarding SARS-CoV-2 RNA detection in stool and urine samples from more than 1,500 patients were summarized with all the gender, age, and pathological conditions (Table S1) and used as inputs for MCMC models using OpenBUGS (version 3.2.3), with details included as S2 and S3 in the SI. To estimate the shedding probability of SARS-CoV-2 RNA from COVID-19 infected patients in urine and stools, the number of patients with SARS-CoV-2 positive stool or urine (ri) in a total number of patients (ni) from each study (i), was modeled as a binary response variable with ‘true’ shedding probability (pi) (Eq. (1)).
The shedding magnitude (mi) of patients in each study (i) was defined as a normal distribution with mean as µ and variance as τ (Eq. (2)).
Models were built separately for the virus shedding magnitude and probability for urine and stool samples as described in SI. To provide stable distributions of results, 3000 runs were simulated for p i and mi.
To enhance the reliability of the back estimation for SARS-CoV-2 prevalence, the uncertainties in the estimation approach needs to be assessed. Gaussian error propagation was applied in this study to calculate the total uncertainty (for multiplications and divisions of independent uncertainties, the squared relative standard deviation (RSD) can be summed) [38]. Here we present a set of equations (Table 2 ) to consequently assess the uncertainties associated with each step in a transparent way. Two potential ways for estimating the COVID-19 prevalence through the WBE approach were included: 1) estimating the prevalence using the wastewater treatment plant (WWTP) influent flow rate and inhabitant population of the catchment area (Eq. B4.1, Table 2); 2) estimating the prevalence using the average water consumption data among the inhabitant population (Eq. B4.2, Table 2).
| WBE processes | No. | WBE equations | Uncertainty equations |
|---|---|---|---|
| Viral load in sewers | B1 | ||
| Decay of SARS-CoV-2 | B2 | ||
| Excretion | B3 | ||
| Back-estimation | B4.1 | ||
| B4.2 |
Note: Eq. B1: Lsewer: the load of SARS-CoV-2 RNA detected in a sewer; Ct is the concentration of SARS-CoV-2 RNA detected in wastewater samples; F is the total wastewater flow during the sampling period; ULsewer, US and UF are the uncertainty of Lsewer, sampling and flow measurement, respectively; UA is the uncertainty of wastewater analysis, including concentration, RNA extraction, and detection. Eq. B2: D is the decay ratio of SARS-CoV-2 RNA in wastewater; C0 is the concentration of SARS-CoV-2 RNA excreted in wastewater before transportation in sewers; t is the traveling time of SARS-CoV-2 genome in wastewater, and k is the decay rate constant; UD, Uk, and Ut are the uncertainties of D, k and t. Detailed explanation was included in Section 3.2. Eq. (B3): E is the excretion rate of SARS-CoV-2 RNA from infected people; Pop is the shedding probability of SARS-CoV-2 RNA in stools or urine of infected person; Qs is the shedding mass quantity of stools or urine among the population; M is the virus shedding magnitude in stools or urine from infected person; UP, UQs, and UM are the uncertainty of shedding probability, quantity and magnitude, respectively. Eq. B4.1: Pcatchment is the COVID-19 prevalence in the catchment area, P is the population size in the catchment area; UPcatchment is the uncertainty of Pcatchment. Eq. B4.2: Qw is the daily amount of water usage, and UQw is its uncertainty.
The excretion factor is commonly used in the WBE approach to convert the mass load of a certain biomarker in wastewater to the amount of substance consumed by the people [4]. Similarly, for the SARS-CoV-2 prevalence estimation, the excretion factor of SARS-CoV-2 RNA from an infected person is critical for the prevalence estimation. Currently, the excretion factors used in WBE for SARS-CoV-2 prevalence are calculated from the average or median values of SARS-CoV-2 RNA concentrations in stool samples [23]. However, to date, SARS-CoV-2 RNA has been detected in various clinical samples from infection-positive patients including feces, urine, blood, saliva, serum, sputum, etc. [41], [42], [43]. Moreover, the RNA shedding concentration, the probability of virus shedding among patients and the virus shedding sources are largely impacted by physiological factors such as gender, age and pathological conditions [44]. Considering the quantity and frequency, feces and urine are regarded as the main source of virus shedding in the WBE approach.
It is evident that the ratio of positive samples among patients in different studies varied greatly from 0 to 100% and 0 to 50% in stool and urine samples, respectively (Table S1). The presence of SARS-CoV-2 in stool and urine samples could be related to the swallowing of respiratory secretions from the upper respiratory tract or residues of infected antigen-presenting immune cells, or, more likely, due to virus replication in gastrointestinal epithelial cells or tubular epithelium [45], [46], [47]. Furthermore, the shedding magnitude detected in urine and stool samples varied from 10-104 copies/mL in urine samples and 10–108 copies/g in stool samples (Table S1). Monte-Carlo simulation was further applied to define the distribution and confidence interval for the shedding probability of patients in urine and stools (Fig. S2, Table 3 ). The mean probability of shedding in stools (0.545) was about 20 times higher than that of urines (0.0263), suggesting a negligible contribution of urine to the SARS-CoV-2 excretion (Table 3). Although the decay of SARS-CoV-2 by 99–99.9% could occur within several hours to 5 days in stool samples, considering the short time of toilet use, the decay of SARS-CoV-2 RNA concentrations during toilet use is regarded as negligible [48]. Thus, the distribution of shedding magnitude in stools was further defined (Fig. S2, Table 3). From pooled stool samples, the mean shedding magnitude was about 104.52 copies/g with a 95% confident interval (CI) ranged from 104.26 to 104.78 copies/g. Thereby the excretion rate E can be calculated based on the shedding probability, the magnitude of SARS-CoV-2 RNA in the stools of an infected person, and average daily stool amount for the population (Eq. (B3) in Table 2). For the daily average stool amount, 10% RSD is commonly applied based on previous observations [49]. Thus, UE was further determined as 20% using Eq. (B3) in Table 2.
| Urine shedding probability | Stool shedding probability | Stool shedding magnitude (log10 copies/g) | |
|---|---|---|---|
| Mean | 0.026 | 0.545 | 4.523 |
| Standard deviation | 0.030 | 0.093 | 0.133 |
| Median | 0.018 | 0.544 | 4.523 |
| 95% CI | 6.3 × 10⁻⁴- 0.10 | 0.37–0.73 | 4.26–4.78 |
In addition, prolonged fecal shedding has been observed in patients for up to four to ten weeks after the first symptom onset and even after the patients' respiratory samples tested negative for SARS-CoV-2 RNA [50], [51], [52], [53], [54], [55]. Due to the limited clinical reports and difficulty in identifying the exact date of infection and cure, the prolonged shedding was not assessed in this study, which requires further investigations.
After shedding, SARS-CoV-2 virus in stools or urines enters the sewer system. With a broad range of pollutants and abundant microbial presence, sewers function as ‘microbial reactors’ where substances are transformed and degraded based on their chemical and biological reactivity [56]. Generally, for most viruses, the water matrix plays an important role in their inactivation and decay [57]. Without active human cells as hosts in wastewater, the infectivity of SARS-CoV-2 was reported to be reduced by 90% in several minutes to 2.1 days in wastewater environment, however, its RNA was significantly more persistent, reaching 3–33 days [58]. The relatively persistent RNA allows the detection of SARS-CoV-2 RNA from wastewater for estimating COVID-19 prevalence. As WBE estimates the prevalence of COVID-19 using downstream wastewater samples, which is transported through a sewer system to the sampling location, the accuracy of WBE is impacted by the uncertainty of SARS-CoV-2 RNA persistence in sewers.
The decay of SARS-CoV-2 RNA have been investigated in bulk wastewater at 20 °C [58], and 4–37 °C [59]. Currently available studies suggest that SARS-CoV-2 RNA decay in wastewater follows the first-order decay with the time as Eq. (3).
A higher decay rate of SARS-CoV-2 RNA has been observed in raw wastewater than autoclaved wastewater at 4–25 °C [64]. This could be related to the inactivation of RNases, and physicochemical characteristics change due to autoclaving or the presence and activity of microorganisms in raw wastewater [64], [65]. Furthermore, faster decay of SARS-CoV-2 RNA also occurred in raw wastewater than tap water, suggesting the potential impact of suspended solids, organic matters, chemical and biological compounds in wastewater [58], [64]. In addition, a physicochemical model was established to simulate the dynamic adsorption of SARS-CoV-2 RNA on suspended solids and also detectable SARS-CoV-2 concentrations in wastewater with several parameters (i.e., inlet flowrate, total suspended solids concentration, dissolved oxygen (DO), 5-days Biochemical Oxygen Demand (BOD5), Chemical Oxygen Demand (COD), UV absorbance at 254 nm (UV254), Dissolved Organic Carbon (DOC), ammonium, nitrates, total organic nitrogen, total phosphorus and ortho-phosphates [66]. Through fitting the model with the data from real sewers and the COVID-19 prevalence in the catchment area, UV254/DOC and DO showed the highest correlation with the variation of viral concentration in wastewater, suggesting the strong impact on viral adsorption and decay in sewage caused by the presence of humic-like substances combined with DO. This could be potentially related to the oxidation of SARS-CoV-2 and increased metabolic activity of bacteria and bacterial enzymes [66]. To date, the detailed mechanism behind these above observations remains unclear and needs further investigations. Overall, these studies suggest that the first-order decay (Eq. (3)) can adequately describe the decay of SARS-CoV-2 RNA in wastewater, and the decay rate k was significantly affected by wastewater temperature. Variations of k could also be attributed to a variety of factors, including enzymatic activity, and the presence of solvents, detergents, DO concentration, grease, oil, fats and organic matter in wastewater, although there has yet to be specific evidence to definitively attribute these factors to virus decay [36].
Apart from the k value, the traveling time t also impacts the decay of SARS-CoV-2 RNA in wastewater (Eq. (3)). Most of the COVID-19 prevalence estimations were based on the SARS-CoV-2 concentration in the influent of WWTP, where wastewater traveling time occurred between shedding and sample collection. The traveling time of SARS-CoV-2 RNA in sewers, or more specifically hydraulic retention time (HRT) of sewers was found strongly correlated to the catchment size of a WWTP, ranging from several minutes to 6–10 h in small and large scale WWTPs, respectively [67]. Previously, extensive modeling and investigations for drug consumption estimations using WBE revealed that for most of the WWTP, the HRT within a catchment area follows a normal distribution with 4% RSD [67]. With currently available knowledge of SARS-CoV-2 in wastewater as discussed above sections, the uncertainty caused by decay (UD) was thus calculated as Eq. (4).
Since SARS-CoV-2 was announced as a worldwide pandemic spread by WHO, researchers have been using WBE to detect and estimate the presence and community spread of this virus using water samples collected from mostly influent of WWTPs. Apart from WWTP samples, detection of the virus RNA in commercial passenger aircraft and cruise ship wastewater has also been reported [9]. Among these studies, sampling locations, sample collection techniques and preservation strategies vary greatly, which is another source of uncertainty for the prevalence estimation using WBE. Thus, the sampling location, technique and preservation conditions were systematically reviewed and summarized in Table 4 .
| Area/Country a | Sampling location | Sampling technique | Sample type | Results b | Preservation temperature, period | Reference |
|---|---|---|---|---|---|---|
| Queensland, Australia | WWTP and Pumping station | Grab and composite sampling (24 h) | Influent | 2/9 | 4 °C, n.m. c | [8] |
| Queensland, Australia | WWTP | Grab and composite sampling (24 h) | Influent | 19/63 | 4 °C, n.m. | [75] |
| Australia | Commercial passenger aircraft | Grab sampling | Treated aircraft wastewater | 1/3 | 4 °C, within 6–24 h | [9] |
| Cruise ship | Raw wastewater | 1/1 | ||||
| Effluent of membrane bioreactor | 1/1 | |||||
| Niteroi, Brazil | WWTP | Composite sampling (10 h) | Influent | 0/2 | n.m. | [10] |
| Hospital | 3/8 | |||||
| Sewer | 2/2 | |||||
| Zhejiang, China | Hospital | n.m. | Influent of pre-processing disinfection pool in hospital | 3/3 | n.m. | [11] |
| Effluent of hospital wastewater from pre-processing disinfection pool | 1/1 | |||||
| Final effluent of hospital wastewater | 0/1 | |||||
| Wuhan, China | Hospital | n.m. | Influent of septic tank | 7/9 | 4 °C, processed immediately | [12] |
| Effluent of septic tank | 0/4 | |||||
| Czech Republic | WWTP | Composite sampling (24 h) | Influent | 13/112 | 5 ± 3 °C, within 48 h | [13] |
| Quito, Ecuador | River | Grab sampling | River water receiving raw wastewater | 3/3 | 4 °C, less than 3 h | [14] |
| Montpellier, France | WWTP | Composite sampling (24 h) | Influent | 3/12 | −20 °C, n.m. | [16] |
| Thessaloniki, Greece | WWTP | Composite sampling (24 h) | Influent | 16/29 | 4 °C, within 24 h | [66] |
| Gujarat, India | WWTP | Composite sampling (3 days) | Influent | 6/6 | 4 °C, within 20 days | [17] |
| Effluent | 0/6 | |||||
| Gujarat, India | WWTP | Composite sampling (3 days) | Influent | 4/6 | 4 °C, within 20 days | [18] |
| Effluent | 0/6 | |||||
| A upflow anaerobic sludge blanket (UASB) | Influent of UASB | 3/6 | ||||
| Effluent of UASB | 3/6 | |||||
| Jaipur, India | WWTP | Grab sampling | Influent | 6/17 | n.m. | [76] |
| Effluent | 0/8 | |||||
| Stockholm, Sweden | WWTP | n.m. | Influent | 4/6 | 4 °C, within 24 h | [21] |
| North of Italy | 1/4 | Delivered to the laboratory on dry ice, stored at − 20 °C, n.m. | ||||
| Italy | WWTP | Composite sampling (24 h) | Influent | 6/12 | −20 °C, n.m. | [20] |
| Italy | WWTP | Grab sampling | Influent | 4/8 | Under refrigeration, n.m. | [19] |
| Effluent | 0/4 | |||||
| River | River water | 3/4 | ||||
| Italy | WWTP | Composite sampling (24 h) | Influent | 26/40 | −20 °C, n.m. | [22] |
| Italy | WWTP and pumping stations | Grab sampling | Influent | 4/9 | 4 °C, processed immediately and also after 24 h | [77] |
| Effluent | 2/2 | |||||
| Japan | WWTP | Grab sampling | Influent | 0/5 | On ice, processed within 6 h of collection | [23] |
| Effluent from secondary treatment | 1/5 | |||||
| River | River water | 0/3 | ||||
| Tokyo, Japan | WWTP | Grab sampling | Influent | 4/12 | −20 °C, n.m. | [78] |
| Japan | WWTP | Grab sampling | Influent | 21/45 | Four samples, −20 °C, n.m. 1 samples, on ice, within three days | [79] |
| Japan | Manholes and WWTP | Grab sampling | Supernatant of raw wastewater | 6/32 | −20 °C, within 10 days. | [73] |
| Solids of raw wastewater | 18/32 | |||||
| Slovenia | Pumping station of a hospital | Composite sampling (24 h) | Raw wastewater | 10/15 | −70 °C, n.m. | [27] |
| Sweden | WWTP | Composite sampling (24 h) | Influent | 18/21 | −20 °C, n.m. | [28] |
| Effluent | 13/21 | |||||
| Sewer sampling station | 0.5L wastewater per day for 4 days | Raw wastewater | 15/20 | |||
| Valencia, Spain | WWTP | Grab sampling | Influent | 12/12 | 4 °C, n.m. | [24] |
| Murcia, Spain | WWTP | Grab sampling | Influent | 35/42 | 4 °C, less than 24 h | [25] |
| Effluent from secondary treatment | 2/18 | |||||
| Effluent from tertiary treatment | 0/12 | |||||
| The Netherlands | WWTP | Composite sampling (24 h) | Influent | 10/21 | 4 °C, processed on the day of sampling | [7] |
| South East England, UK | WWTP | Composite sampling (24 h) | Influent | 3/5 | −80 °C, n.m. | [26] |
| Louisiana, USA | WWTP | Composite sampling (24 h) | Influent | 1/3 | −80 °C, within 6 h | [31] |
| Effluent from secondary treatment | 0/3 | |||||
| Effluent | 0/3 | |||||
| Grab sampling | Influent | 1/4 | ||||
| Effluent from secondary treatment | 0/1 | |||||
| Effluent | 0/1 | |||||
| Virginia, USA | WWTP | Composite sampling (24 h) and grab sampling | Influent | 98/198 | On ice, within 6 h | [32] |
| Massachusetts, USA | WWTP | Composite sampling (24 h) | Influent | 10/14 | 4 °C, n.m. | [35] |
| Montana, USA | WWTP | Grab and composite sampling (24 h) | Influent | 7/7 | 4 °C, n.m. | [33] |
| New York, USA | WWTP | Composite sampling (24 h) | Influent | 5/9 | −20 °C, n.m. | [34] |
| Nevada, USA | WWTP | Grab and composite sampling (24 h) | Influent | 46/46 | n.m. | [80] |
| Secondary effluent | 0/4 | |||||
| Finished effluent | 0/2 | |||||
| Natural lakes | Grab sampling | Lake water | 0/22 | |||
| Drinking water | Grab sampling | Finished drinking water from a treatment plant | 0/33 | |||
| California, USA | WWTP | Composite sampling (24 h) | Influent | 1/12 | −20 °C, n.m. | [72] |
| Composite sampling (24 h) and grab sampling | Settled solids samples from primary settler | 9/17 | −80 °C, n.m. | |||
| Seattle, USA | WWTP | Grab sampling | Primary composite sludge | 12/17 | 4 °C, within one week | [74] |
| Influent | 22/45 | |||||
| Dubai, UAE | Pumping stations and WWTP | Grab sampling | Influent | 829/2900 | n.m. | [29] |
| Commercial aircraft | Raw wastewater | 27/198 | ||||
| UAE | Pumping stations, manholes | Grab samples | Raw wastewater | 85% | Preserved on ice, and transported to a laboratory, n.m. | [30] |
| WWTP | Composite sampling (24 h) | Influent | ||||
| Effluent | 0% |
Note:
a: Sorted based on alphabetical order of countries.
b: Results are presented as number of SARS-CoV-2 RNA positive samples/number of total samples tested.
c: n.m. not mentioned.
Among the current 38 publications, 34 of them have detected SARS-CoV-2 RNA in the influent of WWTP and 8 in sewers, including manholes, drains and pumping stations (Table 4). The influent of WWTP generally provides the prevalence estimation of the whole catchment area while the samples from sewers support the surveillance to the sub-catchment area, in particular, the pandemic hotspots such as hospitals, isolation facilities and specific surveillance sites of cities or suburban areas. In low-income countries, sewer systems are not well-developed, especially in Africa [68]. One recent study found the presence of SARS-CoV-2 RNA in a river in Quito (Ecuador), which was contaminated by the untreated wastewater from households in the city [14]. Although this study revealed a higher number of active cases estimated from WBE than the official clinically confirmed data, it suggests the feasibility of using river water for estimating the COVID-19 prevalence in low-sanitation countries. The relative higher cases could be attributed to underdiagnose, numerous asymptomatic cases and the uncertainty in virus shedding as discussed in Section 2.1. Besides, SARS-CoV-2 RNA has been detected successfully in wastewater collected from inbound commercial passenger aircraft [9], [29] and one cruise ship docked in Australia [9]. This extends the feasibility of using WBE as a powerful tool to monitor viruses in transportation facilities, however, its application might be limited as the wastewater can only be collected after landed or docked.
The main uncertainty of the sampling location is being mindful of the presence of any hospitals in the WWTP catchment area or hotspots interested. In some countries like the US, UK, and Australia, policies suggest on-site treatment at hospitals to remove any toxic and hazardous substances, drugs, bacteria and viruses before being discharged into sewers to ensure the protection of the environment [69]. Such on-site treatment has a high chance of removing the target virus RNA from wastewater before it enters the public sewers. Studies from the US, Spain, India, Italy and China also reported a complete removal of SARS-CoV-2 in wastewater after treatment (Table 4). Though some studies claimed that SARS-CoV-2 RNA may still present in wastewater even after treatment due to the potential protection of stools to the SARS-CoV-2 RNA embedded, its concentration reduced greatly compared to that of raw wastewater [11], [12]. Hence, employing the WBE tool in such cases without considering the removal of viruses in wastewater from hospital outlets may lead to the underestimation of disease prevalence in a community.
In addition, recent studies have also reported the presence of SARS-CoV-2 RNA in wastewater solids and sludge samples collected at various locations of the WWTP [70], [71], [72]. Higher concentrations of SARS-CoV-2 RNA were detected in sludge samples [71], sediments of wastewater [73] and wastewater solids collected from the primary settler [72], [74], comparing to wastewater influent samples. This relatively higher concentration of SARS-CoV-2 RNA in sludge is likely caused by the adsorption of the virus to solids as discussed in Section 3.2 and relatively longer sludge retention time (6–12 h) in the primary clarifier. Although sludge and solids could potentially be another suitable source for COIVD-19 prevalence estimation, wastewater is different from solids or sludge samples in terms of property, extraction, detection, and calculation approaches. The persistence of SARS-CoV-2 RNA in sludge or solids during in-sewer transportation and treatment in WWTP, as well as the uncertainties in estimating the COVID-19 prevalence using sludge or solids, are largely unknown and require future investigations.
Apart from sampling locations, flow inside the sewers has relatively large uncertainties due to seasonal or diurnal variations in water usage patterns among the population and any rainfall event [81], [82]. Currently, there are two major types of wastewater sampling techniques adopted in WBE studies for SARS-CoV-2, namely time- or flow-proportional composite sampling and grab sampling. The composite sampling technique uses (auto)samplers installed at the inlet of WWTPs or similar sample locations, for a frequent sampling over 24 h (or longer while required). This mode is more preferable due to the inherent variability in virus shedding and diurnal sewer flows [83] and provides a well-mixed sample representing the average wastewater characteristics during the period of collection. However, this sampling scheme depends much on the availability of equipment, sampling location, and in most cases professional personnel to operate [84]. The grab sampling consists of a single discrete sample collected over a period not exceeding 15 min at a sampling point. The type of samples will only be representative of the wastewater conditions at the exact time of collection. This technique is utilized in many sampling points where equipment is limited, e.g. in less developed areas. Since defecation in the general population is most frequent in the early morning compared with other times, SARS-CoV-2 RNA in wastewater may be more enriched than wastewater generated at other times in the day [85]. Thus, sampling at peak fecal loading times is recommended for grab sampling, and peak fecal loading times needs to be identified before sampling [86].
Statistically, a composite sample can eliminate peaks and inconsistencies and is more reliable compared with grab samples. While grab sampling technique can be more convenient and is beneficial for components requiring immediate analysis due to instability, i.e., bacteriological and pathogenic samples. To date, the exploration for sampling techniques in the detection of SARS-CoV-2 RNA is limited. One recent study observed a ~10-fold increase in composite sampling in comparison to corresponding grab sampling of primary effluent samples, presumably highlighting diurnal variability in the SARS-CoV-2 signal [80]. However, the grab sampling in this study corresponded with the minimum influent flow for the WWTP, which shall be further investigated for the diurnal variation and uncertainty caused by sampling techniques. In contrast, the sampling uncertainties of grab or composite sampling have been well studied for drugs and personal care products (PPCPs) estimation using WBE. Grab sampling contributed the highest uncertainty (around 30% averagely) while a continuous flow-proportional sampling method showed <10% sampling uncertainties [87]. Thus, for COVID-19 prevalence estimation using WBE, negligence of the sampling technique would greatly increase the uncertainty of the accuracy. In addition, the effluent samples from most of WWTPs showed negative results with SARS-CoV-2, but some effluent samples from primary and secondary treatment (Table 4). This potentially causes health and safety concerns regarding the effluent discharge and work environment for site workers in WWTPs. The removal of viruses at WWTPs can be due to the adsorption to suspended solids, protein and nucleic acid denaturation, retention or size exclusion (if membrane process is involved), disinfection that can damage the capsid protein or nucleic acids [88]. As WBE primarily focuses on raw wastewater collected from WWTPs or sewers, the persistence of SARS-CoV-2 in response to different treatment strategies is thus not expanded herein.
Furthermore, sewer systems can be classified into two types, i.e., combined sewers and separate sewers. The combined sewer system receives both stormwater and wastewater in one system whereas separate sewers accommodate them in two pipelines separately. Due to the stormwater and inflow, significant dilution of SARS-CoV-2 concentration in combined sewers has been observed [89]. Furthermore, incidents of sewage overflows in communities serviced by combined sewer systems due to heavy rainfalls frequently appear in summers [90]. The overflow not only causes a huge dilution for SARS-CoV-2 concentrations, but also correlated with a higher SARS-CoV-2 virus transmission in communities [90]. Thus, for accurate prevalence estimation, sampling in dry weather is recommended.
After obtaining wastewater samples at different sampling points, most of the studies transported the samples without any preservation chemicals inside and kept on ice or at 4 °C and processed within 48 h (Table 4). Recent studies indicate the SARS-CoV-2 was rather stable at 4 °C for at least 14 days [64], [91]. The persistence of SARS-CoV-2 RNA after 24 h storage at 4 °C was demonstrated with the same positive ratio before and after storage though the actual concentration of RNA detected was not reported [77]. A storage time within 48–72 h is highly recommended to avoid the decay of SARS-CoV-2 RNA in wastewater [86]. Some studies stored the composite sample immediately at −20 °C or −80 °C until further analysis (Table 4). A recent review stated that freezing and de-freezing the sample could potentially lead to degradation of the genetic material of SARS-CoV-2 by the RNases in wastewater [92]. The potential decay of SARS-CoV-2 in wastewater during storage at −20 °C or −80 °C and the impact of freezing and de-freezing require further investigation and may potentially lead to under-estimation of COVID-19 prevalence. To date, the impact of light on the decay of SARS-CoV-2 RNA in wastewater has not been investigated. However, high susceptibility of SARS-CoV-2 to sunlight [93], in particular, UV irradiation [94], was observed with a complete inactivation in several minutes. Thus, avoiding the contact with wastewater during sampling and storage is highly recommended.
For the detection of SARS-CoV-2 in the wastewater, a virus concentration and extraction step are usually employed prior to the subsequent detection, as the virus concentration in wastewater samples is fairly low. Electronegative membranes (EMB)-based filtration, ultrafiltration, polyethylene glycol (PEG) precipitation, ultracentrifugation, and aluminum hydroxide adsorption-precipitation have been applied for SARS-CoV-2 concentration in wastewater [7], [8], [9], [23], [25], [95]. Although the effectiveness of these concentration methods has been confirmed with successful detection of SARS-CoV-2 in wastewater, the recovery efficiencies largely varied between different concentration and extraction methods. Ahmed, et al. [96] compared 7 virus concentration methods for the RT-qPCR based recovery by using MHV from raw wastewater and found that the EMB-based filtration method with the addition of MgCl2 had the highest recovery (65.7 ± 23.8%) of MHV. Similarly, a recent study used feline calicivirus (FCV) to investigate the efficiency of 11 concentration methods including EMB filtration followed by PEG precipitation, PEG precipitation, aluminum hydroxide adsorption-precipitation, ultrafiltration, skim milk flocculation and EMB filtration followed by ultrafiltration. Great variations between different methods were observed and PEG precipitation and aluminum hydroxide adsorption-precipitation were found as the most efficient methods as detailed in Table 5 [95]. The necessity of a secondary concentration step was investigated with ultrafiltration, PEG and ultracentrifugation in combination with hollow fiber ultrafiltration as a pretreatment for wastewater. The recovery efficiency decreased by about 50% for combined concentration methods in comparison to the single concentration method, suggesting that a secondary concentration may be detrimental for the detection and quantification of SARS-CoV-2 RNA [80]. Thus, the recovery efficiency with a single concentration step (i.e., ultrafiltration, PEG, and ultracentrifugation) of this study was included in Table 5. With currently available studies, great variations have been commonly observed for the same concentration methods, among different studies. For instance, with EMB, about 60% recovery of MHV was observed in one study [96], but less than 10% of MS2 was recovered in another [78]. Similarly, an interlaboratory assessment evaluated the reproducibility, sensitivity, and efficiency of 36 standard operating procedures (SOPs) including eight different concentration methods using the same wastewater sample, however, the concentration methods didn’t show a clear, systematic impact on the recovery efficiency [97]. This could be related to various factors, such as extraction methods, detection approaches, wastewater property and or the surrogate viruses used, which are further discussed in the following sections. With current limited understanding, the application and limitations of each concentration methods remain unclear, and require further investigations. Furthermore, although seven order of magnitude range of recovery efficiencies were observed with these 36 SOPs, 80% of the recovery-corrected results fell within a band of ± 1.15log10 copies/L with high reproducibility, suggesting that a variety of methods could produce reproducible results with inclusion of surrogate viruses to quantify the recovery efficiency [97].
| Concentration | Extraction methods | Detection method | Virus | Recovery efficiency | Uncertainty (RSD) | Reference | |
|---|---|---|---|---|---|---|---|
| Methods | Consumables | ||||||
| Adsorption-elution method | Electronegative membrane (EMB) | RNeasy PowerMicrobiome Kit with glass beads replaced with garnet beads | RT-qPCR | MHV | 60.5 ± 22.2% | 0.37 | [96] |
| EMB/Acidification of sample to pH 4 | MHV | 26.7 ± 15.3% | 0.57 | ||||
| EMB/Addition of MgCl2 | MHV | 65.7 ± 23.8% | 0.36 | ||||
| EMB | NucliSENS easyMag (bioMerieux, Inc., Durham, NC, USA) | RT-ddPCR | BCoV | 4.8 ± 2.8% | 0.58 | [32] | |
| BRSV | 6.6 ± 3.8% | 0.58 | |||||
| QIAamp Viral RNA Mini Kit | RT-qPCR | MS2 | 1.0%-9.5% | N/Aa | [78] | ||
| φ6 | 1.6%-21.0% | ||||||
| Acid guanidinium thiocyanate–phenol–chloroform extraction using TRIzol reagent (TRIzol) | MS2 | 0.3% − 4.6% | |||||
| φ6 | 0.5% − 2.8% | ||||||
| Ultrafiltration | Amicon® Ultra-15 (30 K) Centrifugal Filter Devices | RNeasy PowerMicrobiome Kit with glass beads replaced with garnet beads | RT-qPCR | MHV | 56.0 ± 32.3% | 0.58 | [96] |
| Centricon Plus-70 centrifugal filter with a molecular weight cut-off of 10 kDa | MHV | 28.0 ± 9.10% | 0.33 | ||||
| RNeasy PowerMicrobiome Kit | RT-qPCR | F-specific RNA phages | 73 ± 50% | 0.68 | [7] | ||
| Centricon Plus-70 centrifugal device with a molecular weight cutoff of 30 kDa | QIAamp Viral RNA Mini Kit | RT-qPCR | MS2 | 16.5% − 27.6% | N/A | [78] | |
| φ6 | 6.4% − 35.8% | ||||||
| TRIzol | MS2 | 5.2% − 8.4% | |||||
| φ6 | 13.8% − 30% | ||||||
| Hollow fiber ultrafiltration | Purelink Viral RNA/DNA Mini Kit | RT-qPCR | BCoV | 54 ± 11% | 0.20 | [80] | |
| PMMoV | 4.0 ± 2.2% | 0.55 | |||||
| Centricon Plus-70, 30 kDa or 100 kDa | BCoV | 55 ± 38% | 0.69 | ||||
| PMMoV | 1.3 ± 0.16% | 0.12 | |||||
| 30 kDa AMICON® Ultra-15 Centrifugal Filters. | QIAamp® Viral RNA Mini Kit | RT-qPCR | SARS-CoV-2 | 51.4 ± 12.6%, 38.8 ± 11.6% b | 0.25, 0.30b | [27] | |
| 10 kDA AMICON® Ultra-15 Centrifugal Filters. | 48.6 ± 41.6%, 49.5 ± 25.0% b | 0.86, 0.51b | |||||
| Precipitation | Aluminum hydroxide adsorption-precipitation | NucleoSpin RNA virus kit | RT-qPCR | PEDV | 11 ± 3.5% | 0.32 | [25] |
| MgV | 11 ± 2.1% | 0.19 | |||||
| 2.56%–18.78% | N/A | [24] | |||||
| Direct-zol RNA Miniprep (Zymo Research) Kit | RT-qPCR | FCV | 45.0 ± 19.2% | 0.43 | [95] | ||
| Maxwell® RSC 48 Extraction System (Promega) | SARS-CoV-2 | 7.4 ± 7.9% −9.4 ± 14.7% | 1.07–1.56 | ||||
| Maxwell® RSC Instrument | RT-qPCR | SARS-CoV-2 | 30.2 ± 17.7% | 0.59 | [98] | ||
| MgV | 6.8 ± 4.8% | 0.71 | |||||
| PEG/NaCl | NucliSENS® miniMAG® semi-automated extraction system | RT-qPCR | HCoV-229E | 2.04 ± 0.7% | 0.34 | [22] | |
| RNeasy PowerMicrobiome Kit with glass beads replaced with garnet beads | RT-qPCR | MHV | 44.0 ± 27.7% | 0.63 | [96] | ||
| Direct-zol RNA Miniprep (Zymo Research) Kit | RT-qPCR | FCV | 62.2 ± 30.8% | 0.50 | [95] | ||
| Maxwell® RSC 48 Extraction System (Promega) | SARS-CoV-2 | 38.8 ± 46.5% | 1.19 | ||||
| QIAamp Viral RNA Mini Kit | RT-qPCR | MS2 | 27.0% − 51.4% | N/A | [78] | ||
| φ6 | 1.4% − 3.0% | ||||||
| TRIzol | MS2 | 27.5% − 77.6% | |||||
| φ6 | 29.8% − 49.8% | ||||||
| Purelink Viral RNA/DNA Mini Kit | RT-qPCR | BCoV | 11 ± 8.4% | 0.76 | [80] | ||
| PMMoV | 0.28 ± 0.10% | 0.36 | |||||
| Nucleospin RNA virus Kit | RT-qPCR | SARS-CoV-2 | 52.8 ± 18.2% | 0.34 | [98] | ||
| MgV | 11.1 ± 4.9% | 0.44 | |||||
| Beef extract solution | NucliSENS® miniMAG® system | RT-qPCR | TGEV | 35.5 ± 13.0% | 0.37 | [13] | |
| Ultracentrifugation | 0.25 N glycine buffer (pH 9.5) | RNeasy PowerMicrobiome Kit with glass beads replaced with garnet beads | RT-qPCR analyses | MHV | 33.5 ± 12.1% | 0.36 | [96] |
| Direct Extraction | Without concentration | NucliSENS® easyMag® system | RT-ddPCR | BCoV | 59% ± 14% | 0.24 | [32] |
| BRSV | 75% ± 13% | 0.17 | |||||
| InnovaPrep (with centrifugation) | 0.05 μm PS Hollow Fiber concentrating pipette tip on the InnovaPrep Concentrating Pipette Select | BCoV | 5.5% ±2.1% | 0.38 | |||
| BRSV | 7.6% ±3.0% | 0.39 | |||||
Note:
a: Not applicable.
b: Defined using two RT-qPCR assay targets.
PEG: Polyethylene glycol; MHV, Mouse hepatitis virus; BCoV, Bovine coronavirus; BRSV, Bovine respiratory syncytial virus; MS2, Bacteriophage MS2; φ6: Pseudomonas phage φ6; PEDV: Porcine epidemic diarrhea virus; MgV: Mengovirus; HCoV-229E, human coronavirus 229E; FCV, Feline calicivirus; PMMoV, Pepper mild mottle virus; TGEV, Transmissible gastroenteritis coronavirus; RT-ddPCR: Reverse transcription droplet digital PCR.
Aside from concentration methods, the extraction methods also affect the recovery efficiency. Using Pseudomonas phage φ6 (φ6) as a surrogate, the recovery efficiency was investigated with three concentration methods (i.e., EMB, PEG, and ultrafiltration) in combination with two extraction methods (i.e., QIAamp Viral RNA Mini Kit, and acid guanidinium thiocyanate–phenol–chloroform extraction with TRIzol reagent (TRIzol)). Among the tested combinations, PEG + TRIzol provided the highest φ6 recovery ratio of 29.8%–49.8%, while PEG + QIAamp provided only 1.4%-3.0% of φ6 recovery [78]. From currently available reports, even for the best recovery method, a considerable loss of virus RNA is commonly observed (Table 5). Furthermore, the wastewater matrix also played an important role on the recovery efficiency. Using wastewater collected from three different WWTPs, the recovery efficiency of a certain concentration and or extraction method differed [78]. This highlights the importance of adopting a suitable concentration and extraction method, and also the use of surrogate viruses as a control to minimize the recovery loss and calibrate the concentration of SARS-CoV-2 in wastewater.
Subsequently, after concentration and extraction, the detection of SARS-CoV-2 RNA is performed. Current detection techniques primarily rely on RT-qPCR or (nested) RT-PCR. With the recent development of detection methods, 13 available primer-probe sets, targeting regions and cycling parameters were further summarized (Table S2). Among these primer and probe sets, inconsistent performance between different primer-probe sets was commonly observed [27], [75], [77], [80], [98]. For instance, using the same wastewater samples, a higher positive ratio was detected with CDC N1 assays (19/63) than in E_Sarbeco assays (2/63) [75]. In addition, false positive results have been observed in some studies with E_Sarbeco assays, where amplifications were observed with a negative control [80]. This could be related to the detection limit of the assay, the linearity of the standard curve and the potential existence of PCR inhibitors. Wastewater is a complex matrix, components of which, such as calcium ions, urea, ethanol, sodium dodecyl sulfate and some proteins are normally regarded as PCR inhibitors [99]. These inhibitors are likely to impact the PCR efficiency of SARS-CoV-2 RNA. Moreover, considering that some the SARS-CoV-2 positive samples in these studies resulted in low detected concentrations (<1 copy/reaction), it is also possible that the target gene was occasionally absent in the reaction mixture, resulting in inconsistent results from different PCR assays [79].
Droplet digital PCR (ddPCR) has a higher precision compared to qPCR, as it can achieve absolute quantification without using a standard curve. A higher sensitivity of RT-ddPCR for SARS-CoV-2 detection in wastewater samples was reported [72], [100]. Similarly, slightly higher sensitivity was observed with RT-ddPCR than that of RT-qPCR in a study with 21 wastewater samples from airlines and a cruise ship [9]. Thus, RT-ddPCR could potentially increase the detection accuracy of SARS-CoV-2 in wastewater samples. In addition, molecular methods like digital PCR, sequencing, loop-mediated isothermal amplification (LAMP) and nucleic acid sequence-based amplification (NASBA) are also widely used in the study of environmental virology but have not been investigated for the detection of SARS-CoV-2 in wastewater samples. Their advantages and disadvantages have been summarized in Table S3, which could be further applied for SARS-CoV-2 detection in wastewater samples to improve the accuracy.
To quantify the recovery and detection efficiency of SARS-CoV-2 in wastewater, low-pathogenic surrogate viruses have been spiked into wastewater samples as external controls for the whole process including concentration, extraction, and detection. Bovine coronavirus (BCoV), MHV, the porcine epidemic diarrhea virus (PEDV), the mengovirus (MgV), bovine respiratory syncytial virus (BRSV), human coronavirus 229E (HCoV-229E), and transmissible gastroenteritis coronavirus (TGEV), were commonly applied as models of SARS-CoV-2 (Table 5). Variations in the recovery ratio with different surrogates using the same or similar concentration, RNA extraction and detection methods were observed in currently available studies (Table 5). For instance, using QIAamp Viral RNA Mini Kit, the recovery ratio reached 27.0%-51.4% for Bacteriophage MS2 (MS2) but only 1.4%-3.0% for φ6 [78]. Moreover, the actual detection efficiency of SARS-CoV-2 may differ from surrogate viruses. In studies using clinical positive or gamma-irradiated SARS-CoV-2 samples, different recovery and detection efficiencies were observed between SARS-CoV-2 and surrogate viruses (i.e., FCV and MgV) (Table 5). This might be related to the dissimilarity of surrogate viruses to SARS-CoV-2 in structure and morphology. To date, a detailed comparison between different surrogate viruses and SARS-CoV-2 in the concentration, extraction and detection from wastewater is still lacking, which requires further investigations. Apart from spiking surrogate virus, pepper mild mottle virus (PMMoV), an indicator for fecal contamination inherently in wastewater has also been applied to reduce the uncertainties, owing to its global distribution and its presence without substantial seasonal fluctuations [21], [35]. A recent study found that using PMMoV alone was sufficient to inform of relative recovery and to normalize between samples without adding external surrogate viruses in wastewater [21]. In addition, for WBE studies using sludge or solids from wastewater, PMMoV also showed superior performance in reducing background noise that possibly associated with the collection and transport of the samples along with the RNA concentration, extraction, and detection steps, over gut resident HF183 Bacteroides and 18S rRNA that is expressed in human cells [70]. CrAssphage, a human-specific gut-associated bacteriophage, was thought to be potentially a more specific biomarker due to its high detection sensitivity and abundance in wastewater [101]. Although the application of crAssphage as an internal standard for SARS-CoV-2 have not been reported in peer-reviewed articles, a recent preprint observed a close correlation between ratio of SARS-CoV-2 concentration to crAssphage concentration and cumulative COVID-19 cases [102]. This suggests the potential of using crAssphage as an internal standard, although further investigations are still in need.
With currently available data, depending on different processes, the recovery efficiency of these surrogate viruses varied from 1% to-75% for different wastewater samples (Table 5). Variations within batches using the same concentration and extraction methods have been observed with PMMoV, which is one of the major sources of uncertainty [35]. The RSD of each concentration and extraction process was thereby calculated based on the results in Table 5. Due to the highest recovery efficiency and lowest RSD, direct Extraction using NucliSENS® easyMag® system with RT-ddPCR as described by Gonzalez, et al. [32] and EMB/Addition of MgCl2 RNeasy PowerMicrobiome Kit with RT-qPCR as described by Ahmed, et al. [96] are highly recommended (bolded in Table 5). For the systematic evaluation in this study, the UA was determined as 17–36% assuming the best recovery procedures were taken by the WBE.
The load of SARS-CoV-2 RNA detected in wastewater are calculated by the concentration detected in wastewater (Ct) and total flow during the sampling period (F) and its uncertainties are affected by three factors, namely sampling uncertainty (US), analytical uncertainty (UA) and flow uncertainty (UF) (Eq. (B1)). The flow rate is usually obtained through the designed capability of WWTPs (factory settings) where a conservative estimation of 20% uncertainty is commonly used [38]. Although to date the concentration variations of SARS-CoV-2 RNA detected in wastewater due to sampling remain unclear, the impact of sampling schemes on PPCPs concentrations in wastewater has been investigated thoroughly. It was demonstrated that a high-frequency flow-proportional composite sampling led to the least uncertainty (0% RSD) while grab sampling resulted in the highest US (averagely 30% RSD) for 30 PPCPs [87]. Conservatively for US, an RSD of 5% and 30% were adapted to represent the high-frequency, flow-proportional composite sampling and grab sampling, respectively in this study (Table 6 ). As discussed in the above sections, UE, UD, and UA were estimated as 20%, 5% to 11%, 17% to 36% RSD, respectively. It has to be noted that this value of UE is for one single user. The combined uncertainty for the excretion rate of n users decreases by (Eqs. (B4.1) and (B4.2)).
| Back estimation | Sampling | Us | UA | UF | UQw | UD | UE (n = 1) | UP | UPcatchment, n = 1 | UPcatchment, n = 10 | UPcatchment, n = 100 | UPcatchment, n = 1000 |
|---|---|---|---|---|---|---|---|---|---|---|---|---|
| T4.1 | composite | 5 | 17–36 | 20 | – | 5–11 | 20 | 16 | 37–50 | 32–46 | 32–46 | 32–46 |
| grab | 30 | 17–36 | 20 | – | 5–11 | 20 | 16 | 44–56 | 40–52 | 40–52 | 40–52 | |
| T4.2 | composite | 5 | 17–36 | – | 10 | 5–11 | 20 | – | 29–44 | 22–40 | 21–40 | 21–40 |
| grab | 30 | 17–36 | – | 10 | 5–11 | 20 | – | 41–53 | 37–50 | 36–49 | 36–49 | |
Other uncertainty factors involved in the prevalence estimation (Pcatchment) are the population size in the catchment area (P) and the daily amount of water usage (Qw). The population size (P) is normally estimated from census data or designed capacities of WWTP. Although using human biomarkers can improve the estimation accuracy, a value of 16% uncertainty remains, which is likely attributed to the variation from the resident population due to visitors, tourists, festivals or other events [38]. For daily water usage, 10% RSD was applied based on previous observations [49].
The total uncertainty of Pcatchment with 1, 10, 100 and 1000 infected persons estimated by WBE using composite and grab samples was calculated in Table 6. The impact of UE on the total uncertainty of prevalence estimation became limited with over 10 infected persons in the catchment area. It is clear that back-estimation using Eq. B4.2 showed a lower uncertainty on the COVID-19 prevalence estimation (p = 0.08). This is mainly attributed to the relatively higher UF and UP in comparison to UQw. In terms of the sampling scheme, grab sampling increased the overall uncertainty of prevalence estimation although not significant (p = 0.19–0.22) with 1–1000 infected persons. Calculating the COVID-19 prevalence using Eq. 4.2 with a high frequency flow-proportional composite sampling achieved the lowest uncertainty at around 20–40% RSD with over 10 infected persons in the catchment area. Therefore, this sampling and calculation scheme is recommended to improve the estimation accuracy. With a high frequency flow-proportional composite sampling, the analytical uncertainty UA dominated the uncertainty of UPcatchment. As discussed in section 3.4, this is mainly attributed to the detection efficiency of SARS-CoV-2 RNA in wastewater samples. With further improvement on the detection approaches, the overall uncertainty of SARS-CoV-2 prevalence estimation can be reduced.
In this study, the decay of SARS-CoV-2 RNA in sewers was estimated based on the results in bulk wastewater [64] due to the lack of such an investigation in sewers. However, sewers are more complicated systems with various operational conditions than bulk wastewater. Considering the operational conditions, sewers can be further divided into rising mains and gravity flow regions [103]. Gravity sewers are operated with partially filled wastewater, where a combination of aerobic and anaerobic conditions exist, while rising main sewers are fully filled with wastewater under anaerobic conditions. Due to the difference in operation conditions, the dissolved oxygen in wastewater, area-to-volume ratios (A/V), sewer biofilm community, hydraulics, sediment type also changes significantly [4]. In WBE studies for chemicals, the degradation ratios of biomarkers are generally different in gravity and rising main sewers [40], [104], [105], [106]. Asides from that, a higher A/V would also result in higher degradation of some biomarkers such as cocaine and amphetamine, likely due to the increased contact of the biomarker to sewer biofilms [67]. Currently, the impact of sewer biofilm and other sewer conditions on the persistence of SARS-CoV-2 is largely unknown. An enhanced decay of SARS-CoV-2 was observed with a higher level of dissolved oxygen, which was likely caused by the higher metabolic activity of bacteria and bacterial enzymes [66]. This preliminary result suggests that the persistence of SARS-CoV-2 in rising main and gravity sewers are likely different. Emerging pollutants including new products or chemicals without regulatory status have been commonly detected in wastewater, but their effects on the environment and human health are unknown [107]. During the COVID-19 pandemic some chemicals listed as emerging pollutants such as hydroxychloroquine and chloroquine were used to treat infected patients, which would eventually end up in sewer systems [108]. The concentration changes of emerging pollutants during the pandemic and their impacts on the persistence of SARS-CoV-2 in wastewater have not been reported yet, which requires future research. In addition, a previous study using WBE for chemicals found that the location and distribution of drug consumers, catchment size, and dynamic water usage pattern are important factors for HRT and could cause considerable uncertainties for estimating the prevalence of drug consumers using WBE [67]. Therefore, the impact of sewer conditions, catchment size, and unknown location of infected persons on the prevalence estimation of SARS-CoV-2 need further investigations. Additionally, during the 2003 SARS outbreak, high concentrations of SARS were detected in sewer aerosols of an apartment, which resulted in a rapid spread of the disease [109]. To date, the potential occurrence of SARS-CoV-2 in sewer aerosols have been confirmed through dynamic modeling [110] and one such occasion was reported in China [111]. The occurrence and persistence of SARS-CoV-2 in sewer gas needs further research.
In addition, the impact of sampling schemes on the SARS-CoV-2 concentration in wastewater is still unknown. This study adapted previous knowledge of drugs and PPCPs to assume the sampling uncertainty, which was not the exact value but can largely represent the difference. Future investigations are encouraged and could improve the understanding of the uncertainties while using WBE for COVID-19 prevalence estimation.
The paper systematically reviewed and quantified the uncertainties associated with the excretion, in-sewer decay, sampling and detection of SARS-CoV-2 RNA in municipal wastewater while using WBE approaches for COVID-19 prevalence estimation. It leads to the following conclusions:
•WBE can be applied as a complementary surveillance strategy for SARS-CoV-2 with reasonable uncertainty (20–40%). Further work to refine the WBE procedure can improve estimates so they would have greater utility for public health authorities.
•Although the excretion probability and magnitude vary greatly among patients in clinical studies, its contribution to the overall uncertainty of prevalence estimation became limited when COVID-19 cases reach as high as 10–100 in the sampled catchment.
•The persistence of SARS-CoV-2 RNA in sewers is largely unknown due to the impacts of wastewater properties, and sewer conditions. The in-sewer decay or removal is a major contributor to the overall uncertainty of prevalence estimation.
•Using a proper surrogate virus as an internal or external standard to quantify the RNA loss detection process is highly recommended to minimize analytical uncertainty and its contribution to the overall uncertainty for the prevalence estimation using WBE.
The authors declare that they have no known competing financial interests or personal relationships that could have appeared to influence the work reported in this paper.
1
2
3
4
5
6
7
8
9
10
11
12
13
14
15
16
17
18
19
20
21
22
23
24
25
26
27
28
29
30
31
32
33
34
35
36
37
38
39
40
41
42
43
44
45
46
47
48
49
50
51
52
53
54
55
56
57
58
59
60
61
62
63
64
65
66
67
68
69
70
71
72
73
74
75
76
77
78
79
80
81
82
83
84
85
86
87
88
89
90
91
92
93
94
95
96
97
98
99
100
101
102
103
104
105
106
107
108
109
110
111
This research was supported by the ARC Discovery project (DP190100385). Shuxin Zhang receives the support from a University of Wollongong PhD scholarship. Guangming Jiang was the recipient of an Australian Research Council DECRA Fellowship (DE170100694).
 Uncertainties in estimating SARS-CoV-2 prevalence by wastewater-based epidemiology
 Facebook
 Twitter
 Linkedin
 Whatsapp
