
Dependable, specific and rapid diagnostic methods for severe acute respiratory syndrome β-coronavirus (SARS-CoV-2) detection are needed to promote public health interventions for coronavirus disease 2019 (COVID-19). Herein, we have established an entropy-driven amplified electrochemiluminescence (ECL) strategy to detect the RNA-dependent RNA polymerase (RdRp) gene of SARS-CoV-2 known as RdRp-COVID which as the target for SARS-CoV-2 plays an essential role in the diagnosis of COVID-19. For the construction of the sensors, DNA tetrahedron (DT) is modified on the surface of the electrode to furnish robust and programmable scaffolds materials, upon which target DNA-participated entropy-driven amplified reaction is efficiently conducted to link the Ru (bpy)32+ modified S3 to the linear ssDNA at the vertex of the tetrahedron and eventually present an “ECL on” state. The rigid tetrahedral structure of the DT probe enhances the ECL intensity and avoids the cross-reactivity between single-stranded DNA, thus increasing the sensitivity of the assays. The enzyme-free entropy-driven reaction prevents the use of expensive enzyme reagents and facilitates the realization of large-scale screening of SARS-CoV-2 patients. Our DT-based ECL sensor has demonstrated significant specificity and high sensitivity for SARS-CoV-2 with a limit of detection (LOD) down to 2.67 fM. Additionally, our operational method has achieved the detection of RdRp-COVID in human serum samples, which supplies a reliable and feasible sensing platform for the clinical bioanalysis.

In late 2019, the novel coronavirus disease broke and spread rapidly in more than 200 countries, which had caused a lot of deaths. According to the results of high-throughput sequencing, the International Committee on Taxonomy of Viruses (ICTV) announced the novel coronavirus disease termed COVID-19 was caused by severe acute respiratory syndrome coronavirus 2 (SARS-CoV-2) (Feng et al., 2020; Moitra et al., 2020; Seo et al., 2020). In the last 20 years, there have been two pandemics caused by coronaviruses: severe acute respiratory syndrome (SARS) in 2003 and Middle East Respiratory Syndrome (MERS) in 2012, both of which cumulatively caused approximately 10,000 cases, with a mortality rate was 10% for SARS and 37% for MERS (Qiu et al., 2020). Regarding the third pandemic, COVID-19 exhibited higher virulence and infectivity than previous SARS and MERS. Therefore, it is the foremost priority to achieve reliable laboratory identification of SARS-CoV-2 in a fast and accurate way for the epidemic prevention and control of the ravages of COVID-19 (Chung et al., 2020; Costa dos Santos Junior et al., 2020). Then a series of viral genomes were released by the Global Initiative on Sharing All Influenza Data (GISAID) on the internet, showing that the sequences of this novel coronavirus were closely linked to the agent of SARS outbreak in 2003 (Udugama et al., 2020; Xue et al., 2020). In such acute respiratory infections, samples of respiratory secretions are usually collected for causative virus detection employing reverse transcription polymerase chain reaction (RT-PCR), which has been widely utilized in the molecular assays of target genes (Cazares et al., 2020). The target genes of the COVID-19 selected from all over the world are routinely similar that includes the RNA-dependent RNA polymerase (RdRp) sequence, nucleocapsid protein gene (N) sequence, envelope protein (E) gene, spike (S) gene and the open reading frame 1 ab (ORF1ab) sequence (Ahidjo et al., 2020; Brownlee 2020). The choice of targets for SARS-CoV-2 detection affects the specificity of the analytical assay. For example, the E gene is a highly conserved among all β coronavirus and the N gene readily cross-reacts with other coronaviruses (Lu et al., 2020). The S gene also plays an important role in distinguishing SARS-CoV-2 from other coronaviruses due to its significant sequence differentiation (Zhou et al., 2020). In distinguishing SARS-CoV-2 from SARS-CoV, the RdRp gene located within the ORF1ab region demonstrates extremely high analytical sensitivity (Tian et al., 2020). During the early diagnosis, RdRp gene as the target for SARS-CoV-2 of recent disease (RdRp-COVID) exhibits a more decent performance in the evaluation of the effect compared with other targets including E and N genes (Corman et al., 2020). Therefore, the rapid detection of the RdRp-COVID has a non-negligible role and significance for the early diagnosis of SARS-CoV-2.
It has no doubt that RT-PCR is of great significance in viral RNA assays, demonstrating strong analytical capabilities by replicating a large number of specific DNA fragments in a short period (Shen et al., 2011; Shi et al., 2015). In recent researches on SARS-CoV-2 detection, RT-PCR is of great significance in the early laboratory diagnosis of the novel coronavirus and the prevention of the epidemic. For example, Corman et al. obtained E gene and RdRp gene assays by real-time RT-PCR with 5.2 and 3.8 copies per reaction, respectively (Corman et al., 2020). However, RT-PCR has such a large number of false-negative results that the failure rate is relatively high, which may be due to contamination of nucleic acid (Xie et al., 2020). And in clinical applications, a single RT-PCR result is not entirely reliable, which is not generally conducive to thoroughly achieving screening of the infected people. For instance, in the early stage of the pandemic of the COVID-19, the single RT-PCR assay results of the infection cases confirmed by chest computed tomography (CT) showed that nearly less than half (30–50%) of the people were positive, therefore, only by repeated swab tests can we improve the missed detection rate of the RT-PCR method and realize early discovery of the infection cases (Xie et al., 2020). Besides, traditional RT-PCR methods are time-consuming and labour-intensive, which is not advantageous to large-scale and comprehensive tests of a large number of suspected infections. Chest CT and virus culture obviously could not meet the requirements of rapid-response and real-time detection (Cheng et al., 2020). As a result, other approaches to achieve expeditious investigation of the infected cases are available and pressing.
The functional nucleic acid is considered to be a kind of complex structured biomolecule building material, and it plays an essential role in bio-catalysis, drug loading and medical diagnosis (Liu et al., 2009; Meng et al., 2014). Recently, nanotechnology-based functional DNA has developed rapidly, bringing lots of opportunities to traditional nucleic acid-based detection strategies for targets (Jasinski et al., 2017; Shi et al., 2010). Specifically, DNA nanoparticle with distinct structure and fixed size is widely utilized in biological and medical applications for its splendid biocompatibility and programmability (Vijayanathan et al., 2002). The DNA tetrahedron (DT) as a classical nanoparticle possesses a 3-dimensional (3D) geometric structure with four points and six single strands, which has attracted significant attention for its simple synthesis and structural rigidity (Sadowski et al., 2014; Zhang et al., 2012). Significantly, the DT has already been used as a scaffold on the electrode's surface for the constitution of electrochemistry and electrochemiluminescence biosensor (Miao et al., 2015). Generally, thiolated single- or double-stranded DNA probes as not containing secondary structures, are easily connected to the surface of the gold-containing materials on the electrode. However, their density and uprightness are not easy to control, which facilitates the uneven distribution and the hybridization reactions between the modified DNA probes on the electrode, which dramatically lessens the hybridization efficiency of the recognition elements and the targets (Lin et al., 2014; Lu et al., 2012; Wen et al., 2011). However, recent studies indicate that DT as the capture probe can conquer these disadvantages and become the mainstream scaffold material on the electrodes. For instance, Chen et al. constructed an electrochemical biosensor for DNA methylation detection with DT nanostructure (Chen et al., 2019). Feng et al. fabricated an ECL biosensor with DNA tetrahedral scaffolds, using DNA cyclic amplification (Feng et al., 2017a).
Additionally, DNA engineering based on Watson−Crick complementary base-pairing theory has the characteristics of molecular programmability and designability (Kabza et al., 2017; Zhang et al., 2014). The entropy-driven method based on DNA hybridization is also widely used to construct enzyme-free signal cascade amplification circuits and sensors (Zhang et al., 2007). The driving force of the reaction comes from the tendency to spontaneously become chaotic without the involvement of other high-cost enzymes and antibodies (Zhang et al., 2018). The entropy-driven amplification strategy also has the merits of not requiring additional nucleases to catalyze or cleave the DNA nucleotides, which has wide application in scaling up artificially cascaded circuits and biochemical analysis. For instance, Zhang et al. illustrated the implementation of a nicking-assisted recycling method in entropy-powdered DNA circuits (Zhang et al., 2019). Ma et al. fabricated an entropy-driven DNA nanodevice to achieve signal amplification and used it for cancer cell detection with excellent specificity (Ma et al., 2019). Kim et al. constructed a DNA nanomachine that transduced protein signal to nucleic acid output to achieve real-time analysis and fast-response detection in whole blood and plasma (Kim et al., 2016).
In the determination of the target genes of 2019 novel coronavirus (2019-nCoV), the RdRp-based assays showed high sensitivity and excellent specificity for SARS-CoV-2 (Qiu et al., 2020; Yu et al., 2020). Herein, an entropy-driven DT-coupled ECL biosensor was fabricated for the detection of the highly characteristic RdRp-COVID gene. The DT could enhance the sensor's stability, improving the efficiency of entropy-driven reactions on the electrode. As the entropy-driven reaction proceeded, the Ru (bpy)3 2+ modified S3 was anchored to the linear ssDNA capture probe at the vertice of the DT, prompting an ECL “signal on” state, which in contrast with the initial ECL “signal off”, indicating the significant changes after experiencing the target DNA-catalyzed entropy-driven detection process compared with the process without the presence of target DNA. All in all, due to the DT-constructed scaffold of the ECL platform and the target DNA-participated entropy-driven signal amplification strategy, this method provided a trustworthy approach to realize the detection of RdRp genes of the 2019-nCoV.
Relevant oligonucleotides synthesized and purified by high-performance liquid chromatography (HPLC) method, were obtained from Genscript Biotechnology Co., Ltd (Nanjing, China). The sequences in our strategy were depicted in Table S1. N-(3-(Dimethylamino)propyl)-N-ethyl-carbodiimide hydrochloride (EDC), N-hydroxysuccinimide (NHS) are available in Aladdin Biochemical Technology Co. Ltd. (Shanghai, China). Tris (4,4′-dicarboxylic acid-2,2′-bipyridyl) ruthenium (II) dicbloride (Ru (dcbpy)3 2+) was purchased from Suna Tech Inc. (Suzhou, China). Tris (2-carboxyethyl) phosphine hydrochloride (TCEP), ethylene diamine tetraacetic acid (EDTA), phosphate buffered saline (PBS, pH 7.4), tris-borate-EDTA (TBE) buffer and other analytical grade chemicals, unless otherwise specified, were obtained from Sangon Biotech Co. Ltd. (Shanghai). The real human serum was collected from healthy volunteer in Jiang Yuan Hospital Affiliated to Jiangsu Institute of Nuclear Medicine and the recovery experiments for RdRp-COVID detection were performed in strict accordance with medical ethics approval procedures and with the consent of the subjects. Ultrapure water (with resistance 5 MΩ) used in our experiments was got from the Milli-Q purification system (Branstead).
Electrochemical impedance spectroscopy (EIS) experiments were carried by CHI 660 E (Chenhua Apparatus Co., Ltd, Shanghai) with 5 mV amplitude and 0.1–10 kHz frequency, and the whole tests were performed in 0.1 M PBS solution (pH = 7.4) containing 5 mM [Fe(CN)6]3−/4−. ECL tests collected by the three-electrode system containing gold working electrode (GE), Ag/AgCl reference electrode and platinum counter electrode were performed by ECL-6B, which was offered by the State Key Laboratory of Analytical Chemistry for Life Science, Nanjing University. UV–vis spectra were obtained by Spectra Max M5e (Molecular Devices Co. Ltd, U.S.A). Corresponding atomic force microscope (AFM) data were Dimension ICON (Bruker).
The DT was prepared by a DNA strand with 98 nucleotides (T1) and three 59-nucleotides thiolated DNA strands (T2, T3, T4). Firstly, T2, T3, T4 were separately dispersed in PBS buffer solution containing 10 mM TCEP and incubated for 30 min at 25 °C. Next, T1, T2, T3, and T4 with the final concentration (1 μM) were put together and then oscillated slightly. Afterwards, the mixture was heated to 90–100 °C for 6 min, and slowly cooled to 4 °C to obtain the sturdy DT. Therefore, the DT was fabricated successfully.
The conjugation of Ru (bpy)3 2+ and S3 DNA was completed by the EDC/NHS method described below. Firstly, 10 mg of Ru (bpy)3 2+ was dissolved in 10 mL of MES buffer (pH = 5) without amine and carboxylate. Then carboxyl activation process of Ru (bpy)3 2+ was achieved by adding 30 mg of EDC for 10 min under magnetic stirring. Next, the 6 mg of NHS was added to the activated solution and continued to react for 50 min. Lastly, 20 μL amine-modified S3 DNA solution (100 μM) was added to the sample and continue to react for 8 h with unceasing stirring at 25 °C. After centrifugation with 12,000 rpm and three washes with PBS buffer to remove excess reagents, the sample was stored 4 °C for further use.
Nondenaturing polyacrylamide gel electrophoresis (PAGE, 15%) was conducted in 1 × TBE buffer (pH = 7.4) which contained 89 mM Tris-Boric and 2 mM EDTA. The PAGE was carried under the constant potential of 105 V for 2 h. After the PAGE run, the gel was stained by ethidium bromide (EB) and then photographed by ChemiDoc MP (Bio-Rad) system using UV light.
The fabrication of the ECL biosensor was illustrated as followed. Initially, the gold electrode (GE, Φ = 3 mm) was polished by 0.05-μm-sized alumina powder. Then, the GE was immersed in a piranha solution for 30 min, in which the ratio of 98% H2SO4 to 30% H2O2 was 4 to 1. Afterwards, GE was ultrasonically cleaned with purified water and ethanol alternately. After the electrode being cleaned, the electrode was then activated with 0.1 M H2SO4, scanning by a continuous circulating voltage of −0.8–0.8 V at a rate of 0.1 V s−1. When the cyclic voltammetry (CV) characteristic peak signals were steady, the electrode had completed the activation process. After being washed with purified water, the electrode was dried with N2 and used for further modifications.
The modification of DT on the electrode was illustrated as followed. Briefly, the GE was dipped in 20 μL hybridized solution of DT (1 μM) and put into 4 °C overnight to shape DT-modified GE (abbreviation as DT/GE) by forming Au–S covalent bond. After that, the modified GE was incubated into the mixture of S1 and S2 (20 μL) with each concentration of 1.5 μM at 25 °C for 2 h. Many previous fascinating works have used BSA or MCH to prevent the adsorption of the non-specific probe (Feng et al., 2017b). However, in our work, a tetrahedral structure could reduce non-specific adsorption on the electrode surface, making the construction of the biosensor more time saving as well as easy to operate. Therefore, for each assembly process of the biosensor, the modified electrode only needed to be rinsed with PBS buffer (0.1 M, pH = 7.4) to remove the non-specific adsorbed DNA probe (Chen et al., 2019; Pei et al., 2010).
The modified electrode was dipped into a series of different concentrations of target DNA solution and continue to react for 30 min. Subsequently, the modified electrode was incubated with Ru (bpy)3 2+ modified S3 DNA solution (1.5 μM) at 25 °C for 45 min. Similarly, after each step of the entropy-driven reaction, the biosensor was washed by PBS solution (0.1 M, pH 7.4). Finally, the modified electrode was tested in PBS buffer solution (0.1 M, pH 7.4) containing 20 mM co-reactant triethylamine (TEA) scanned with a voltage of 0–1.3 V.
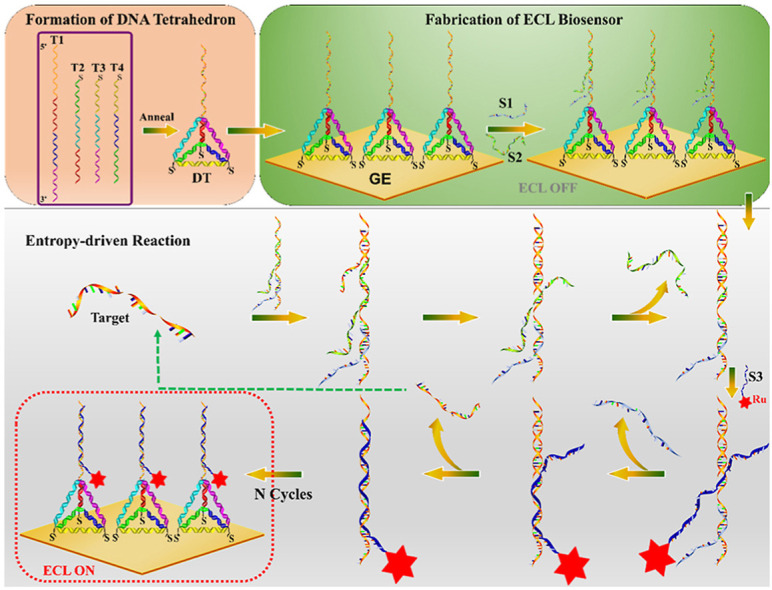
The ECL biosensor using the DT as a skeleton, on which performing an enzyme-free entropy-driven reaction was designed to detect the RdRp-COVID genes (Scheme 1 ). The ECL biosensor was modified on the Au electrode, whereas the traditional linear ssDNA or the double-stranded DNA (dsDNA) were replaced with the DT probe, which could enhance the stability of the biosensor, leading to an excellent anti-interference sensing platform in our strategy. After the capture DNA probe at the vertex of the DT hybridizing with the S1 and S2, a three-stranded substrate complex was formed, and then further proceeded the entropy-driven reaction. The reaction here, based on branch migration and driven by entropy, possessed two characteristics: the acceleration of the target DNA and the re-release of the DNA probe for achieving multiple conversions, which here called “toehold turnover”. The target DNA was first bound to the single-stranded toehold domain on the substrate for forming a four-stranded intermediate I1, which was further quickly rearranged to constitute the intermediate I2 by branch migration. At this time, the binding between S2 and the capture probe was too weak to keep S2 attached, therefore, intermediate I2 spontaneously dissociated and released S2. The newly exposed domain of the capture probe facilitated the binding of Ru (bpy)3 2+ modified S3 DNA, resulting in the intermediate I3, which then immediately rearranged to expel S1. Similarly, another rearrangement occurred so that only by the few base pairings between the target DNA and the capture DNA probe, which spontaneously dissociated to leave the final product and regenerate the target DNA that then continued to react with the substrate, resulting in large amounts of final products and obtaining an extremely high ECL signal on the electrode. For that, the reaction required no enzymes with no covalent bond alternation, differing from the traditional bioorganic catalysis, the entropy-driven reactions offered amplifying methods, which were simple, fast, modular, combinable and sturdy.
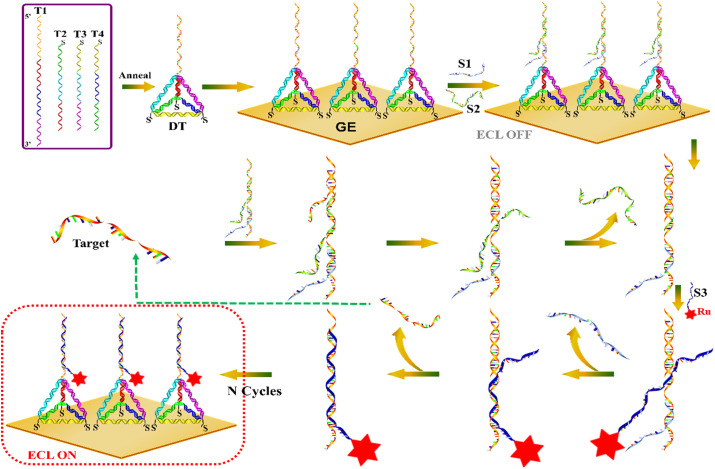
The DT-based entropy-driven ECL biosensor for the detection of RdRp-COVID DNA sequence. For a clearer description, the entropy-driven part does not show the tetrahedral structure. In the actual reaction system, this entropy-driven reaction takes place on the tetrahedral fixed electrode surface.
The formation of DT was confirmed by PAGE, as depicted in Fig. 1 A. We arranged the different combinations of the four ssDNA to certify that with the one-by-one assembly of DT (lane 1–4), the migration speed gradually slowed down, and the successfully synthesized DT (lane 4) migrated the slowest among all combinations. The fabrication of the DT with a three-dimensional structure was further verified by AFM by dropping the solution on a freshly cleaved silicon wafer. The 3D image (Fig. 1B) and the two-dimensional image (Fig. 1C) illustrated the morphology of the successfully fabricated DT with good dispersion. The height profiles of the DT (Fig. 1D) presented the height distribution with a narrow range from 5.03 nm to 6.83 nm. The dynamic lighting scattering also showed the diameter of DT (Figure S1) was approximately 6.33 nm and exhibited a narrower size range. The height of some DT was slightly higher than the theoretical side length (5.78 nm) and height of the DT (4.72 nm), the theoretical values of which were calculated based on a length of 0.34 nm per base pair. This may be due to the bases of the capture DNA on the tetrahedral vertices. Besides, as shown in Figure S3, we statistically characterized the heights of randomly selected DT points in Fig. 1C and Figure S2A, where the median (5.79 nm) and mean (5.88 nm) values were around the predicted theoretical values. From the measured data in Fig. 1D and Figure S2 we could calculate the height of DT as 5.88 ± 0.794 nm. All the measured data and the statistical results are in general agreement with the theoretical values, implying that our synthesized DT meet the expectations.
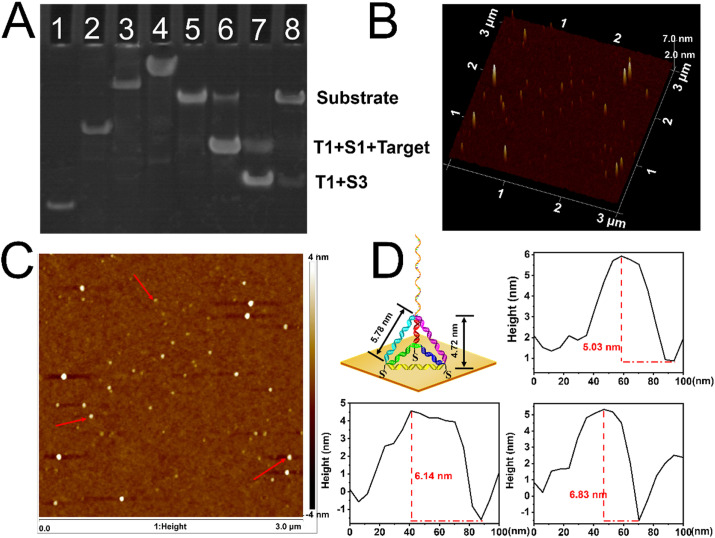
(A) PAGE characterization (20% native gel) for the DT and the entropy-driven reaction. Lane 1: T1; Lane 2: T1 + T2; Lane 3: T1 + T2 + T3; Lane 4: the DT; Lane 5: substrate (T1 + S1 + S2); Lane 6: substrate + target (30 min); Lane 7: substrate + target + S3 (30 min); Lane 8: substrate + S3 (120 min). The DNA complexes in lane 2–5 were annealed before the PAGE and the experiments were carried out in a TBE buffer containing 12.5 mM MgCl2 at a constant temperature of 25 °C. (B) 3D AFM image of the DT. (C) The 2D visual image of the DT. (D) The theoretical parameters of the programmed DT and the practical height of the DT are marked by the arrow in Fig. 1C.
PAGE was also used for the verification of the entropy-driven reaction by lanes 5–8 in Fig. 1A. As T1, S1 and S2 incubated together, a bright stripe was showed in lane 5, indicating the formation of high-purity substrate DNA. When target DNA was reacted with the substrate DNA in the absence of S3 (Lane 6), S2 was repelled and the T1/S1/target complex appeared, the migration speed of which was slightly faster than the substrate DNA. The immobilization reaction of S3 uncatalyzed by the target DNA exhibited a prolonged rate (lane 8), indicating the substrate DNA was largely unreacted. However, at the presence of the target, the reaction proceeds fast to a near-completed degree (lane7), which was verified by the evidence that the substrate DNA was almost depleted, with the vast majority converted to T1/T3. Therefore, we could infer the involvement of target DNA led the reaction degree to a high level and successfully triggered the entropy-driven cascade process.
The fabrication of the ECL biosensor was verified by the EIS, and ECL response as depicted in Fig. 2 A and Fig. 2B, respectively. According to the traditionally modified Randles circuit (the inset of Fig. 2A), which was used to simulate the electrochemical process. The resistance of charge transfer (R ct), indicating the changes of electrode surface resistance and the dynamics of electron transfer in the redox process, was directly reflected by the Nyquist diagram's high-frequency semicircle. As shown in the EIS spectra, the GE exhibited a lower current resistance. When the DT was modified on the electrode, the resistance was significantly increased, for that the DNA probe had enhanced the R ct. As the DNA substrate was formed on the DT, the resistance continuously increased due to that the non-conductive layer inhibited the charge transfer. Similarly, the binding of target DNA heightened the resistance as well. However, with the modification of Ru (bpy)3 2+ modified S3, the resistance of the biosensor reduced, for the discharge of non-conductive materials, such as S1, S2 and target DNA.
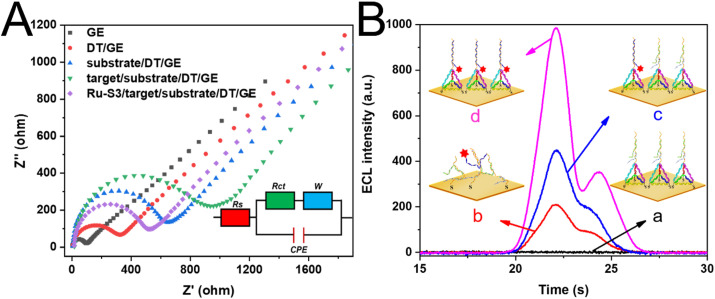
(A) EIS spectra for the assembly of the biosensor. The EIS experiments were performed in 0.1 M PBS buffer containing 5 mM Fe(CN)63−/4-. (B) ELC responses of (a) target/substrate/DT/GE, (b) the ECL intensity of thiolated T1*-based platform to construct biosensor for the detection of the target, (c) DT-based sensors without the participation of the target, (d) Ru–S3/target/substrate/DT/GE. The assay buffer was PBS buffer (0.1 M, pH = 7.4) containing 20 mM triethylamine, and the target concentration was 100 fM.
The ECL response for each assembly of the biosensor was also investigated (Fig. 2B). When the target/substrate/DT/GE was constructed, the ECL signal was detected almost to zero (curve a). While with the Ru (bpy)3 2+ modified S3 bound to the biosensor, an outstanding ECL signal was achieved (curve d). DT with programmable size was evenly distributed at a specific nanometer distance on GE, therefore appropriately arranging the density of the capture probe and significantly reducing the blocking effect. These properties would remarkably enhance the hybridization efficiency and increase the ECL response of the biosensor. To prove the gains of the DT for the biosensor, DT was substituted by a thiolated T1 probe (T1*) and directly modified on the GE (T1*/GE) for the fabrication of the ECL biosensor. As we could see, the ECL intensity of the DT-based platform (curve d) was almost 5 times that of the ssDNA-based platform (curve b), highlighting the merits of this programmable DNA nanostructure. Similarly, we graphically illustrate the entropy-driven reactions occurring with DT and T1* as capture probes and the noise-to-signal ratio quantitative analysis (47 for DT and 14 for T1*) as depicted in Figure S4, demonstrating the pros of DT. Besides, the target-triggered entropy-driven amplifying method (curve d) produced a stronger ECL signal than that without the participation of the target (curve c). The EIS and ECL response both indicated the successful construct of the ECL biosensor. Besides, the ECL responses also gave prominence to the significant advantages of the DT-based platform compared to the ssDNA-based platform, as well as highlighting the participation of target in the entropy-driven amplifying strategy.
We also optimized the experimental conditions of our biosensor, such as the concentration of DT, the incubation time of the target, and the immobilization time of Ru (bpy)3 2+ modified S3 to obtain optimal performance. In order to optimize the surface density of the DT on the GE, we prepared various concentrations of DT solutions to incubate with GE to test the signal with the presence of 100 fM target DNA. As shown in Fig. 3 A, the ECL intensity of our biosensor exhibited a trade-off that: the DT probe captured less target probe when the concentration was lower, resulting to a lower ECL signal; while DT probe with higher density would cause steric crowding and bring more adsorption of the non-specific probe, leading to a decreased signal. The highest ECL intensity was observed at a medium density when the optimized DT concentration was 1 μM. The incubation time of target DNA as a vital factor was also investigated, which greatly influence the target-participated entropy reaction. As shown in Fig. 3B, the most appropriate incubation was 0.5 h and chosen for further experiments. Besides the reaction of the Ru (bpy)3 2+ modified S3 was also investigated. As depicted in Fig. 3C, the ECL intensity monotonically along with the increasing reaction time of the Ru (bpy)3 2+ modified S3 and achieved an equilibrium status at 45 min. Therefore, the optimal incubation time of the Ru (bpy)3 2+ modified S3 was determined to be 45 min.
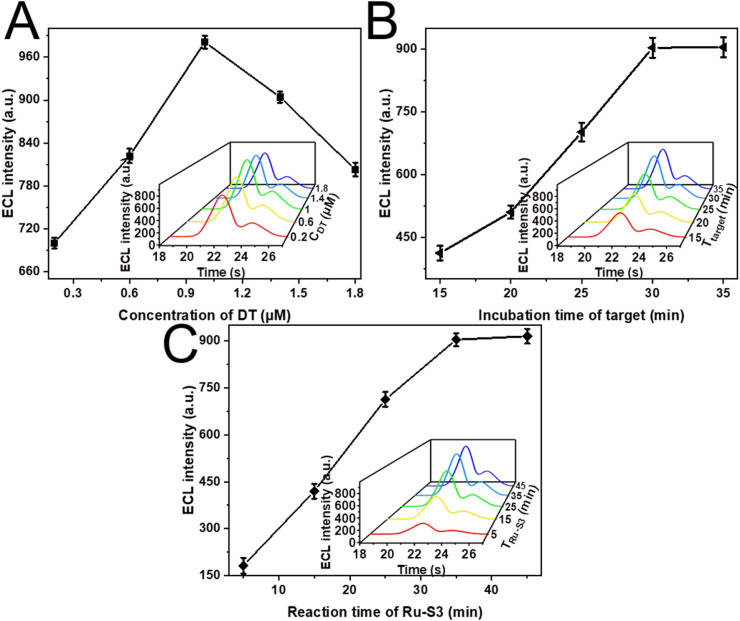
Optimization of (A) the concentration of DT incubated on the GE, incubation time of (B) target, and (C) Ru (bpy)32+ modified S3 involved in the entropy-driven reaction.
The assay performance of this DT-based entropy-driven ECL biosensor was also evaluated by measuring the ECL response at various concentrations of target DNA. Fig. 4 A showed that the ECL signal increased proportionally with the increasing concentration of target DNA. The excellent relationship (Fig. 4B) was also given between the ECL intensity (Y) and the logarithmical target concentration ranged from 1 fM to 100 p.m. The related linear relationship was Y = 97.7lgCtarget + 1069.9 with a correlation coefficient of 0.9987 and the limit of detection (LOD) was also calculated to be 2.67 fM by 3σ method, which was comparable with other existing methods for target DNA detection shown in Table S2, implying the high sensitivity of this strategy. Furthermore, we performed the recovery experiments of target DNA in real human serum to evaluate the practical application of this method, as depicted in Table 1 . Target DNA with different concentrations (10 fM, 100 fM and 1 pM) were spiked into human serum (15% and 10%) to simulate the assay process in real sample. The recoveries of all samples were between 98.21 and 102.3%, denoting the excellent application value for target DNA assays in real samples.
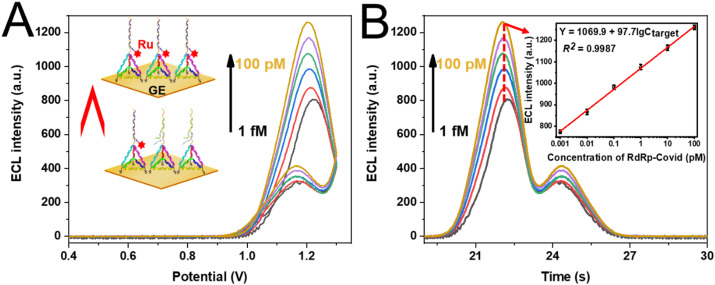
ECL-Potential (A) and ECL-Time (B) curves at various concentrations of RdRp-COVID (a) 1 fM, (b) 10 fM, (c) 100 fM, (d) 1 pM, (e) 10 pM, and (f) 100 pM, respectively. The inset in Fig. 4 (B) was the calibration curve of the ECL intensity versus the lgCRdRp-COVID. The ECL signal for each point with five individual experiments were performed in PBS buffer containing 20 mM TEA.

| Sample | Spiked (fM) | RdRp-COVID | ||
|---|---|---|---|---|
| Detected (fM) | RSD (%, n = 3) | Recovery (%) | ||
| Human serum (10%) | 0.01 | 0.01022 | 2.60 | 102.2 |
| 0.1 | 0.09951 | 2.19 | 99.51 | |
| 1 | 1.023 | 1.22 | 102.3 | |
| Human serum (15%) | 0.01 | 0.01013 | 1.03 | 101.3 |
| 0.1 | 0.09821 | 1.27 | 98.21 | |
| 1 | 1.019 | 1.26 | 101.9 | |
The selectivity of this biosensor had also been assessed by evaluating the ECL intensity of the four types of DNA sequences (target DNA, RdRp-SARS DNA, single-base mismatched DNA, three-base mismatched DNA) and the blank sample. Fig. 5 A showed that the ECL intensity was much higher in the presence of the target DNA (bar a) than the blank sample (bar b) and other non-specific DNA sequences (bar c–d), revealing the high selectivity of the fabricated DT-based entropy-driven biosensor for RdRp-COVID sequence detection. The stability of the ECL sensing platform, as another significant indicator, was also investigated by measuring the ECL responses when detecting target DNA at various concentrations (10 fM, 100 fM and 1pM) under successive potential scans (Fig. 5B), with the calculated relative standard deviation (RSD) was 1.40%, 1.30% and 1.53%, respectively, indicating the excellent stability of the DT-based ECL sensor.
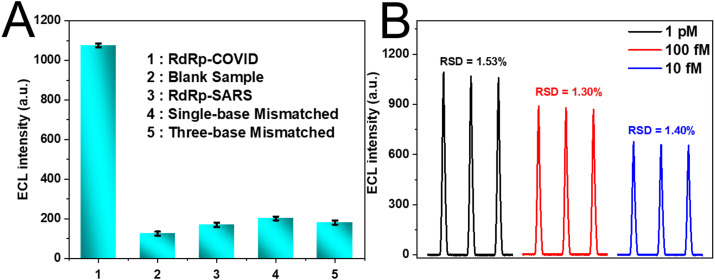
(A) The selectivity of the DT-based ECL sensor. The concentrations of RdRp-COVID and other non-specific DNA were 1 pM and 10 pM, respectively. (B) The ECL curves of the ECL sensor for detecting RdRp-COVID with various concentrations under continuous potential scans.
In summary, a DT-based ECL biosensor for the sensitive assay of RdRp-COVID via entropy-driven cascade amplifying strategy. This target DNA participated entropy-driven reaction occurs on the DT to facilitate the immobilization of the Ru (bpy)3 2+ modified S3, since the distance between the electrode and the emitter is fixed, which partially enhances the emitting efficiency of ECL emitter and reduces the interferences of non-specifically adsorbed probes, showing superior recognition to the target. Given the modularity and scalability of entropy-driven cascade circuit, the versatility of various DNA target is prone to implementation without any involvement of nuclease, demonstrating the excellent advantages in cost, sensitivity, operation over ECL bioassays. Moreover, this sensing platform provides a novel route for simultaneous assay of RdRp-COVID sequence with high selectivity and sensitivity in human serum samples, expanding the practical application of programmable DNA and target DNA catalyzed enzyme-free amplifying reaction.
Zhenqiang Fan: Data curation, Characterization, Writing - review & editing, Writing-Reviewing and Editing. Bo Yao: Software. Yuedi Ding: Validation. Jing Zhao: Revision discussion, Reviewing. Minhao Xie: Reviewing. Kai Zhang: Conceptualization, Reviewing.
The authors declare that they have no known competing financial interests or personal relationships that could have appeared to influence the work reported in this paper.
This work was supported by the National Natural Science Foundation of China (21705061), the Shanghai Pujiang Program (2019PJD018) and the Jiangsu Provincial Key Medical Discipline (Laboratory) (ZDXKA2016017), the Innovation Capacity Development Plan of Jiangsu Province (BM2018023).
 Entropy-driven amplified electrochemiluminescence biosensor for RdRp gene of SARS-CoV-2 detection with self-assembled DNA tetrahedron scaffolds
 Facebook
 Twitter
 Linkedin
 Whatsapp
